| Param | Original file | Final file |
|---|---|---|
| Filename | modeM0/AS1G08_009T01_9000001692_11540cztM0_level2.evt | modeM0/AS1G08_009T01_9000001692_11540cztM0_level2_quad_clean.evt |
| Size (bytes) | 623,770,560 | 107,899,200 |
| Size | 594.9 MB | 102.9 MB |
| Events in quadrant A | 5,178,128 | 689,035 |
| Events in quadrant B | 5,063,705 | 682,617 |
| Events in quadrant C | 3,551,255 | 691,801 |
| Events in quadrant D | 4,565,724 | 657,854 |
| Mode M0 | |||
|---|---|---|---|
| Quadrant | BADHDUFLAG | Total packets | Discarded packets |
| A | 0 | 20620 | 3 |
| B | 0 | 20321 | 2 |
| C | 0 | 16212 | 2 |
| D | 0 | 18929 | 2 |
| Mode M9 | |||
|---|---|---|---|
| Quadrant | BADHDUFLAG | Total packets | Discarded packets |
| A | 0 | 8 | 0 |
| B | 0 | 8 | 0 |
| C | 0 | 8 | 0 |
| D | 0 | 8 | 0 |
| Mode SS | |||
|---|---|---|---|
| Quadrant | BADHDUFLAG | Total packets | Discarded packets |
| A | 0 | 160 | 0 |
| B | 0 | 160 | 0 |
| C | 0 | 160 | 0 |
| D | 0 | 160 | 0 |
| Quadrant | Total seconds | Saturated seconds | Saturation percentage |
|---|---|---|---|
| A | 7859 | 260 | 3.308309% |
| B | 7859 | 399 | 5.076982% |
| C | 7859 | 28 | 0.356279% |
| D | 7859 | 182 | 2.315816% |
Noise dominated data is calculated using 1-second bins in cleaned event files. If a bin has >2000 counts, and if more than 50% of those come from <1% of pixels, then it is considered to be noise-dominated and hence unusable.
| Quadrant | # 1 sec bins | Bins with >0 counts | Bins with >2000 counts | High rate bins dominated by noise | Noise dominated (total time) | Noise dominated (detector-on time) | Marked lightcurve |
|---|---|---|---|---|---|---|---|
| A | 8655 | 7862 | 88 | 88 | 1.02% | 1.12% | 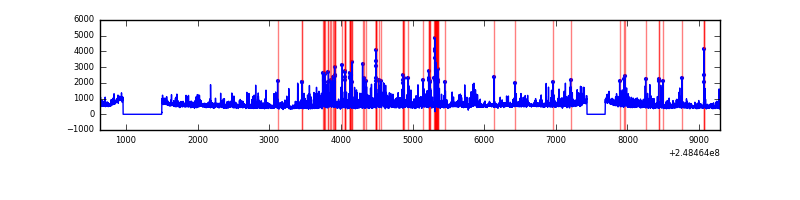 |
| B | 8655 | 7862 | 175 | 175 | 2.02% | 2.23% | 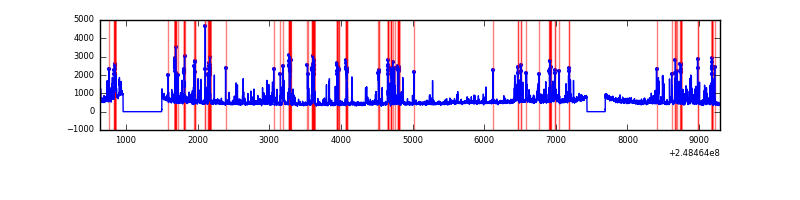 |
| C | 8655 | 7862 | 0 | 0 | 0.00% | 0.00% | 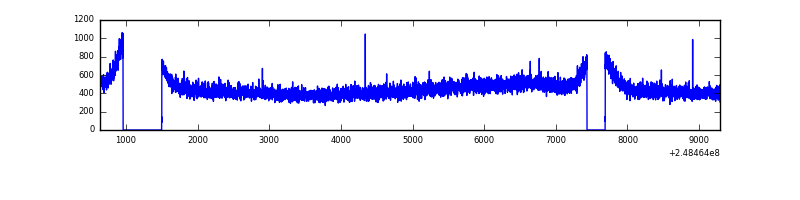 |
| D | 8655 | 7862 | 108 | 108 | 1.25% | 1.37% | 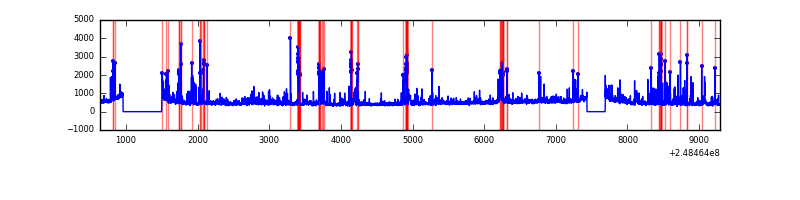 |
Top three noisy pixels from each quadrant. If the there are fewer than three noisy pixels in the level2.evt file, extra rows are filled as -1
| Pixel properties | Quadrant properties | ||||||
|---|---|---|---|---|---|---|---|
| Quadrant | DetID | PixID | Counts | Sigma | Mean | Median | Sigma |
| A | 8 | 5 | 1073040 | 5545.74 | 939 | 916 | 193.3 |
| A | 1 | 162 | 134773 | 692.4 | 939 | 916 | 193.3 |
| A | 9 | 143 | 113732 | 583.56 | 939 | 916 | 193.3 |
| B | 4 | 239 | 1212323 | 6754.35 | 933 | 912 | 179.4 |
| B | 15 | 204 | 131847 | 730.04 | 933 | 912 | 179.4 |
| B | 12 | 111 | 20157 | 107.3 | 933 | 912 | 179.4 |
| C | 13 | 61 | 6721 | 27.25 | 911 | 915 | 213.1 |
| C | 3 | 202 | 2255 | 6.29 | 911 | 915 | 213.1 |
| C | -1 | -1 | -1 | -1.0 | 911 | 915 | 213.1 |
| D | 1 | 52 | 467340 | 2127.31 | 905 | 878 | 219.3 |
| D | 2 | 120 | 147205 | 667.33 | 905 | 878 | 219.3 |
| D | 13 | 137 | 110067 | 497.96 | 905 | 878 | 219.3 |
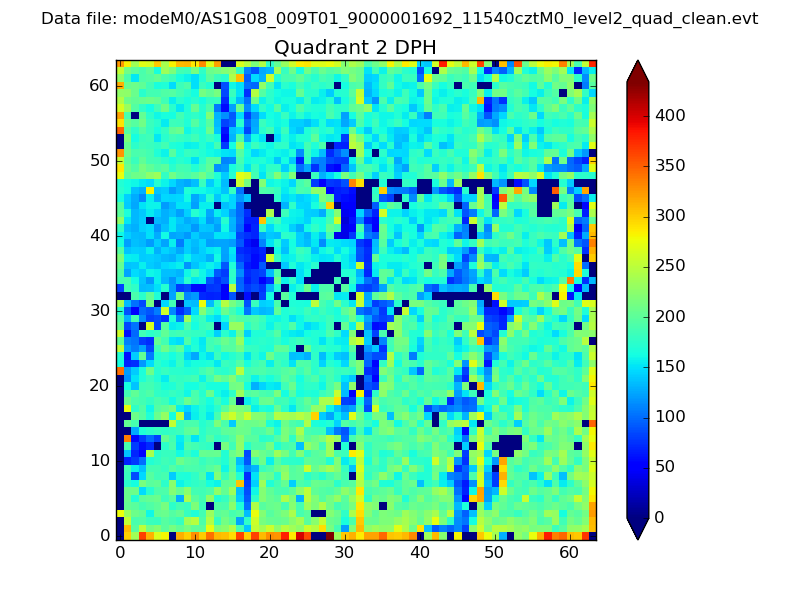
Histogram calculated using DETX and DETY for each event in the final _common_clean file
| Quadrant A | 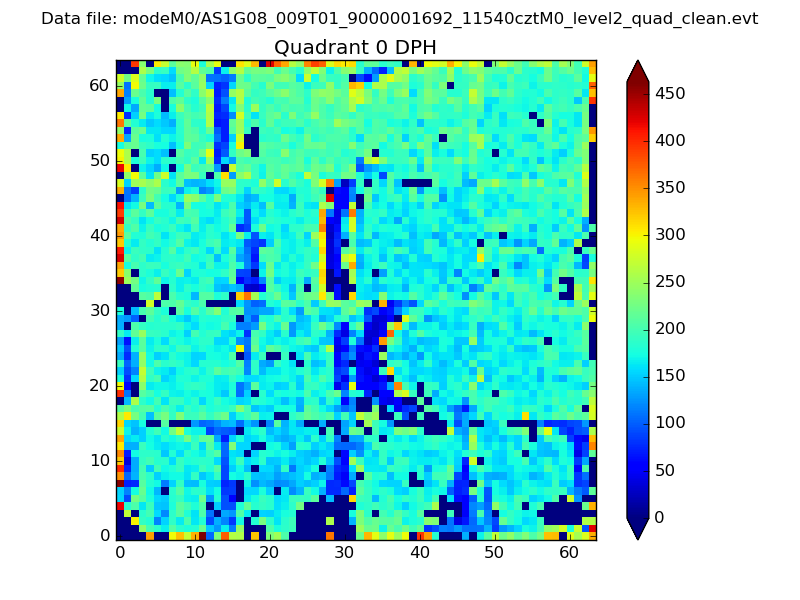 |
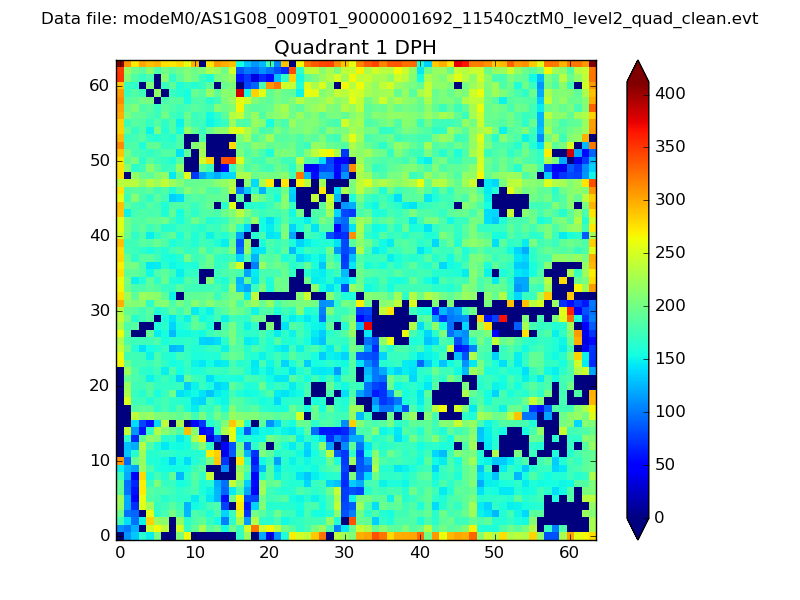 |
Quadrant B |
|---|---|---|---|
| Quadrant D | 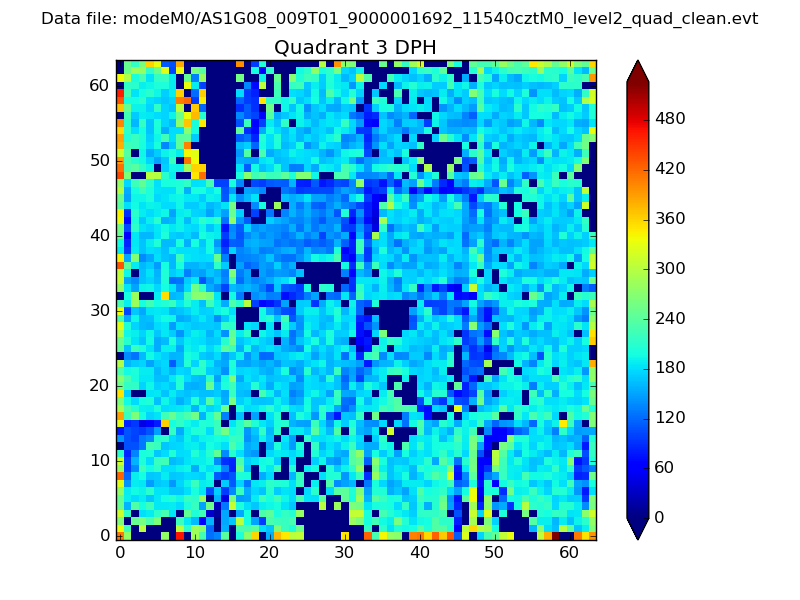 |
 |
Quadrant C |
| Plot type | Count rate plots | Images |
|---|---|---|
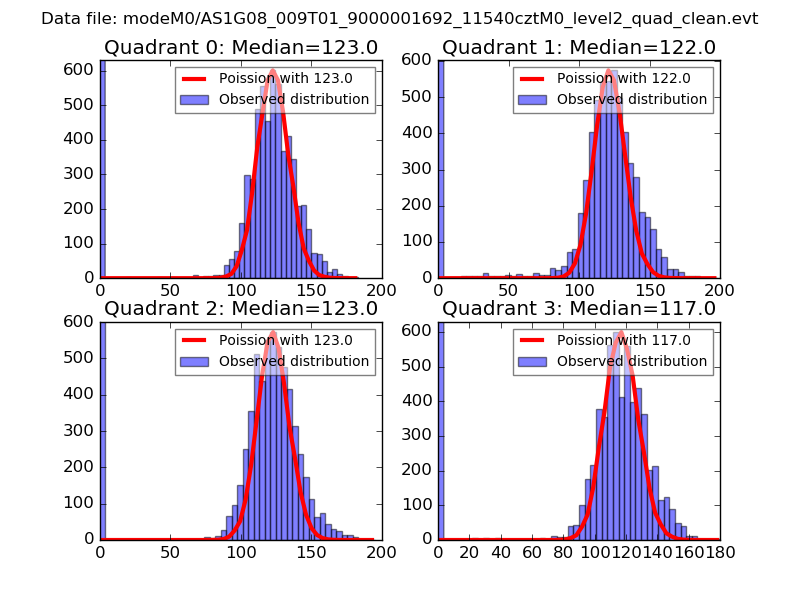
| Comparison with Poisson distribution Blue bars denote a histogram of data divided into 1 sec bins. Red curve is a Poisson curve with rate = median count rate of data. |
 |
 |
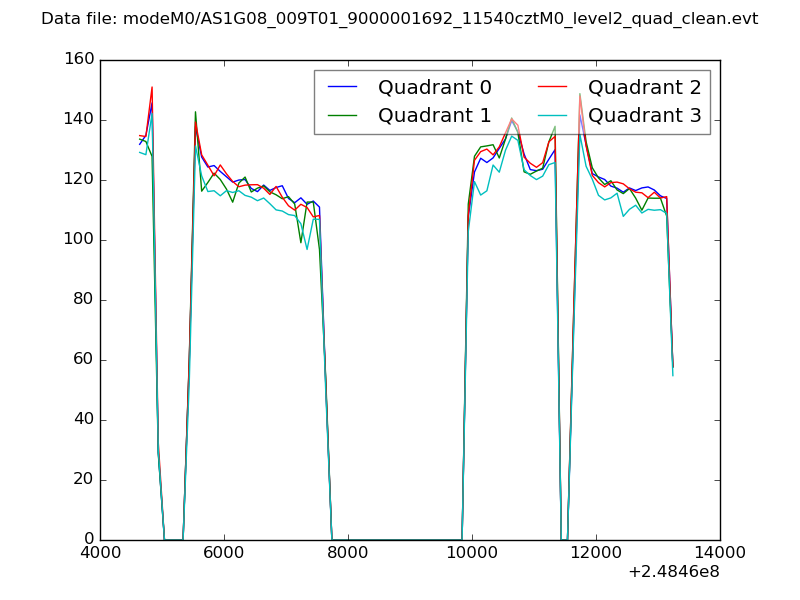
| Quadrant-wise count rates Data is divided into 100 sec bins |
 |
|
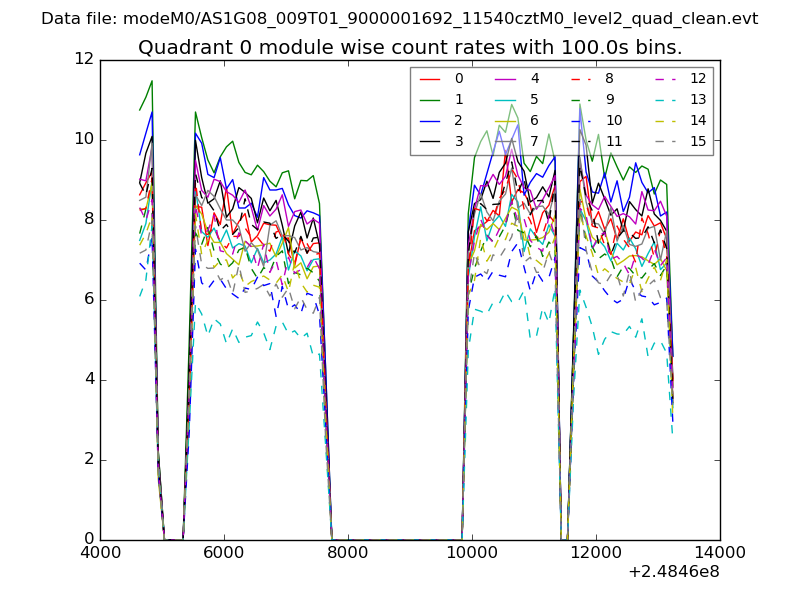
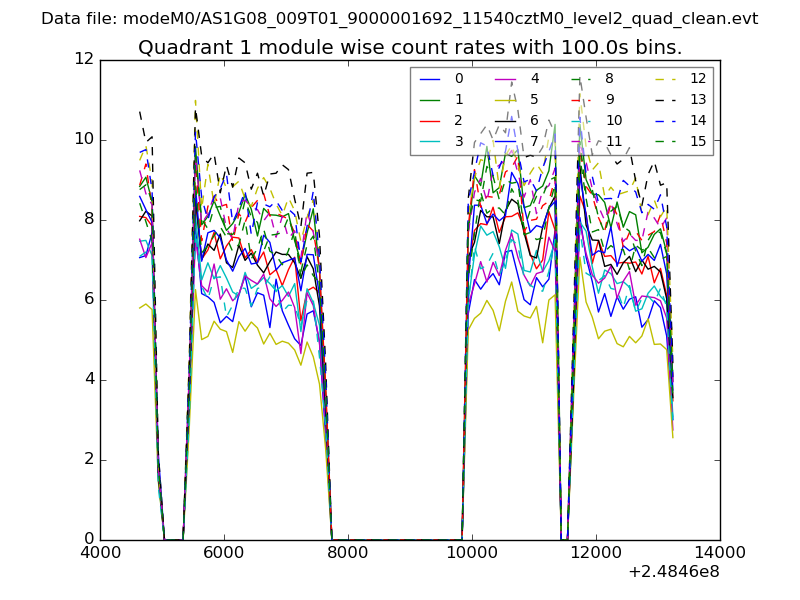
| Module-wise count rates for Quadrant A Data is divided into 100 sec bins |
 |
 |
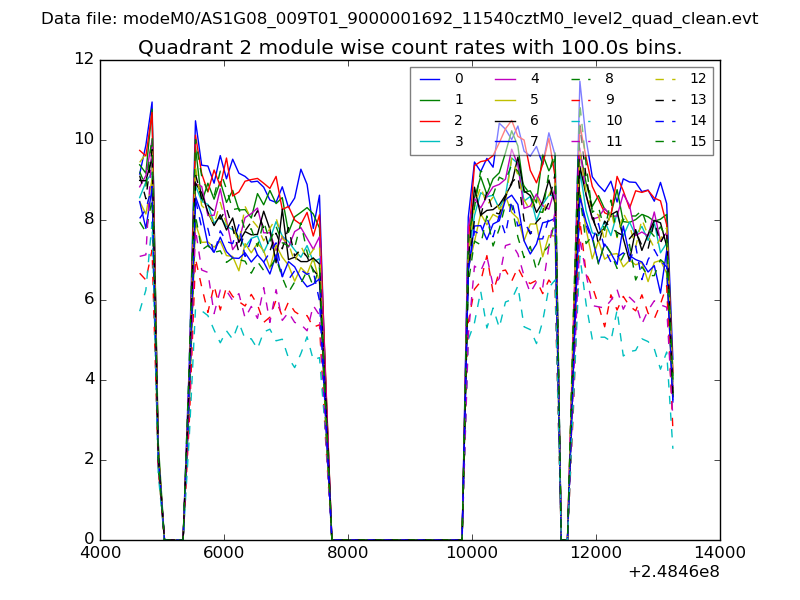
| Module-wise count rates for Quadrant B Data is divided into 100 sec bins |
 |
 |
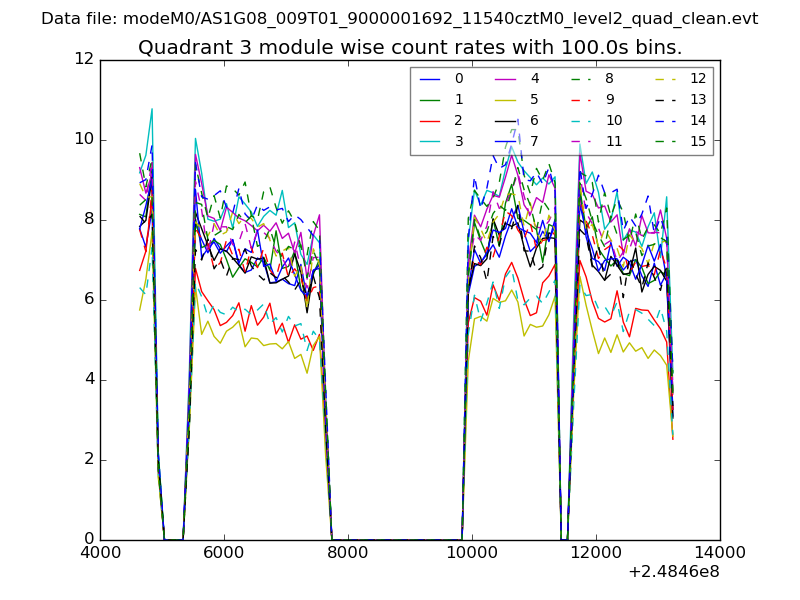
| Module-wise count rates for Quadrant C Data is divided into 100 sec bins |
 |
 |
| Module-wise count rates for Quadrant D Data is divided into 100 sec bins |
 |
 |
| Parameter | Plot |
|---|---|
| CZT HV Monitor | 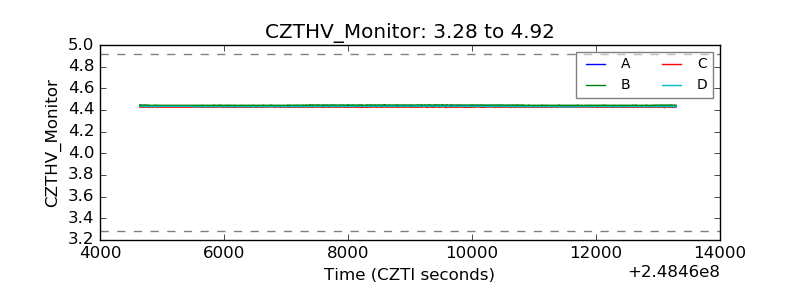 |
| D_VDD | 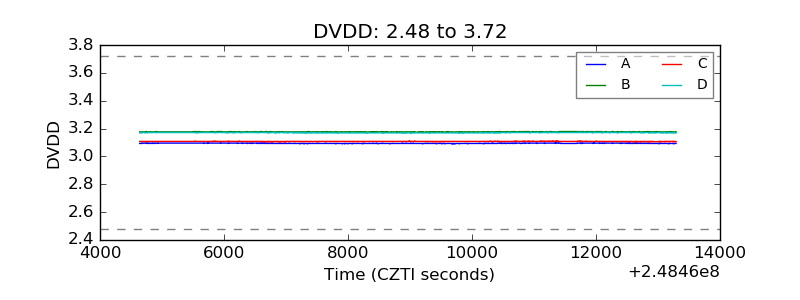 |
| Temperature 1 | 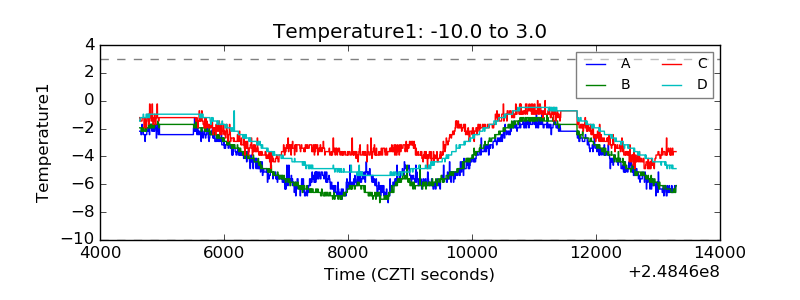 |
| Veto HV Monitor | 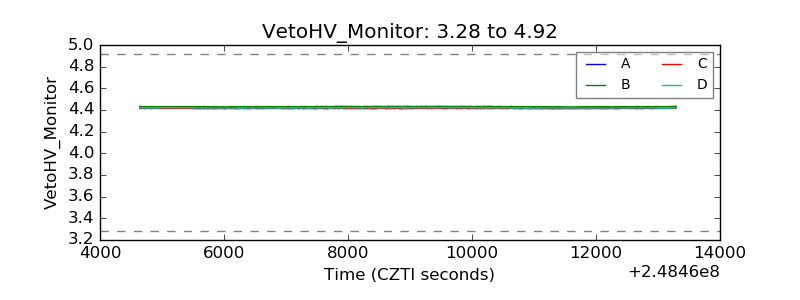 |
| Veto LLD | 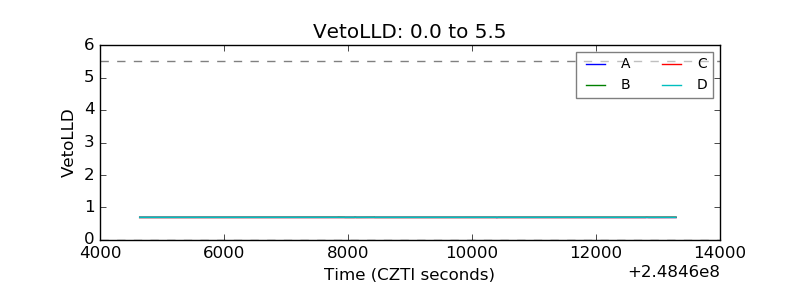 |
| Alpha Counter | 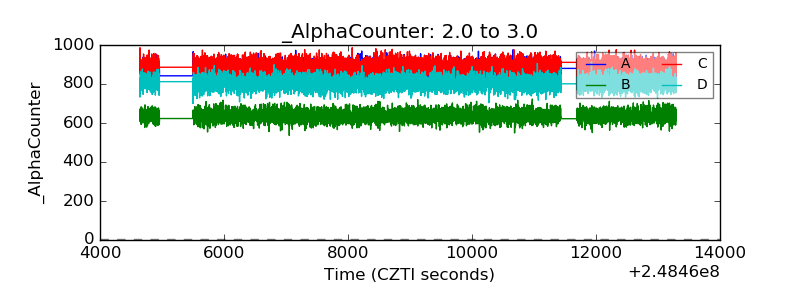 |
| _CPM_Rate | 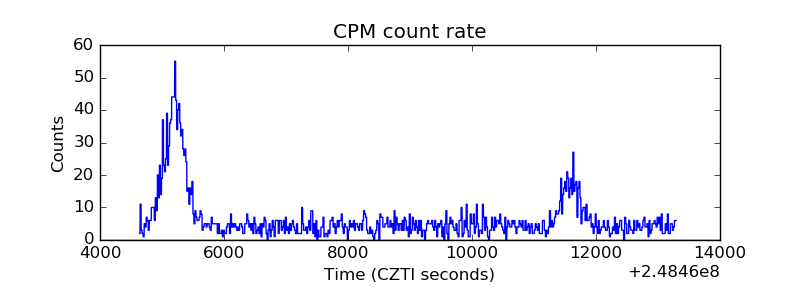 |
| CZT Counter | 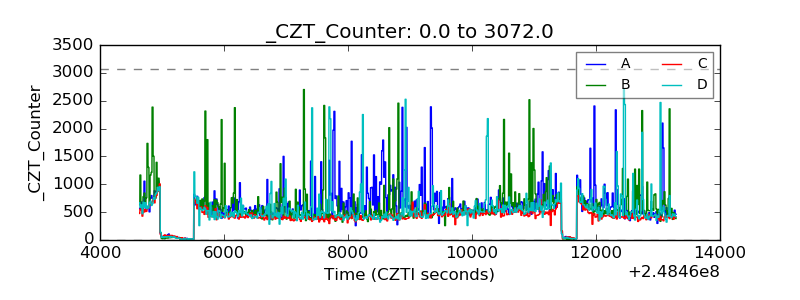 |
| +2.5 Volts monitor |  |
| +5 Volts monitor | 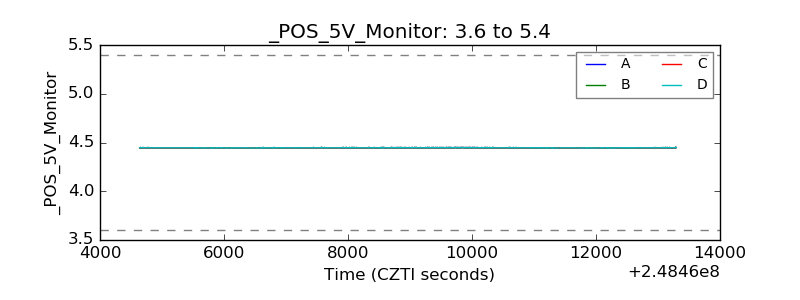 |
| _ROLL_ROT | 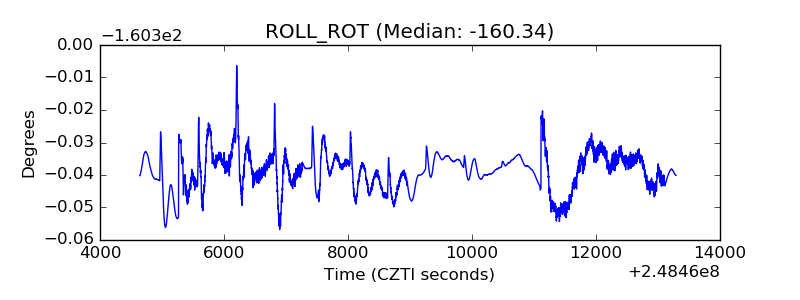 |
| _Roll_DEC | 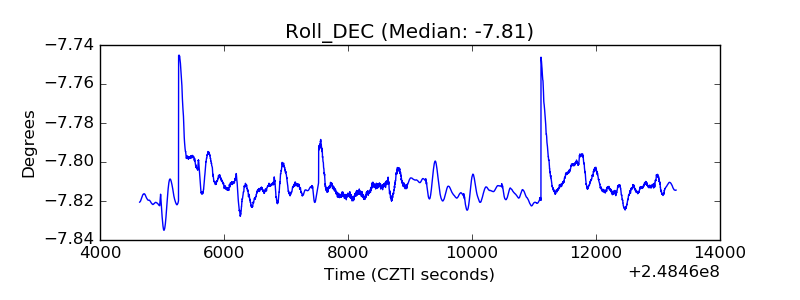 |
| _Roll_RA | 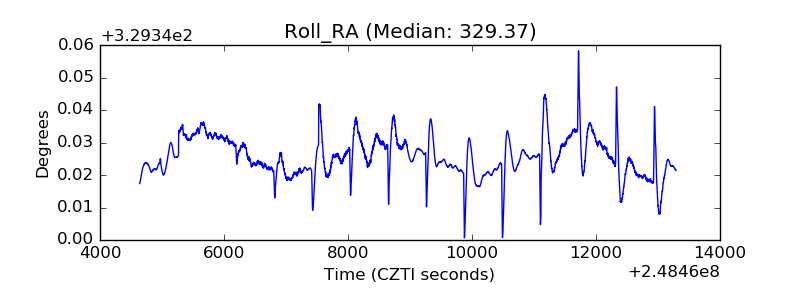 |
| Veto Counter | 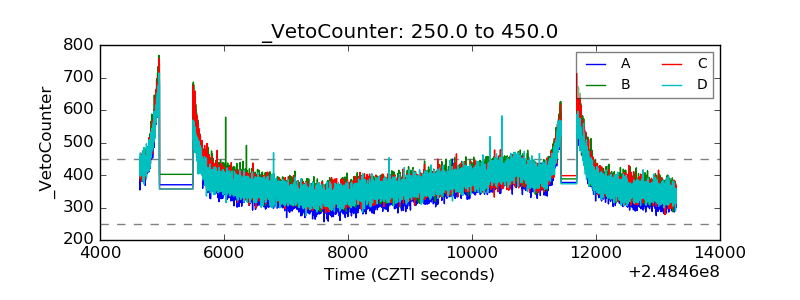 |