| Param | Original file | Final file |
|---|---|---|
| Filename | modeM0/AS1G08_009T01_9000001692_11541cztM0_level2.evt | modeM0/AS1G08_009T01_9000001692_11541cztM0_level2_quad_clean.evt |
| Size (bytes) | 700,914,240 | 111,726,720 |
| Size | 668.4 MB | 106.6 MB |
| Events in quadrant A | 7,010,638 | 688,223 |
| Events in quadrant B | 5,507,425 | 708,743 |
| Events in quadrant C | 3,721,398 | 718,378 |
| Events in quadrant D | 4,423,853 | 689,018 |
| Mode M0 | |||
|---|---|---|---|
| Quadrant | BADHDUFLAG | Total packets | Discarded packets |
| A | 0 | 26526 | 3 |
| B | 0 | 21967 | 2 |
| C | 0 | 17046 | 2 |
| D | 0 | 19035 | 2 |
| Mode M9 | |||
|---|---|---|---|
| Quadrant | BADHDUFLAG | Total packets | Discarded packets |
| A | 0 | 5 | 0 |
| B | 0 | 5 | 0 |
| C | 0 | 5 | 0 |
| D | 0 | 5 | 0 |
| Mode SS | |||
|---|---|---|---|
| Quadrant | BADHDUFLAG | Total packets | Discarded packets |
| A | 0 | 172 | 0 |
| B | 0 | 172 | 0 |
| C | 0 | 172 | 0 |
| D | 0 | 172 | 0 |
| Quadrant | Total seconds | Saturated seconds | Saturation percentage |
|---|---|---|---|
| A | 8329 | 725 | 8.704526% |
| B | 8329 | 411 | 4.934566% |
| C | 8329 | 23 | 0.276144% |
| D | 8329 | 93 | 1.116581% |
Noise dominated data is calculated using 1-second bins in cleaned event files. If a bin has >2000 counts, and if more than 50% of those come from <1% of pixels, then it is considered to be noise-dominated and hence unusable.
| Quadrant | # 1 sec bins | Bins with >0 counts | Bins with >2000 counts | High rate bins dominated by noise | Noise dominated (total time) | Noise dominated (detector-on time) | Marked lightcurve |
|---|---|---|---|---|---|---|---|
| A | 8905 | 8331 | 374 | 374 | 4.20% | 4.49% | 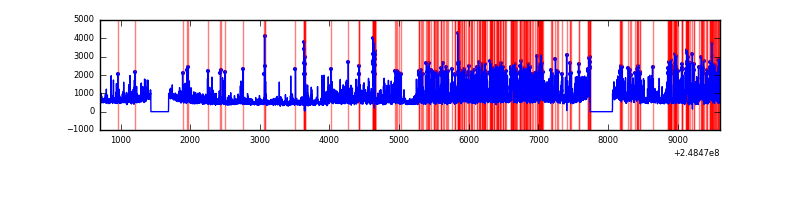 |
| B | 8905 | 8332 | 217 | 217 | 2.44% | 2.60% | 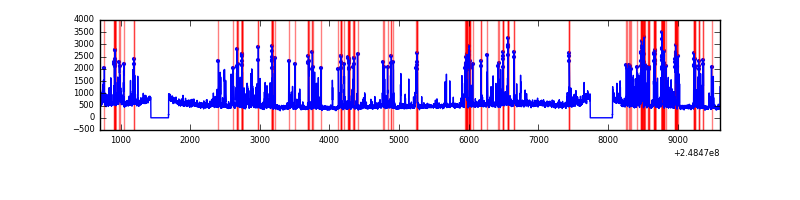 |
| C | 8905 | 8332 | 0 | 0 | 0.00% | 0.00% | 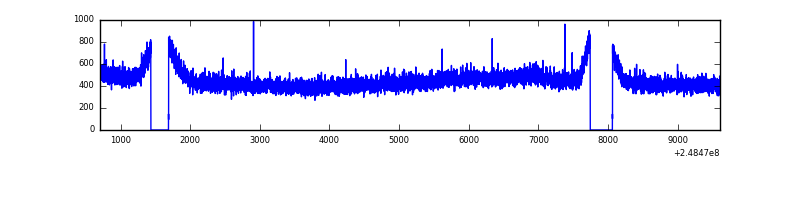 |
| D | 8905 | 8332 | 56 | 56 | 0.63% | 0.67% | 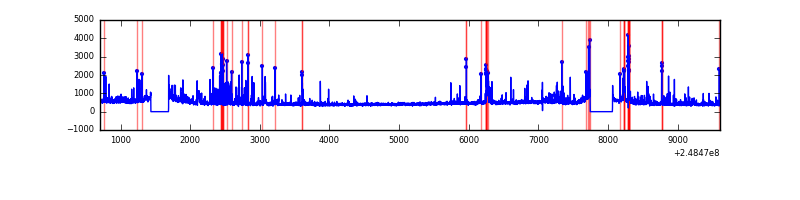 |
Top three noisy pixels from each quadrant. If the there are fewer than three noisy pixels in the level2.evt file, extra rows are filled as -1
| Pixel properties | Quadrant properties | ||||||
|---|---|---|---|---|---|---|---|
| Quadrant | DetID | PixID | Counts | Sigma | Mean | Median | Sigma |
| A | 8 | 5 | 2773792 | 14159.36 | 960 | 940 | 195.8 |
| A | 1 | 162 | 173605 | 881.7 | 960 | 940 | 195.8 |
| A | 1 | 178 | 104553 | 529.09 | 960 | 940 | 195.8 |
| B | 4 | 239 | 1359444 | 7230.43 | 979 | 953 | 187.9 |
| B | 15 | 204 | 133699 | 706.53 | 979 | 953 | 187.9 |
| B | 11 | 51 | 78372 | 412.05 | 979 | 953 | 187.9 |
| C | 13 | 61 | 6892 | 26.71 | 954 | 959 | 222.1 |
| C | 3 | 202 | 2410 | 6.53 | 954 | 959 | 222.1 |
| C | 7 | 247 | 2100 | 5.13 | 954 | 959 | 222.1 |
| D | 1 | 52 | 283672 | 1223.14 | 953 | 927 | 231.2 |
| D | 2 | 120 | 153562 | 660.29 | 953 | 927 | 231.2 |
| D | 13 | 104 | 105106 | 450.67 | 953 | 927 | 231.2 |
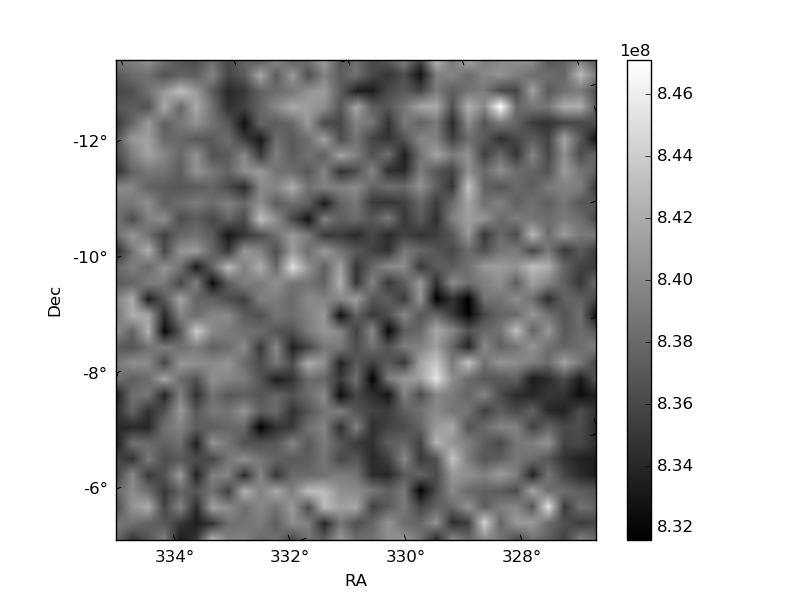
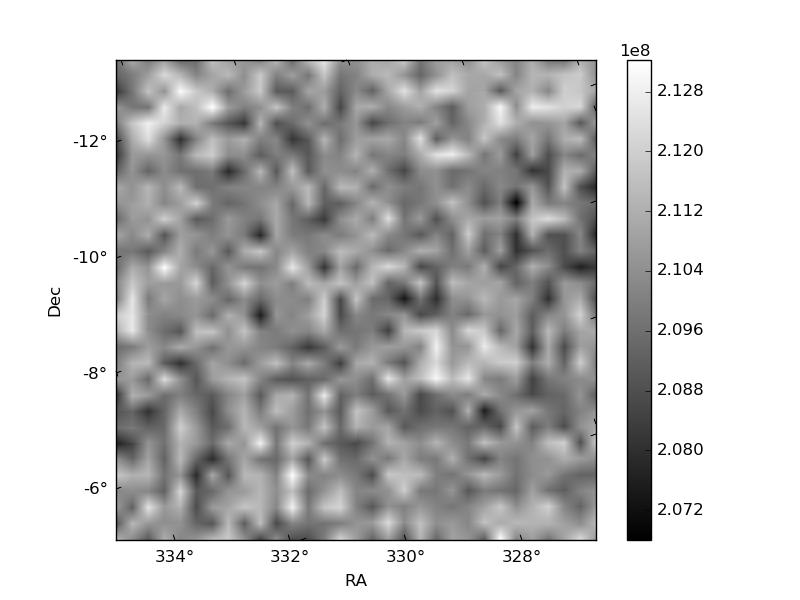
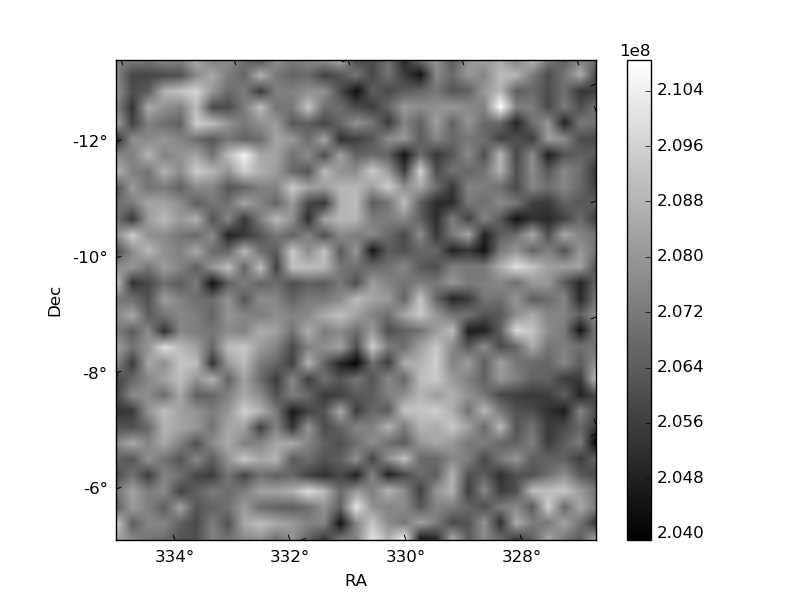
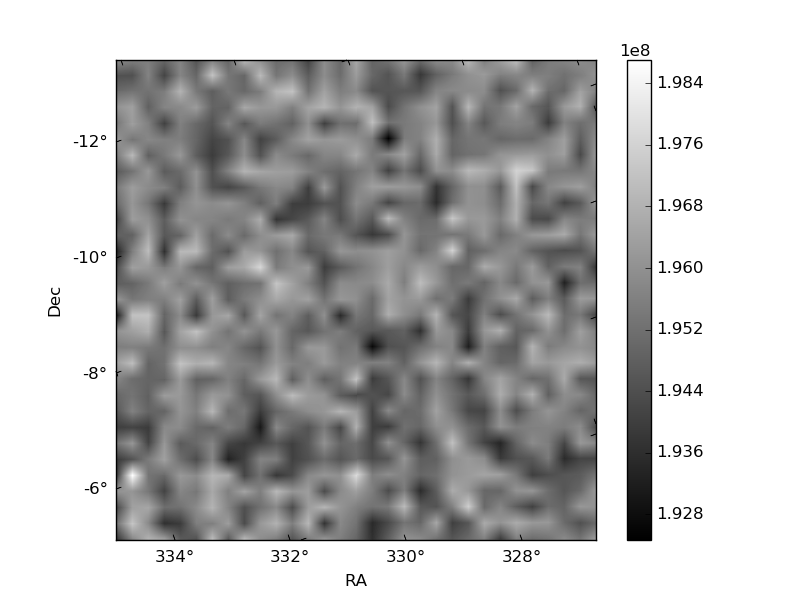
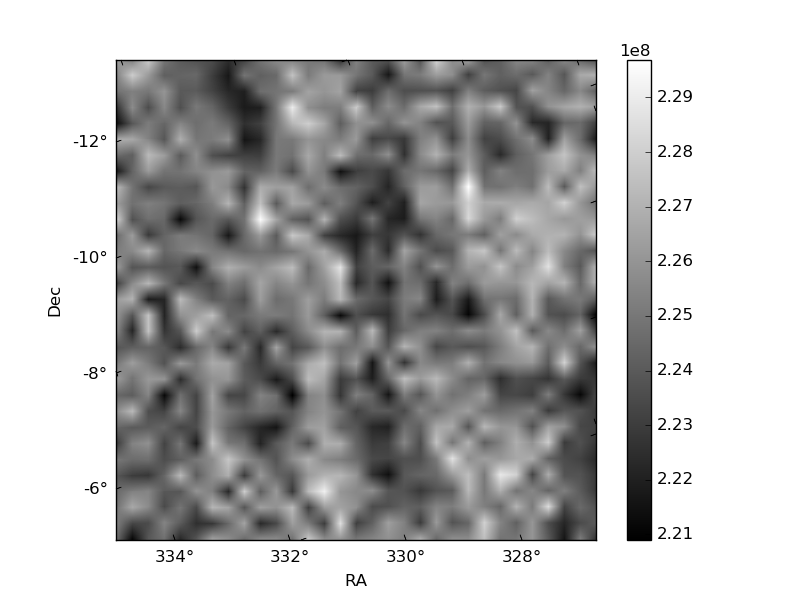
Histogram calculated using DETX and DETY for each event in the final _common_clean file
| Quadrant A | 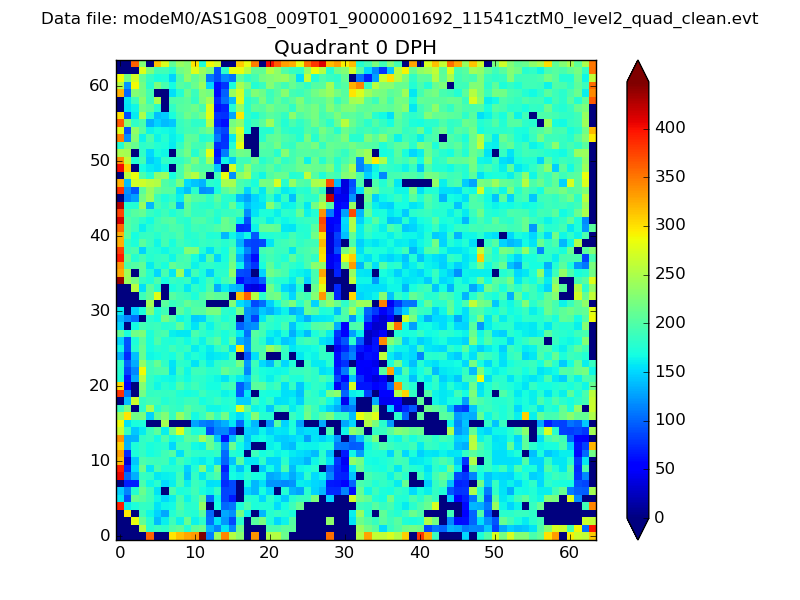 |
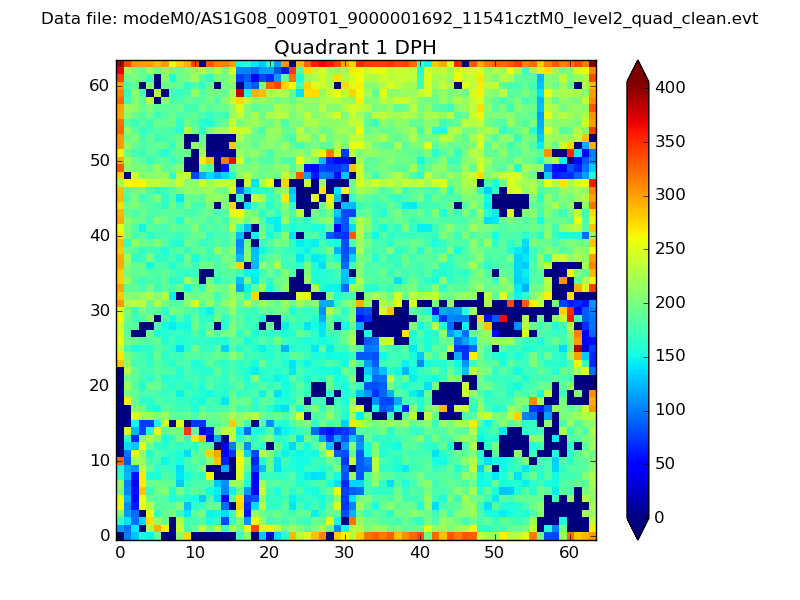 |
Quadrant B |
|---|---|---|---|
| Quadrant D | 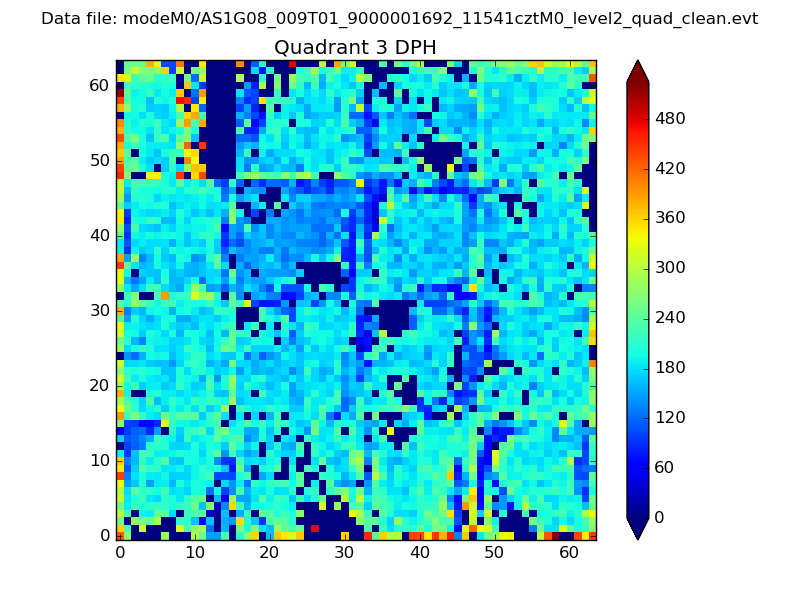 |
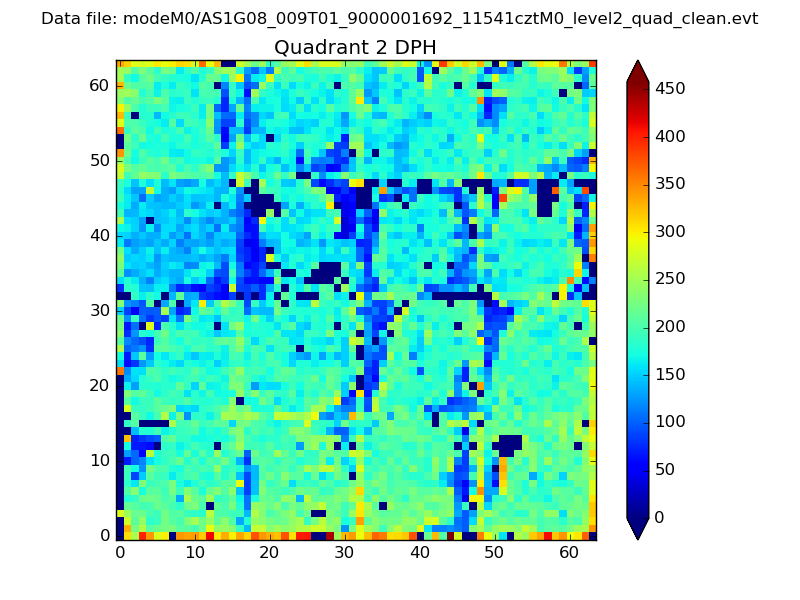 |
Quadrant C |
| Plot type | Count rate plots | Images |
|---|---|---|
| Comparison with Poisson distribution Blue bars denote a histogram of data divided into 1 sec bins. Red curve is a Poisson curve with rate = median count rate of data. |
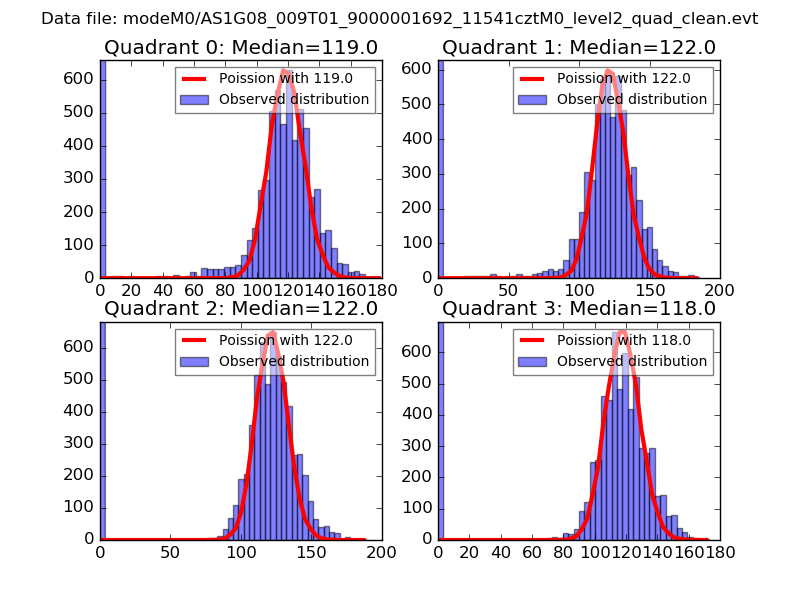 |
 |
| Quadrant-wise count rates Data is divided into 100 sec bins |
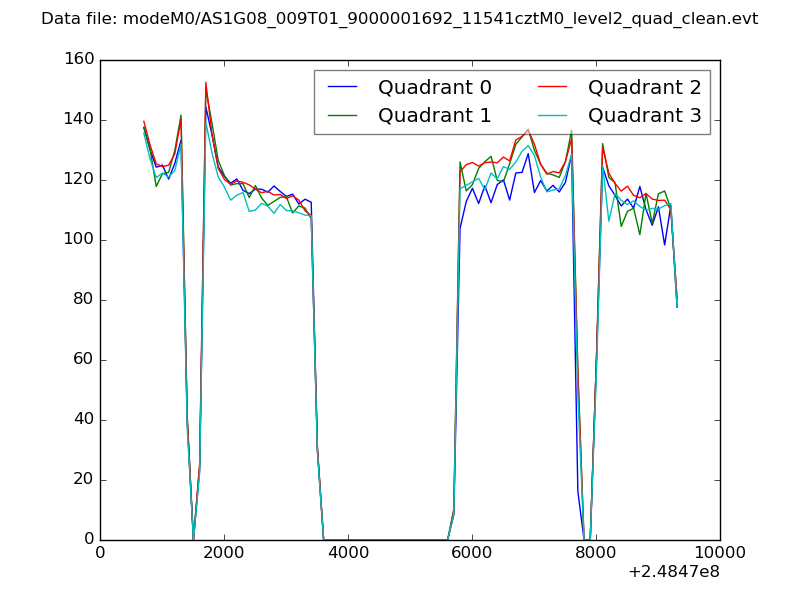 |
|
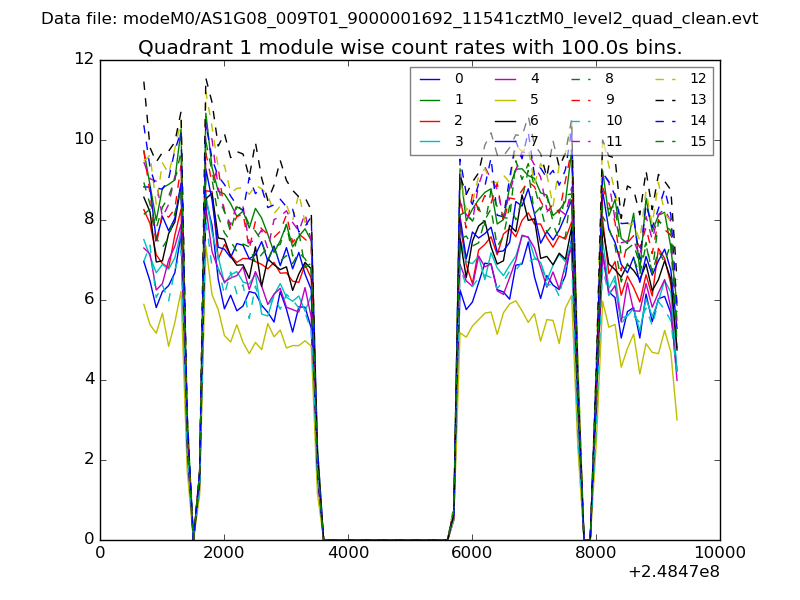
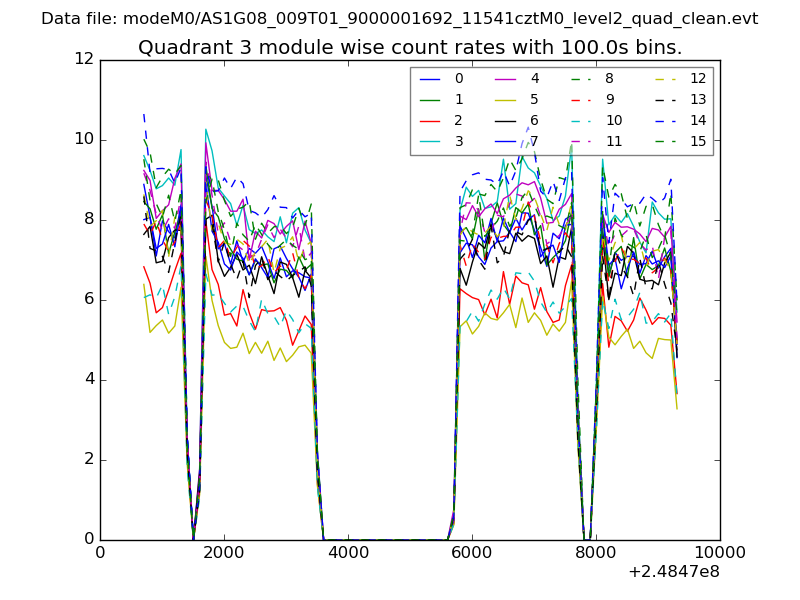
| Module-wise count rates for Quadrant A Data is divided into 100 sec bins |
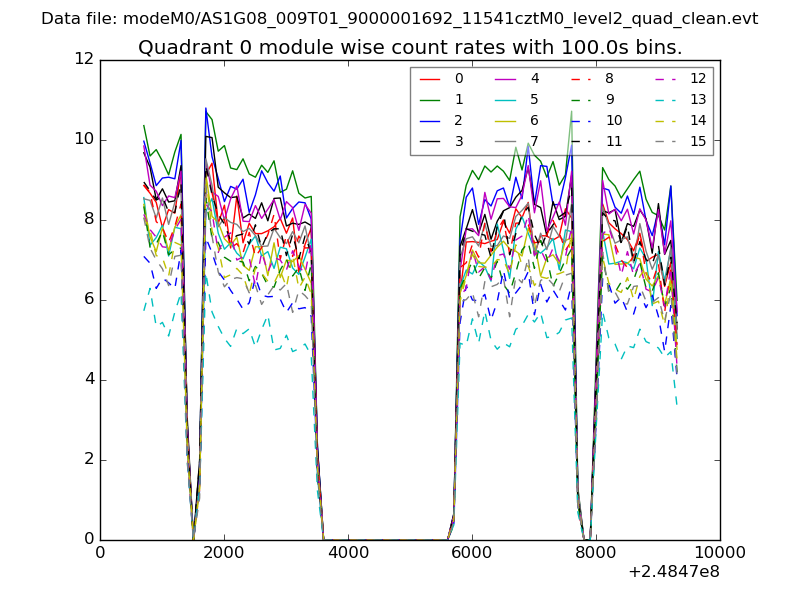 |
 |
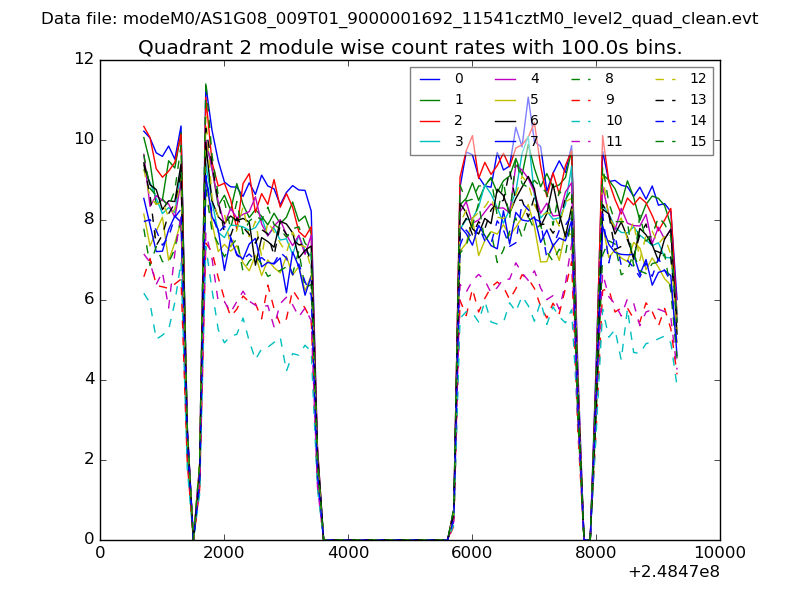
| Module-wise count rates for Quadrant B Data is divided into 100 sec bins |
 |
 |
| Module-wise count rates for Quadrant C Data is divided into 100 sec bins |
 |
 |
| Module-wise count rates for Quadrant D Data is divided into 100 sec bins |
 |
 |
| Parameter | Plot |
|---|---|
| CZT HV Monitor | 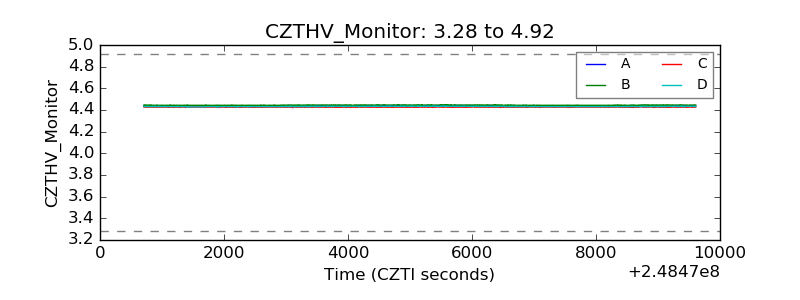 |
| D_VDD | 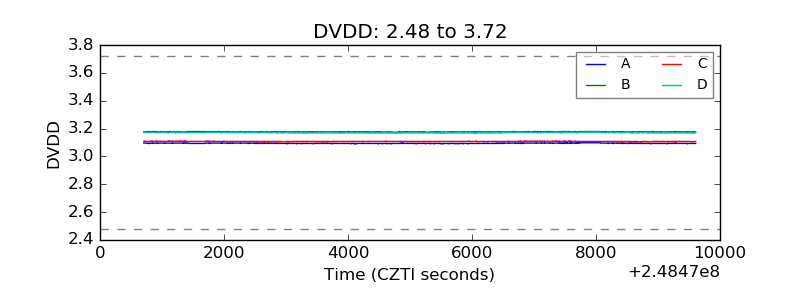 |
| Temperature 1 |  |
| Veto HV Monitor | 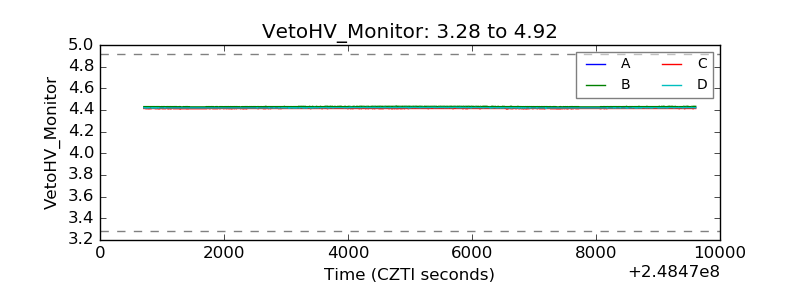 |
| Veto LLD | 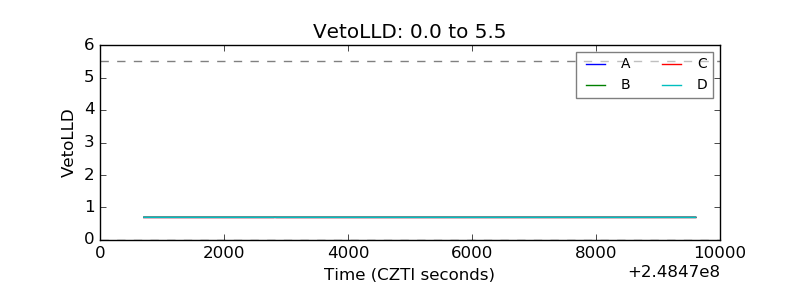 |
| Alpha Counter | 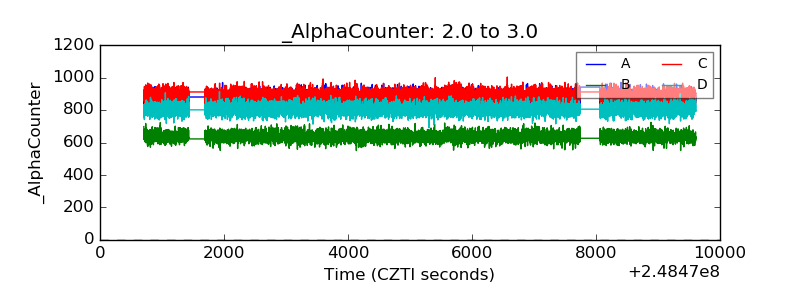 |
| _CPM_Rate | 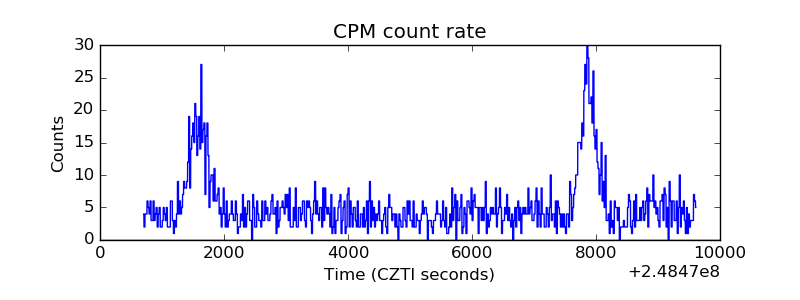 |
| CZT Counter | 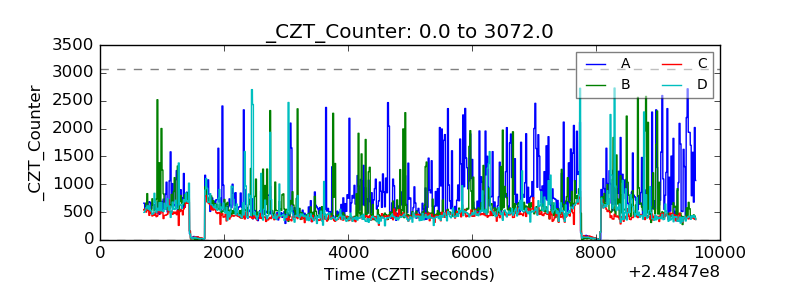 |
| +2.5 Volts monitor |  |
| +5 Volts monitor |  |
| _ROLL_ROT | 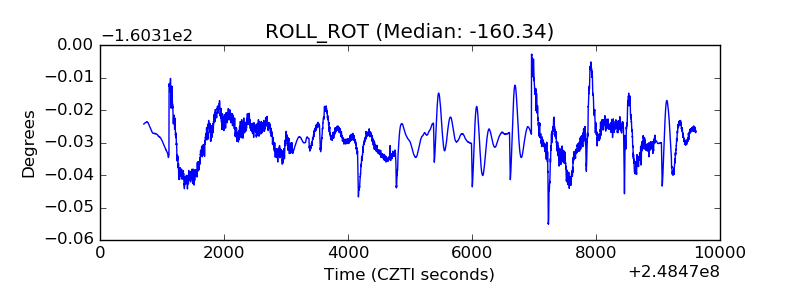 |
| _Roll_DEC |  |
| _Roll_RA | 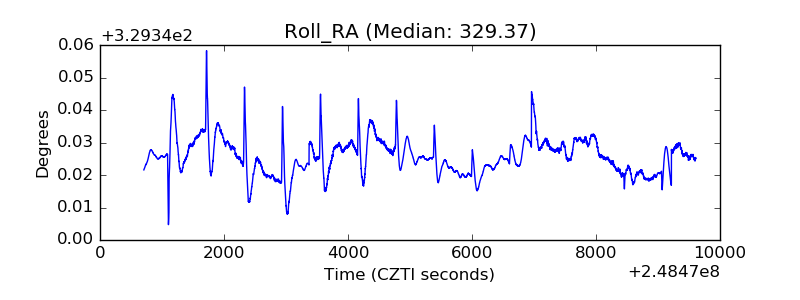 |
| Veto Counter | 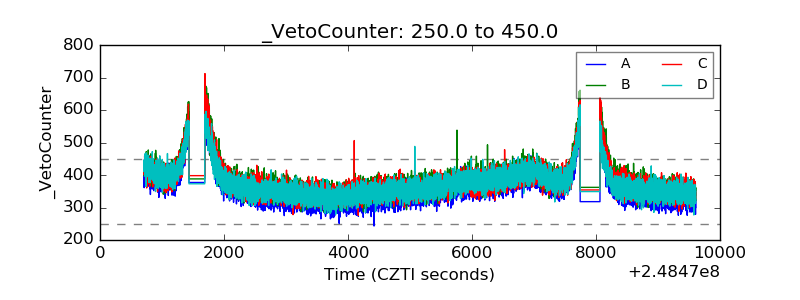 |