| Param | Original file | Final file |
|---|---|---|
| Filename | modeM0/AS1G08_009T01_9000001692_11544cztM0_level2.evt | modeM0/AS1G08_009T01_9000001692_11544cztM0_level2_quad_clean.evt |
| Size (bytes) | 1,241,124,480 | 135,587,520 |
| Size | 1.2 GB | 129.3 MB |
| Events in quadrant A | 10,630,097 | 794,121 |
| Events in quadrant B | 9,299,436 | 789,982 |
| Events in quadrant C | 6,756,688 | 779,754 |
| Events in quadrant D | 9,896,649 | 714,420 |
| Mode M0 | |||
|---|---|---|---|
| Quadrant | BADHDUFLAG | Total packets | Discarded packets |
| A | 0 | 44394 | 2712 |
| B | 0 | 38856 | 1582 |
| C | 0 | 31781 | 1446 |
| D | 0 | 41427 | 1530 |
| Mode M9 | |||
|---|---|---|---|
| Quadrant | BADHDUFLAG | Total packets | Discarded packets |
| A | 0 | 18 | 0 |
| B | 0 | 18 | 0 |
| C | 0 | 18 | 0 |
| D | 0 | 18 | 0 |
| Mode SS | |||
|---|---|---|---|
| Quadrant | BADHDUFLAG | Total packets | Discarded packets |
| A | 0 | 320 | 16 |
| B | 0 | 319 | 15 |
| C | 0 | 319 | 15 |
| D | 0 | 320 | 20 |
| Quadrant | Total seconds | Saturated seconds | Saturation percentage |
|---|---|---|---|
| A | 14839 | 640 | 4.312959% |
| B | 14898 | 658 | 4.416700% |
| C | 14918 | 76 | 0.509452% |
| D | 14883 | 772 | 5.187126% |
Noise dominated data is calculated using 1-second bins in cleaned event files. If a bin has >2000 counts, and if more than 50% of those come from <1% of pixels, then it is considered to be noise-dominated and hence unusable.
| Quadrant | # 1 sec bins | Bins with >0 counts | Bins with >2000 counts | High rate bins dominated by noise | Noise dominated (total time) | Noise dominated (detector-on time) | Marked lightcurve |
|---|---|---|---|---|---|---|---|
| A | 17209 | 14994 | 261 | 261 | 1.52% | 1.74% | 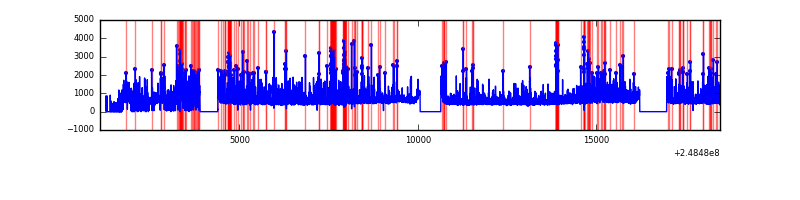 |
| B | 17334 | 15050 | 313 | 313 | 1.81% | 2.08% | 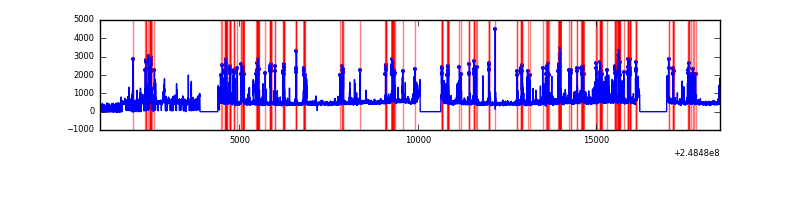 |
| C | 17350 | 15035 | 0 | 0 | 0.00% | 0.00% | 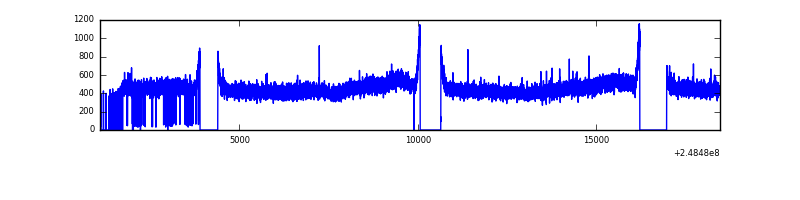 |
| D | 17377 | 15027 | 496 | 496 | 2.85% | 3.30% | 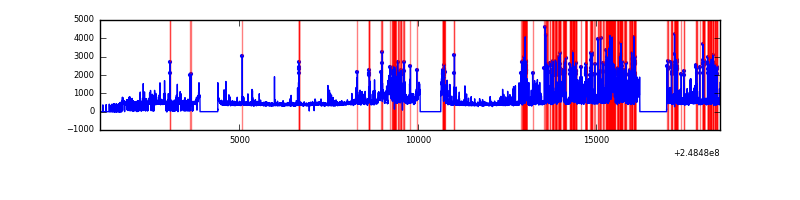 |
Top three noisy pixels from each quadrant. If the there are fewer than three noisy pixels in the level2.evt file, extra rows are filled as -1
| Pixel properties | Quadrant properties | ||||||
|---|---|---|---|---|---|---|---|
| Quadrant | DetID | PixID | Counts | Sigma | Mean | Median | Sigma |
| A | 8 | 5 | 3020644 | 8353.78 | 1768 | 1734 | 361.4 |
| A | 1 | 162 | 268359 | 737.79 | 1768 | 1734 | 361.4 |
| A | 1 | 178 | 164475 | 450.33 | 1768 | 1734 | 361.4 |
| B | 4 | 239 | 2050472 | 6033.22 | 1773 | 1729 | 339.6 |
| B | 15 | 204 | 152450 | 443.85 | 1773 | 1729 | 339.6 |
| B | 0 | 214 | 87740 | 253.29 | 1773 | 1729 | 339.6 |
| C | 13 | 61 | 12710 | 27.28 | 1733 | 1743 | 402.0 |
| C | 3 | 202 | 4381 | 6.56 | 1733 | 1743 | 402.0 |
| C | -1 | -1 | -1 | -1.0 | 1733 | 1743 | 402.0 |
| D | 1 | 52 | 1900852 | 4672.66 | 1695 | 1652 | 406.4 |
| D | 13 | 137 | 925575 | 2273.15 | 1695 | 1652 | 406.4 |
| D | 2 | 120 | 473769 | 1161.56 | 1695 | 1652 | 406.4 |
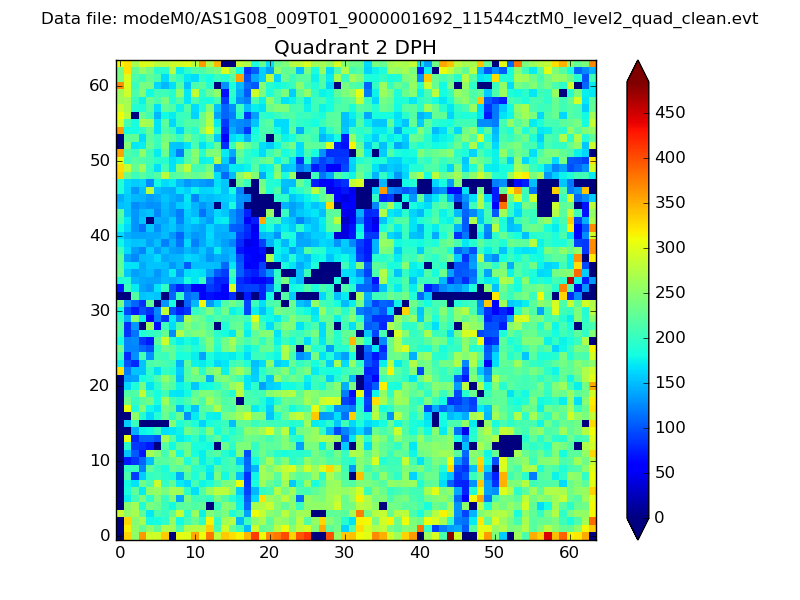
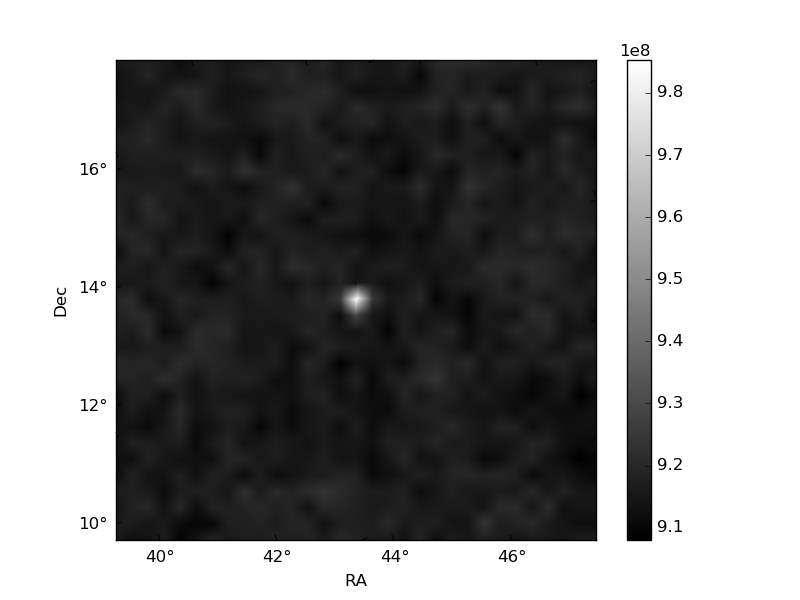
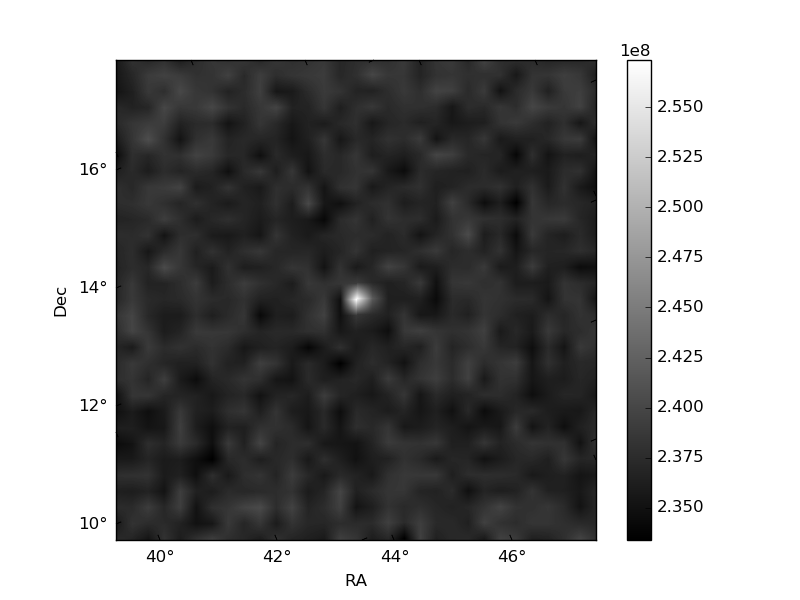
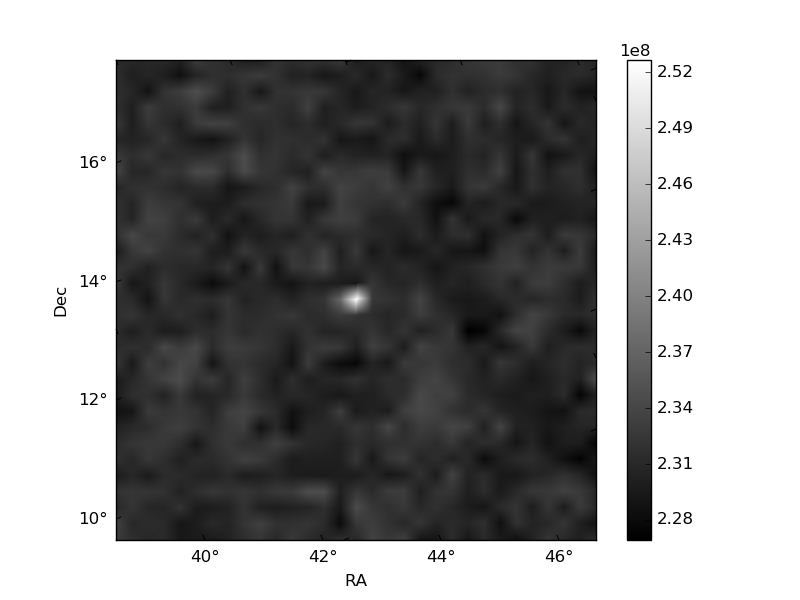
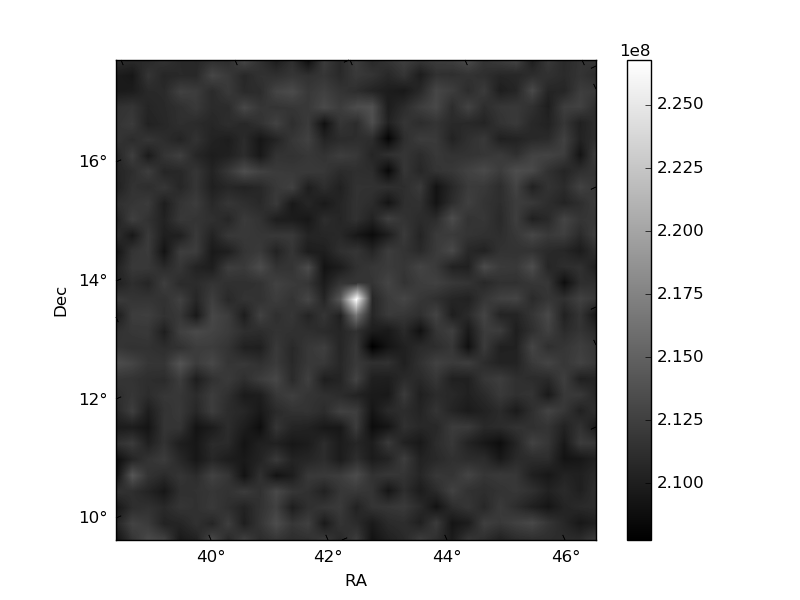
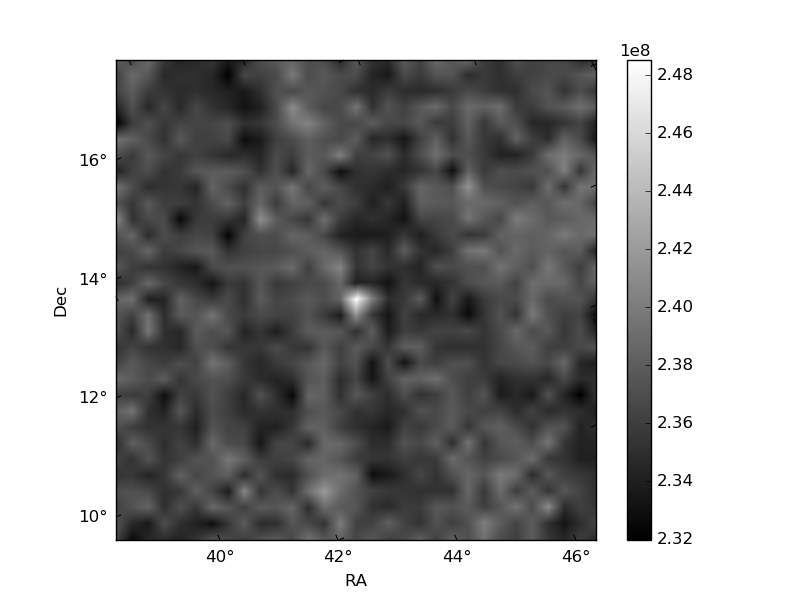
Histogram calculated using DETX and DETY for each event in the final _common_clean file
| Quadrant A | 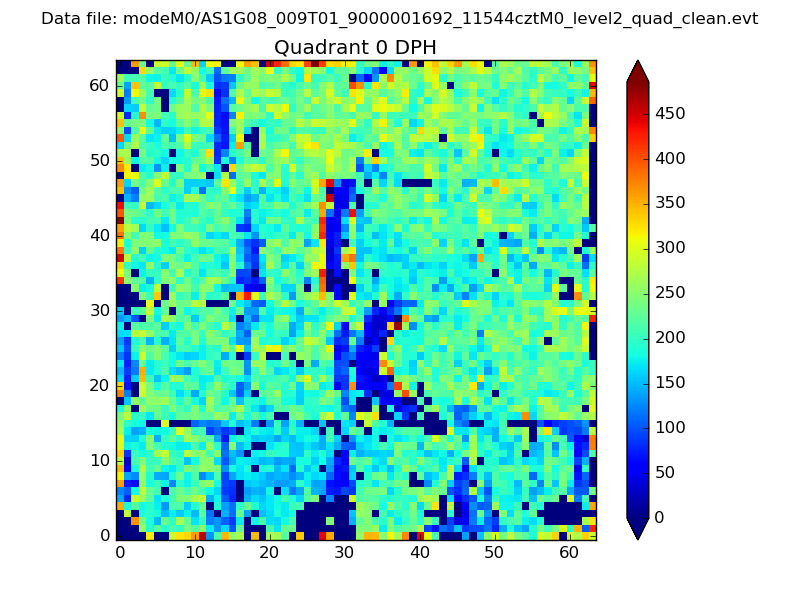 |
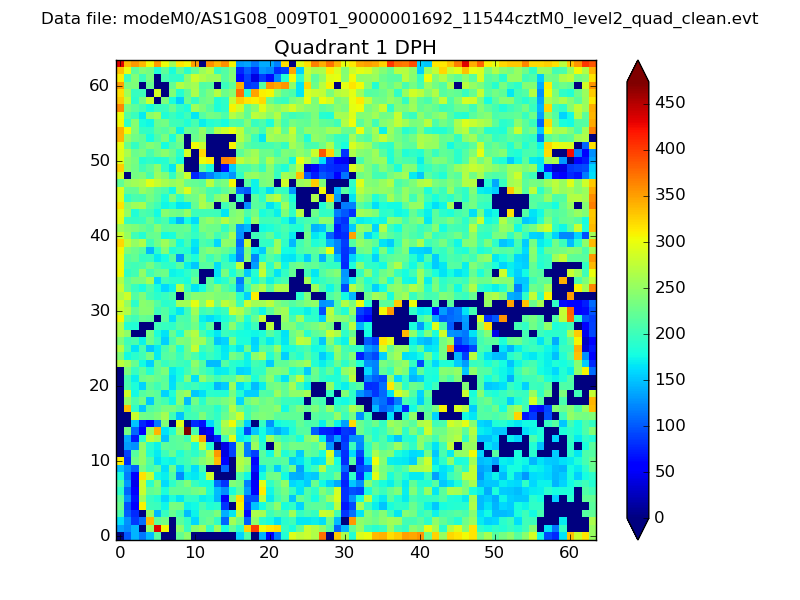 |
Quadrant B |
|---|---|---|---|
| Quadrant D | 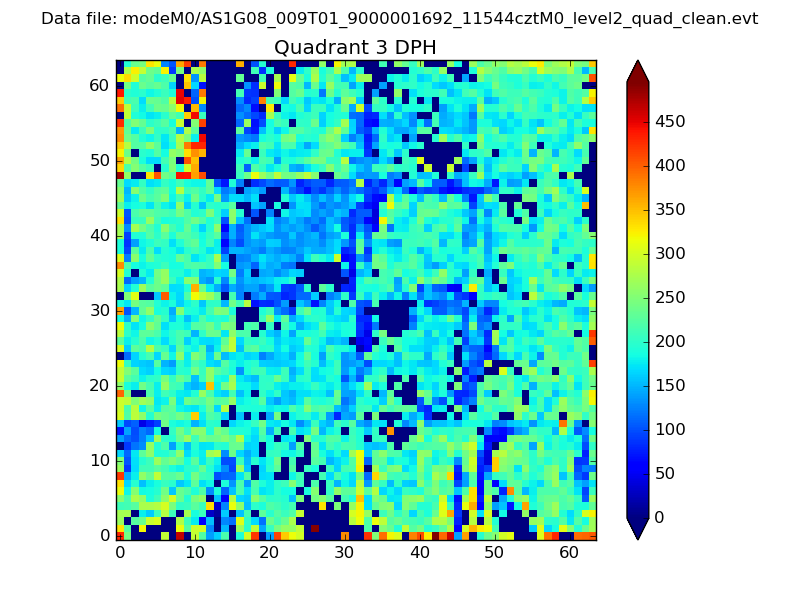 |
 |
Quadrant C |
| Plot type | Count rate plots | Images |
|---|---|---|
| Comparison with Poisson distribution Blue bars denote a histogram of data divided into 1 sec bins. Red curve is a Poisson curve with rate = median count rate of data. |
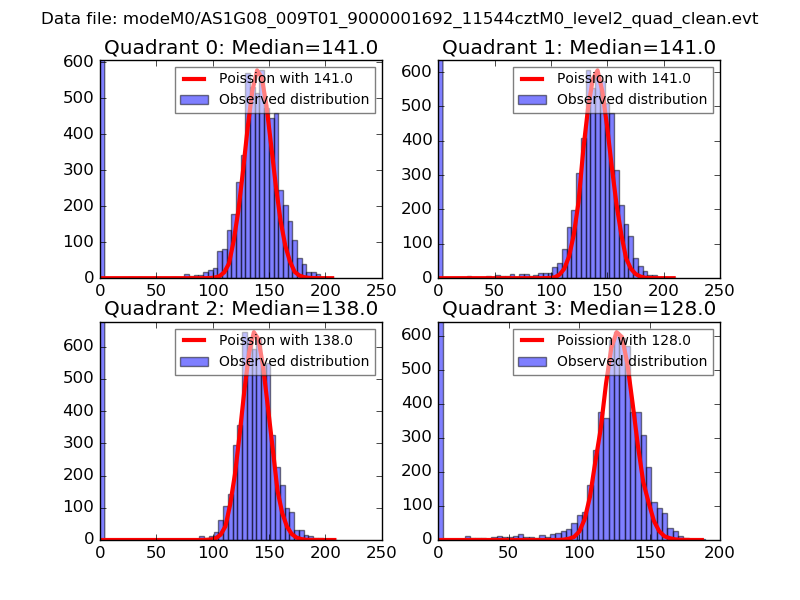 |
 |
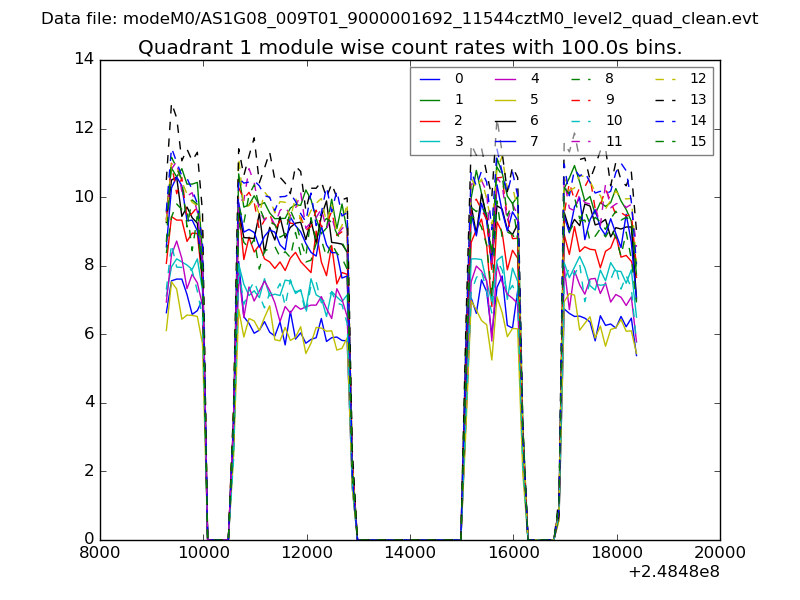
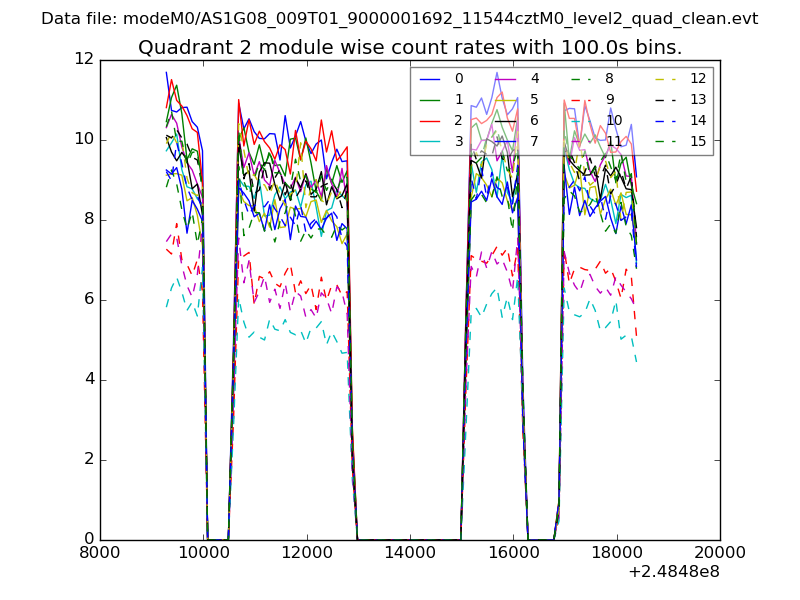
| Quadrant-wise count rates Data is divided into 100 sec bins |
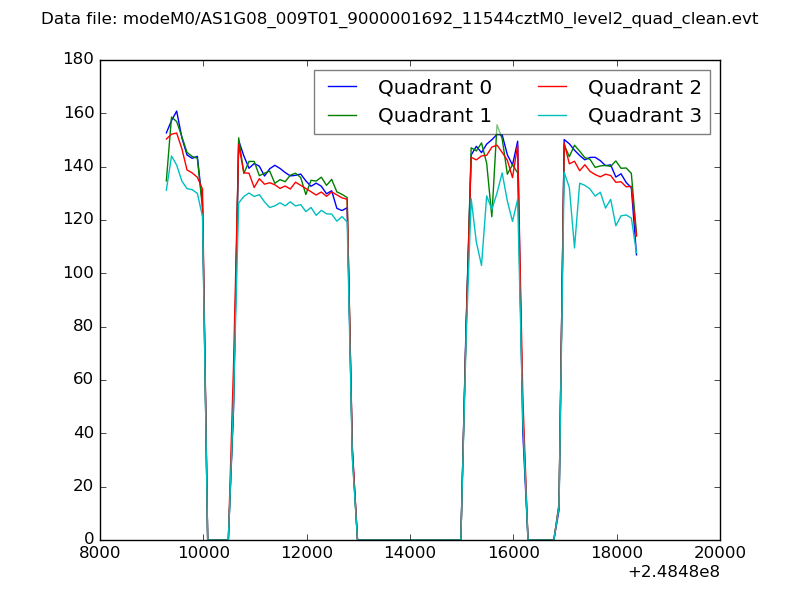 |
|
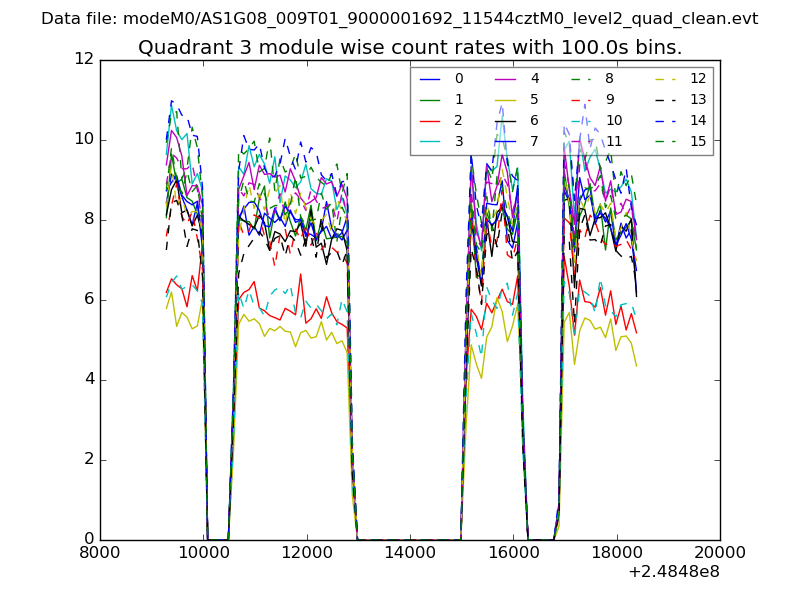
| Module-wise count rates for Quadrant A Data is divided into 100 sec bins |
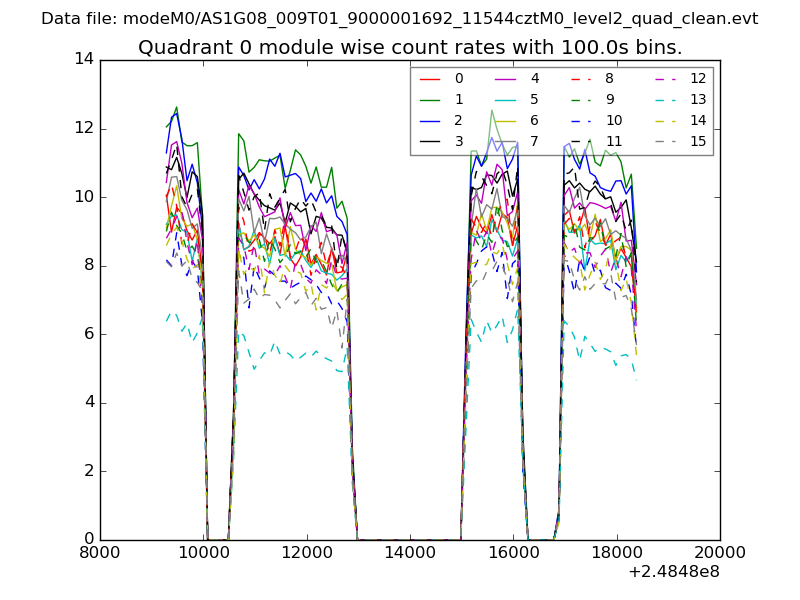 |
 |
| Module-wise count rates for Quadrant B Data is divided into 100 sec bins |
 |
 |
| Module-wise count rates for Quadrant C Data is divided into 100 sec bins |
 |
 |
| Module-wise count rates for Quadrant D Data is divided into 100 sec bins |
 |
 |
| Parameter | Plot |
|---|---|
| CZT HV Monitor | 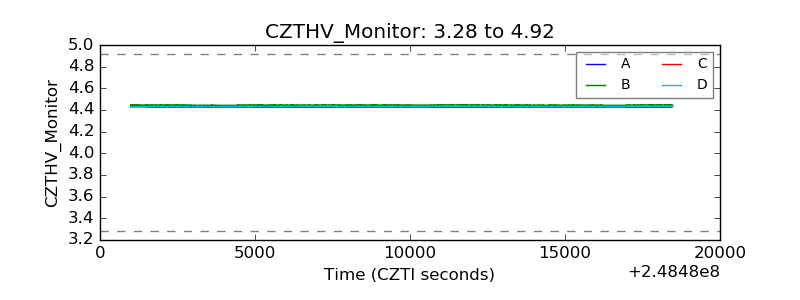 |
| D_VDD | 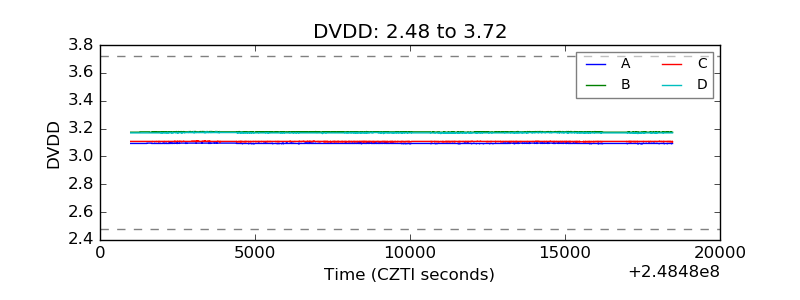 |
| Temperature 1 | 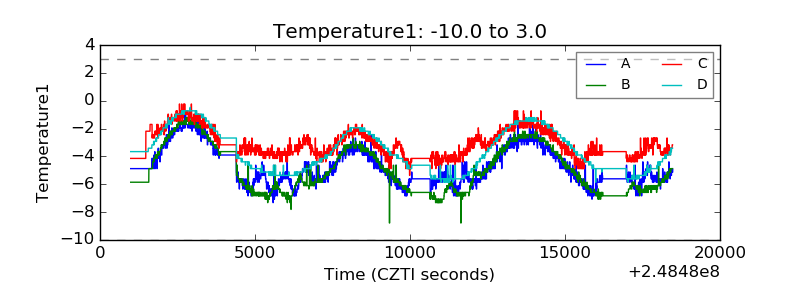 |
| Veto HV Monitor | 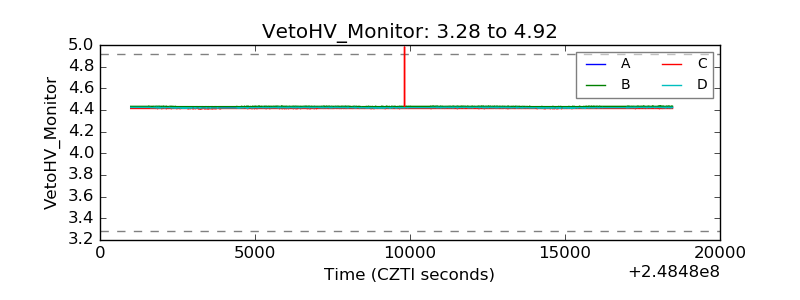 |
| Veto LLD | 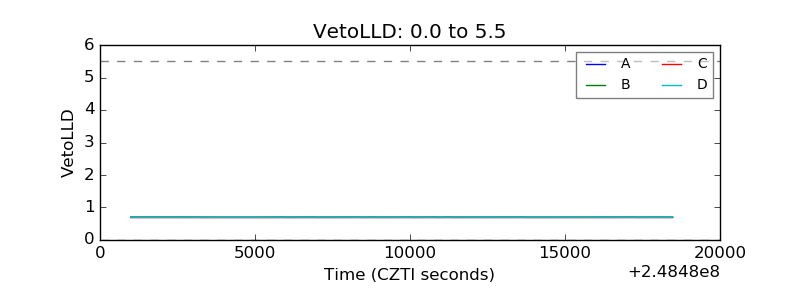 |
| Alpha Counter | 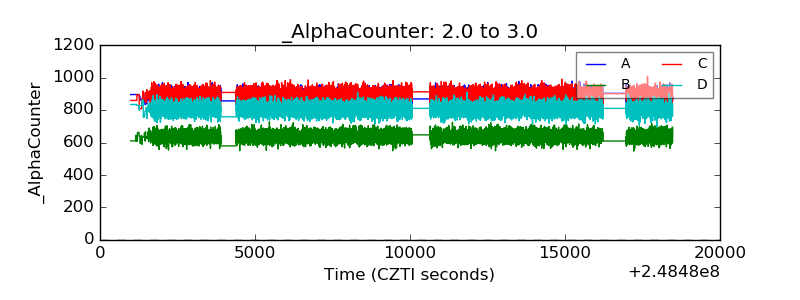 |
| _CPM_Rate |  |
| CZT Counter | 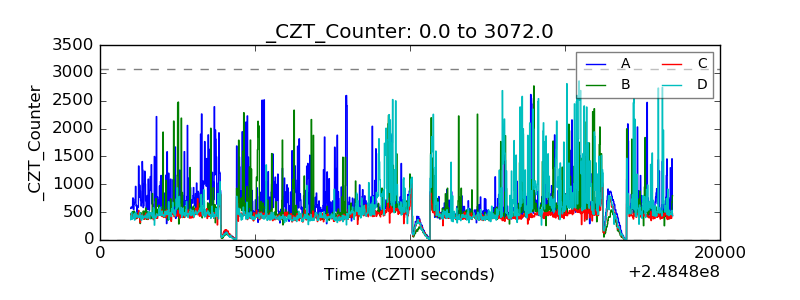 |
| +2.5 Volts monitor |  |
| +5 Volts monitor |  |
| _ROLL_ROT | 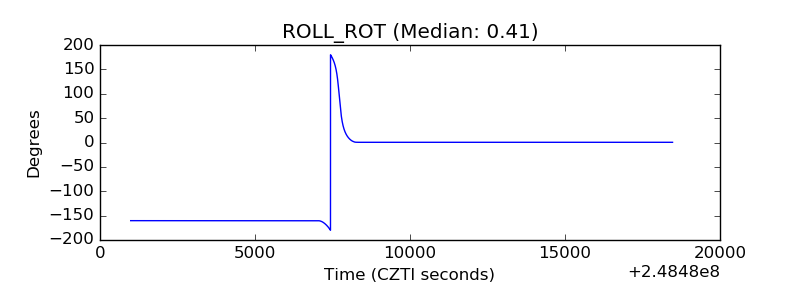 |
| _Roll_DEC | 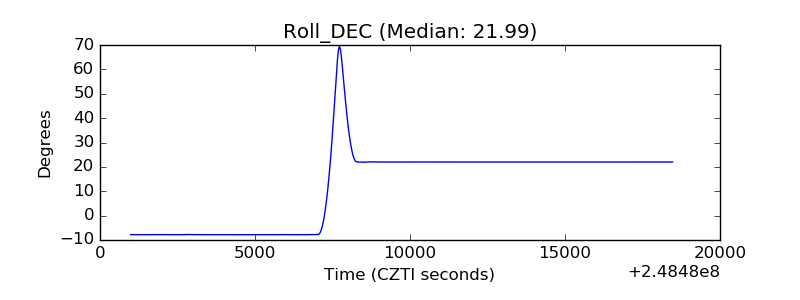 |
| _Roll_RA | 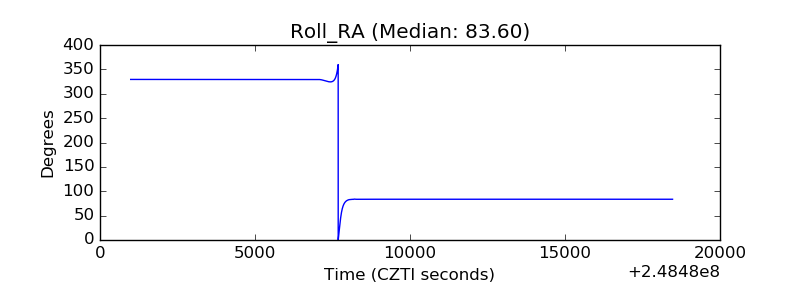 |
| Veto Counter | 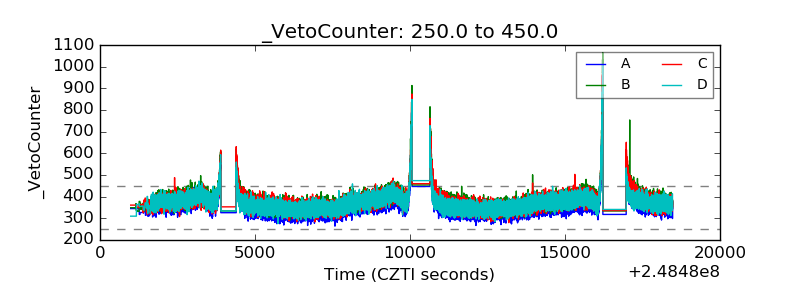 |