| Param | Original file | Final file |
|---|---|---|
| Filename | modeM0/AS1G08_009T01_9000001692_11545cztM0_level2.evt | modeM0/AS1G08_009T01_9000001692_11545cztM0_level2_quad_clean.evt |
| Size (bytes) | 1,957,484,160 | 207,578,880 |
| Size | 1.8 GB | 198.0 MB |
| Events in quadrant A | 16,819,644 | 1,222,078 |
| Events in quadrant B | 14,260,169 | 1,230,776 |
| Events in quadrant C | 10,102,056 | 1,211,438 |
| Events in quadrant D | 16,591,147 | 1,078,722 |
| Mode M0 | |||
|---|---|---|---|
| Quadrant | BADHDUFLAG | Total packets | Discarded packets |
| A | 0 | 65277 | 5 |
| B | 0 | 56882 | 4 |
| C | 0 | 45462 | 4 |
| D | 0 | 65122 | 4 |
| Mode M9 | |||
|---|---|---|---|
| Quadrant | BADHDUFLAG | Total packets | Discarded packets |
| A | 0 | 27 | 0 |
| B | 0 | 27 | 0 |
| C | 0 | 27 | 0 |
| D | 0 | 27 | 0 |
| Mode SS | |||
|---|---|---|---|
| Quadrant | BADHDUFLAG | Total packets | Discarded packets |
| A | 0 | 456 | 0 |
| B | 0 | 456 | 0 |
| C | 0 | 456 | 0 |
| D | 0 | 456 | 0 |
| Quadrant | Total seconds | Saturated seconds | Saturation percentage |
|---|---|---|---|
| A | 22406 | 1150 | 5.132554% |
| B | 22406 | 1067 | 4.762117% |
| C | 22406 | 111 | 0.495403% |
| D | 22406 | 1884 | 8.408462% |
Noise dominated data is calculated using 1-second bins in cleaned event files. If a bin has >2000 counts, and if more than 50% of those come from <1% of pixels, then it is considered to be noise-dominated and hence unusable.
| Quadrant | # 1 sec bins | Bins with >0 counts | Bins with >2000 counts | High rate bins dominated by noise | Noise dominated (total time) | Noise dominated (detector-on time) | Marked lightcurve |
|---|---|---|---|---|---|---|---|
| A | 25162 | 22411 | 550 | 550 | 2.19% | 2.45% | 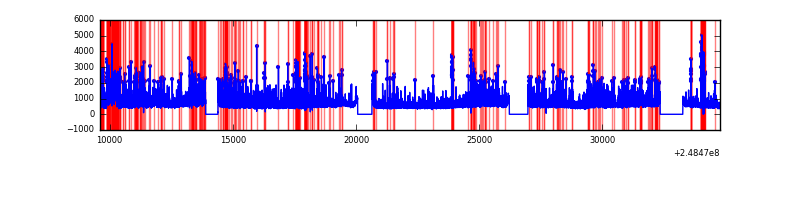 |
| B | 25162 | 22411 | 572 | 572 | 2.27% | 2.55% | 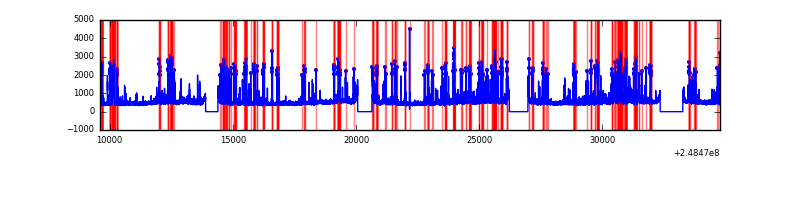 |
| C | 25162 | 22411 | 0 | 0 | 0.00% | 0.00% | 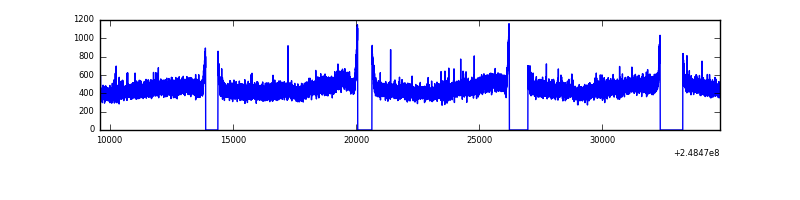 |
| D | 25162 | 22411 | 1386 | 1386 | 5.51% | 6.18% | 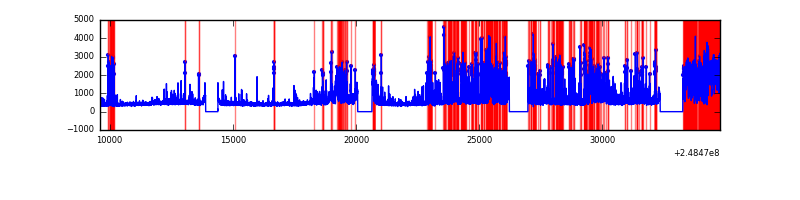 |
Top three noisy pixels from each quadrant. If the there are fewer than three noisy pixels in the level2.evt file, extra rows are filled as -1
| Pixel properties | Quadrant properties | ||||||
|---|---|---|---|---|---|---|---|
| Quadrant | DetID | PixID | Counts | Sigma | Mean | Median | Sigma |
| A | 8 | 5 | 5372379 | 9991.8 | 2644 | 2595 | 537.4 |
| A | 1 | 162 | 439871 | 813.66 | 2644 | 2595 | 537.4 |
| A | 1 | 178 | 262708 | 484.0 | 2644 | 2595 | 537.4 |
| B | 4 | 239 | 3346956 | 6622.67 | 2651 | 2589 | 505.0 |
| B | 15 | 204 | 241608 | 473.32 | 2651 | 2589 | 505.0 |
| B | 3 | 64 | 114549 | 221.71 | 2651 | 2589 | 505.0 |
| C | 13 | 61 | 18886 | 27.18 | 2592 | 2608 | 598.9 |
| C | 3 | 202 | 6499 | 6.5 | 2592 | 2608 | 598.9 |
| C | -1 | -1 | -1 | -1.0 | 2592 | 2608 | 598.9 |
| D | 13 | 137 | 3387106 | 5684.86 | 2500 | 2434 | 595.4 |
| D | 1 | 52 | 2763591 | 4637.61 | 2500 | 2434 | 595.4 |
| D | 2 | 120 | 672918 | 1126.14 | 2500 | 2434 | 595.4 |
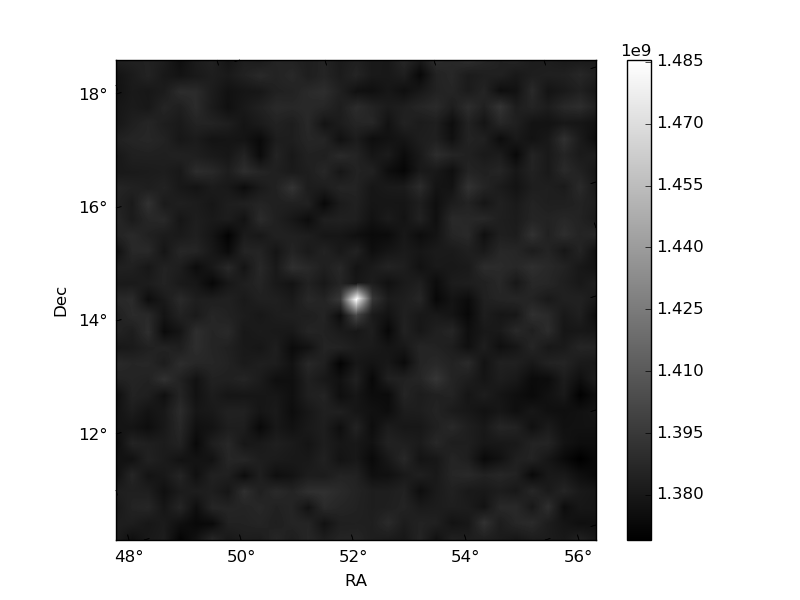
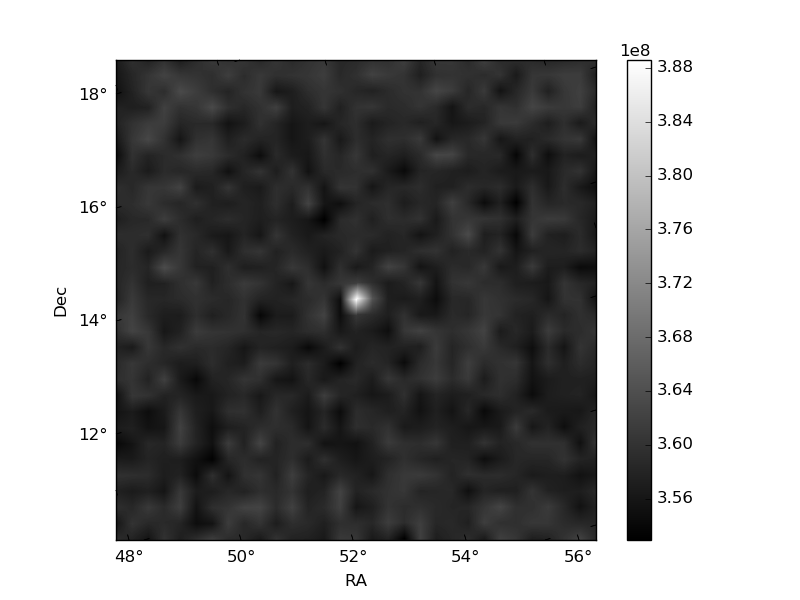
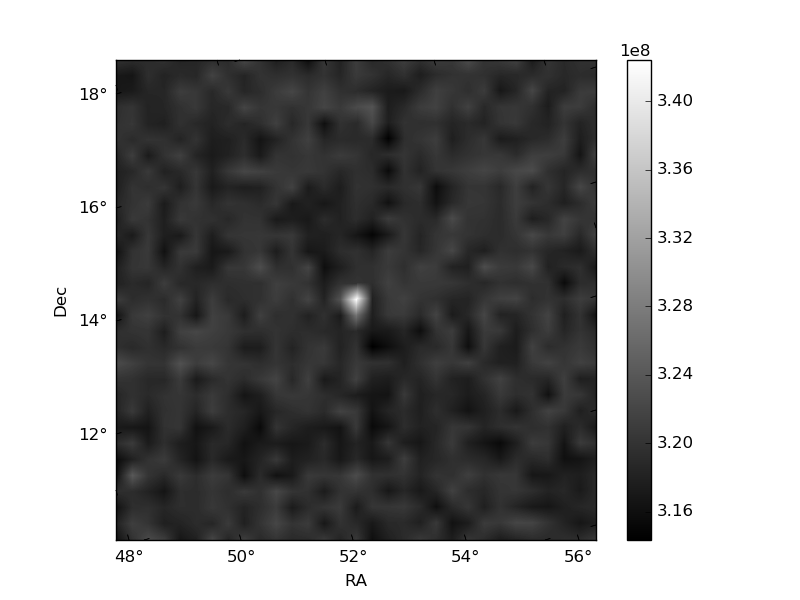
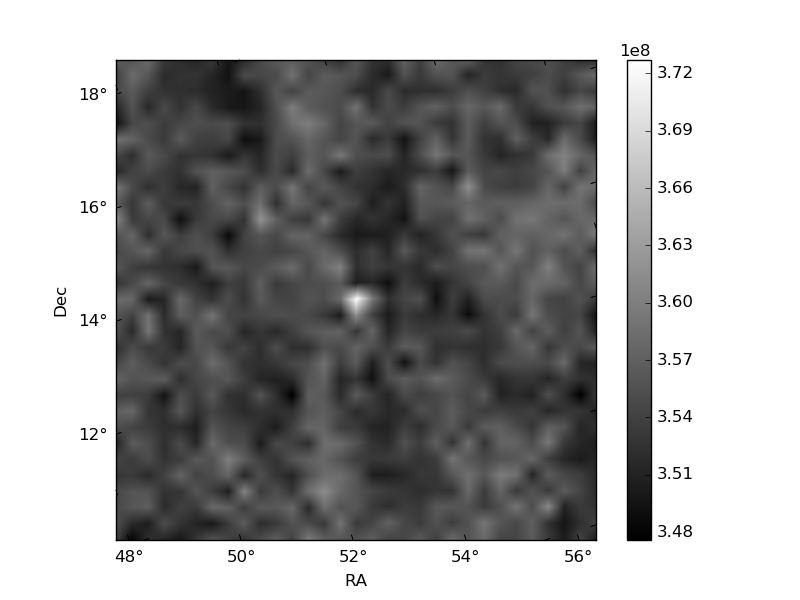
Histogram calculated using DETX and DETY for each event in the final _common_clean file
| Quadrant A | 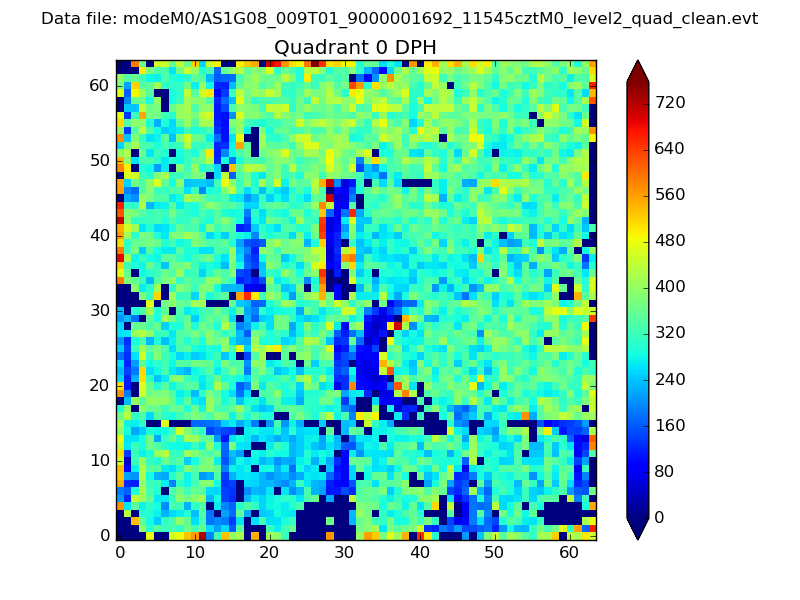 |
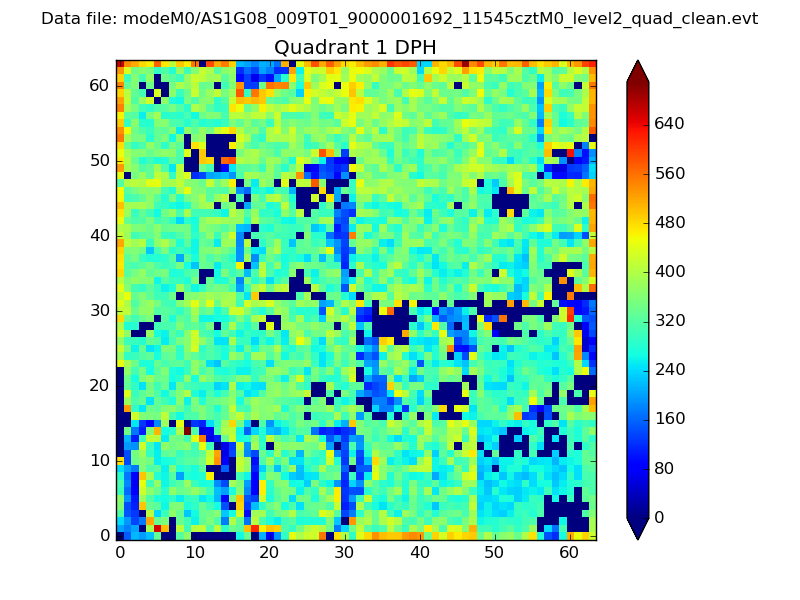 |
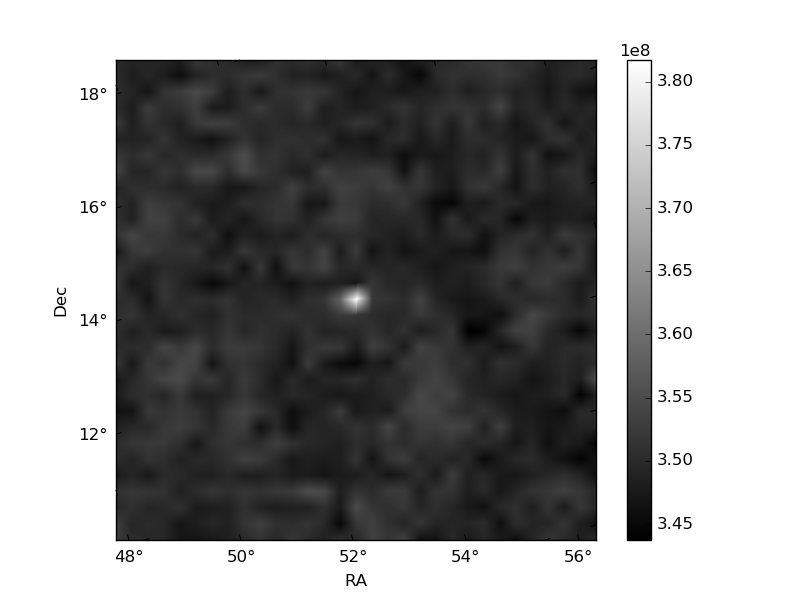
Quadrant B |
|---|---|---|---|
| Quadrant D | 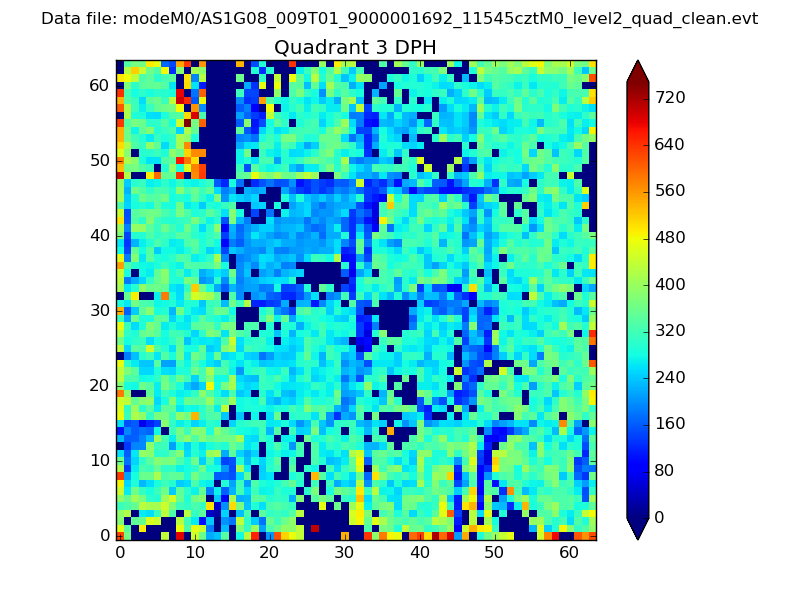 |
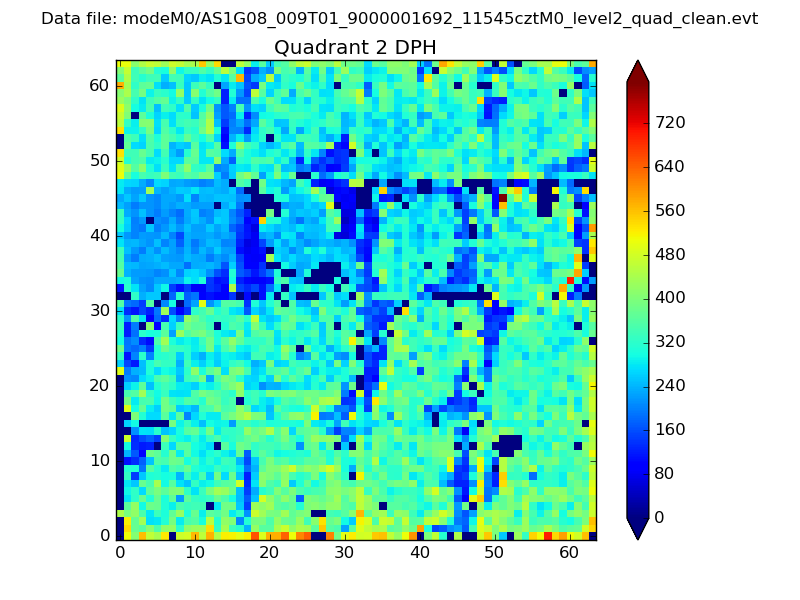 |
Quadrant C |
| Plot type | Count rate plots | Images |
|---|---|---|
| Comparison with Poisson distribution Blue bars denote a histogram of data divided into 1 sec bins. Red curve is a Poisson curve with rate = median count rate of data. |
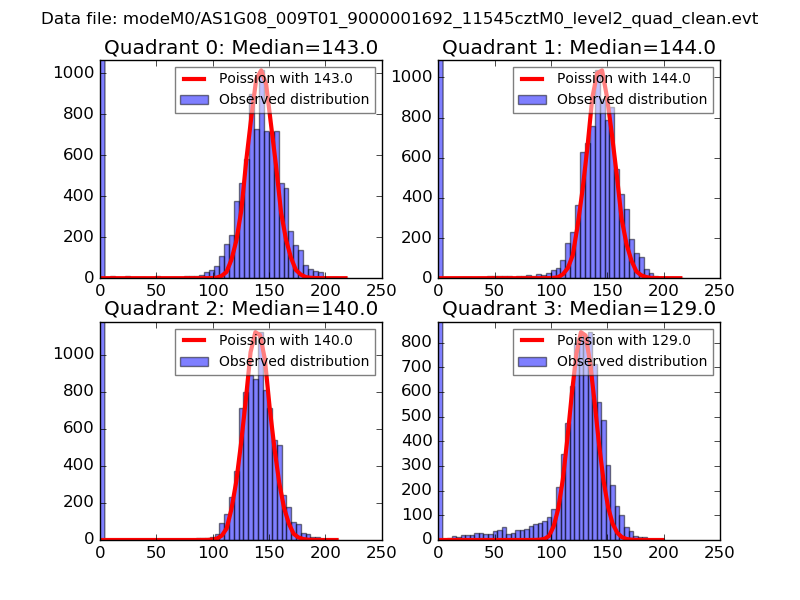 |
 |
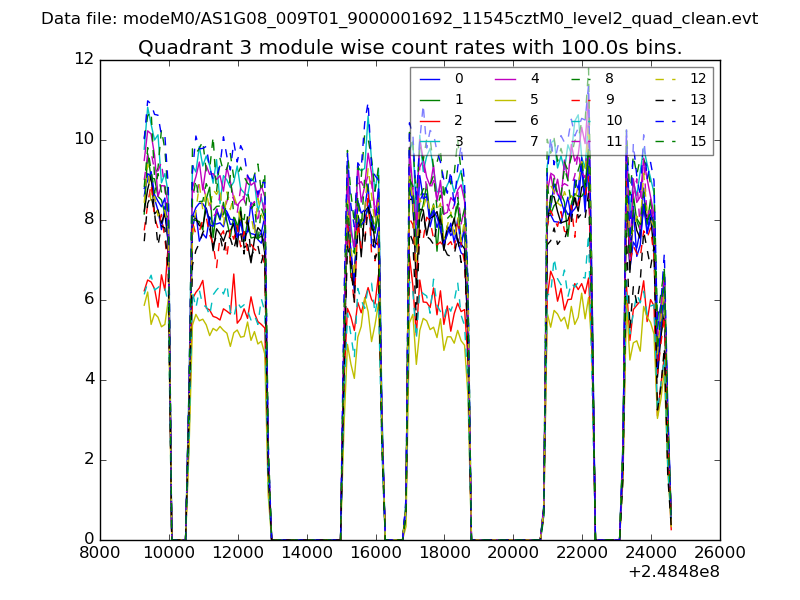
| Quadrant-wise count rates Data is divided into 100 sec bins |
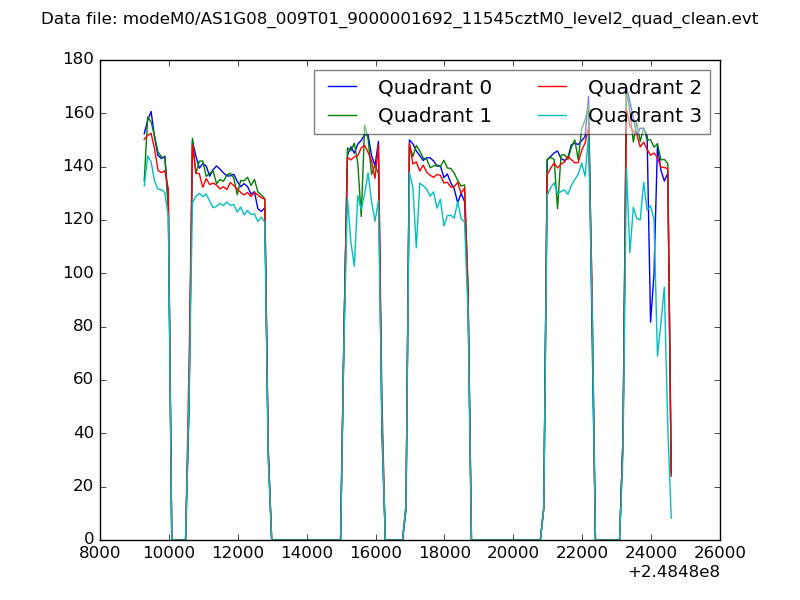 |
|
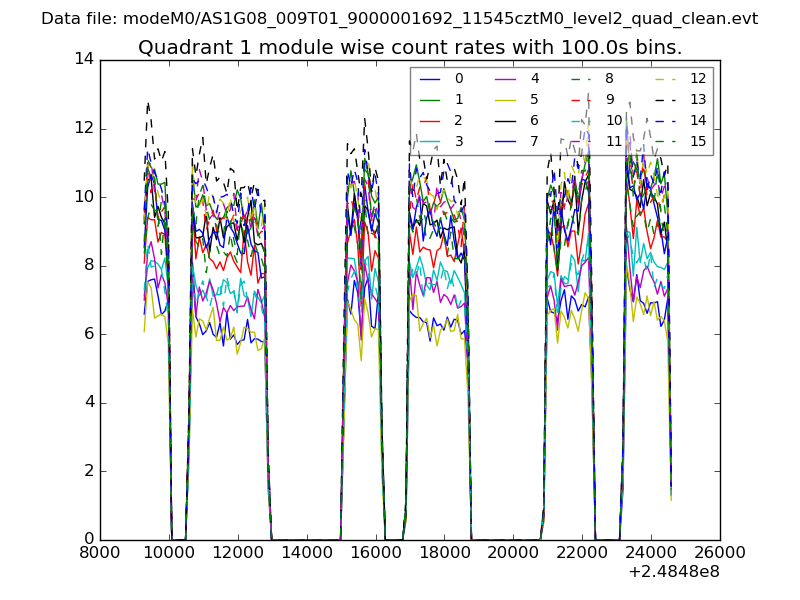
| Module-wise count rates for Quadrant A Data is divided into 100 sec bins |
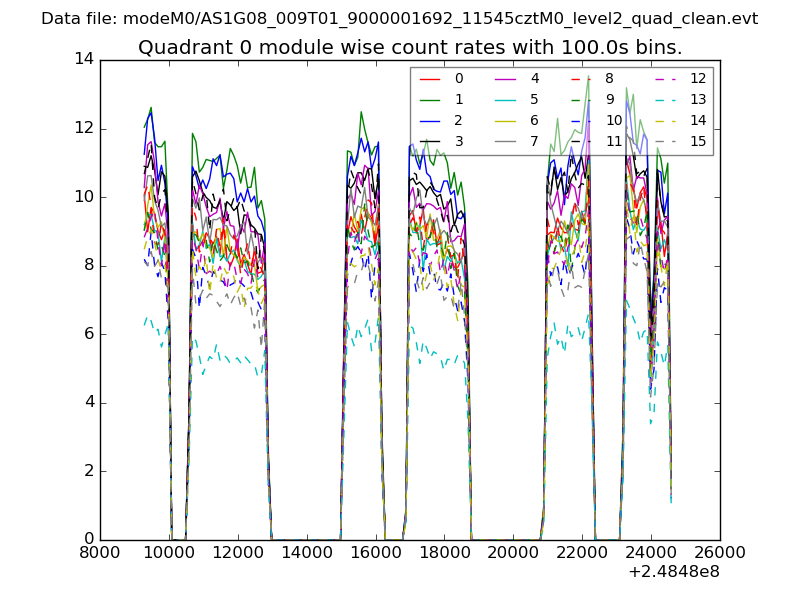 |
 |
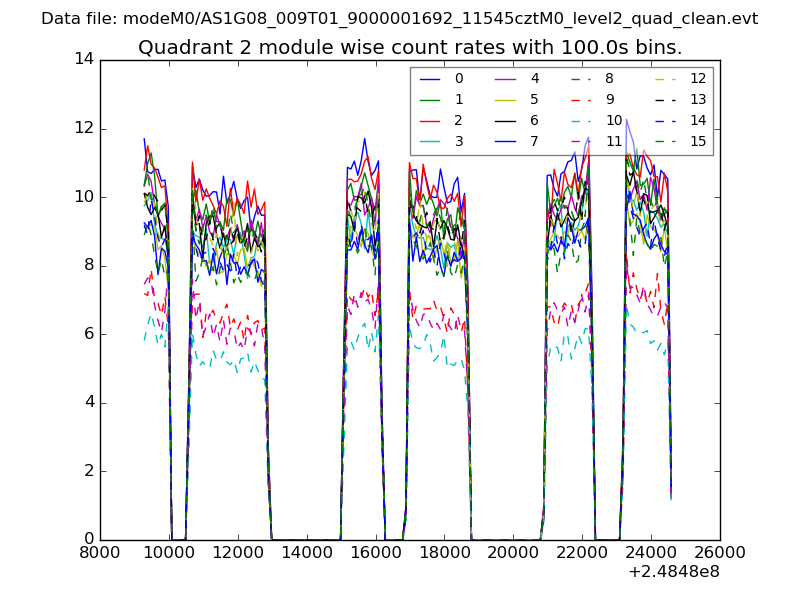
| Module-wise count rates for Quadrant B Data is divided into 100 sec bins |
 |
 |
| Module-wise count rates for Quadrant C Data is divided into 100 sec bins |
 |
 |
| Module-wise count rates for Quadrant D Data is divided into 100 sec bins |
 |
 |
| Parameter | Plot |
|---|---|
| CZT HV Monitor | 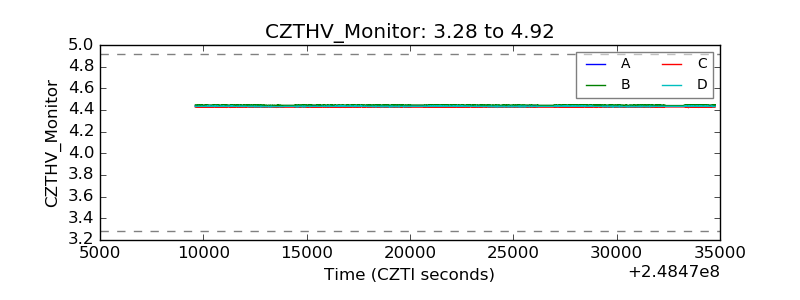 |
| D_VDD | 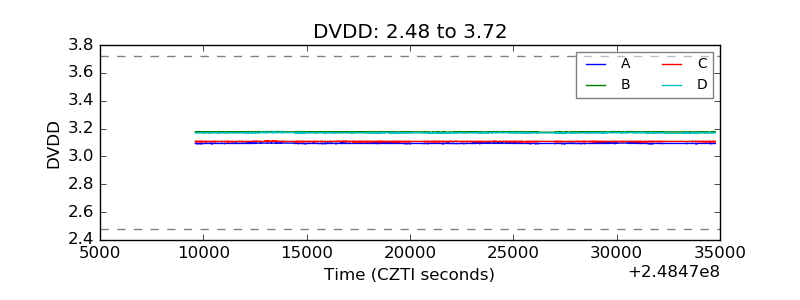 |
| Temperature 1 | 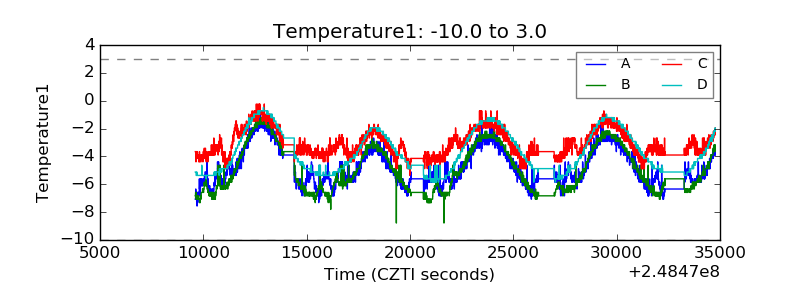 |
| Veto HV Monitor | 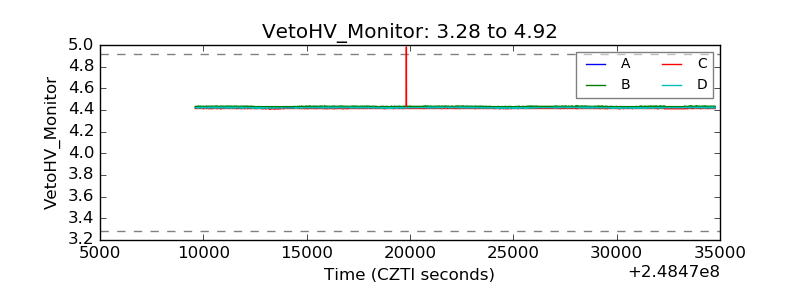 |
| Veto LLD | 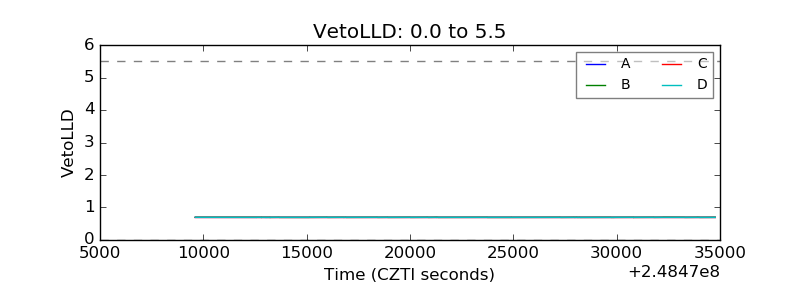 |
| Alpha Counter | 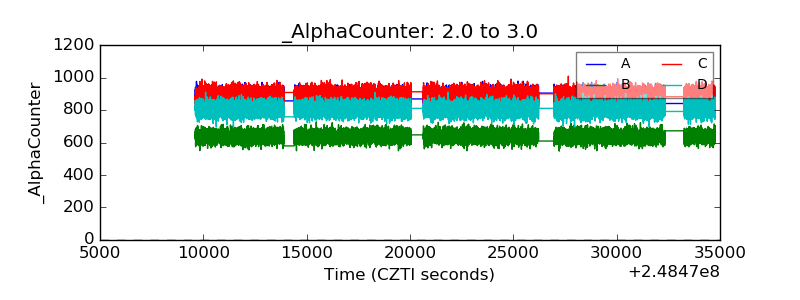 |
| _CPM_Rate | 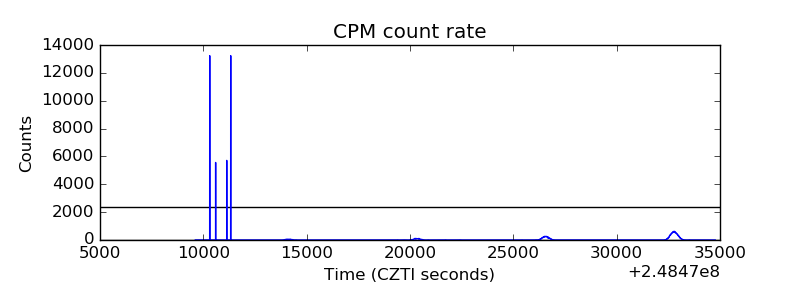 |
| CZT Counter | 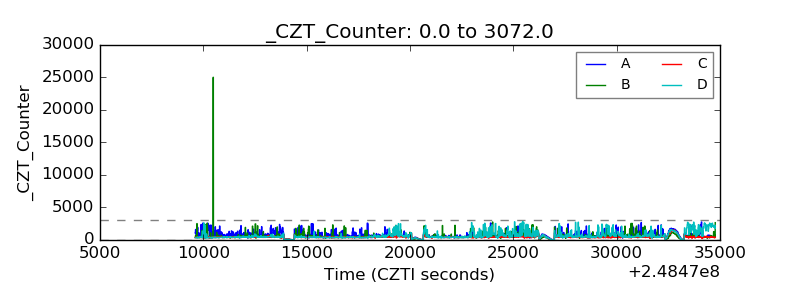 |
| +2.5 Volts monitor |  |
| +5 Volts monitor |  |
| _ROLL_ROT | 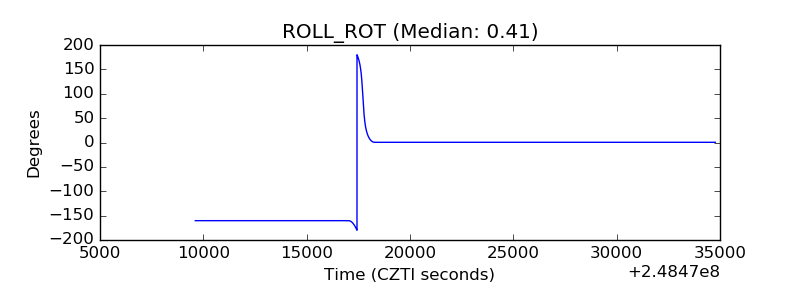 |
| _Roll_DEC | 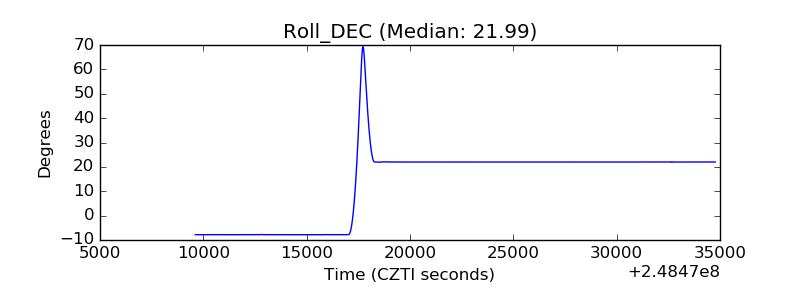 |
| _Roll_RA | 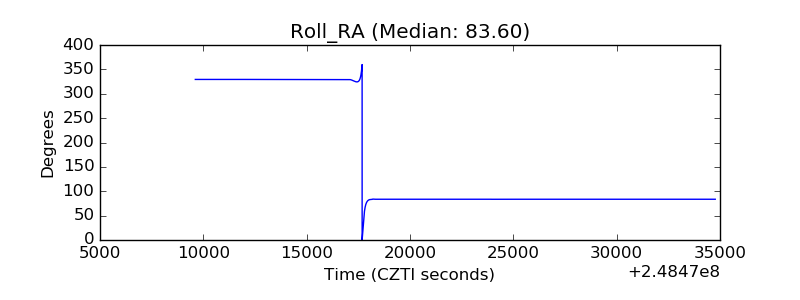 |
| Veto Counter | 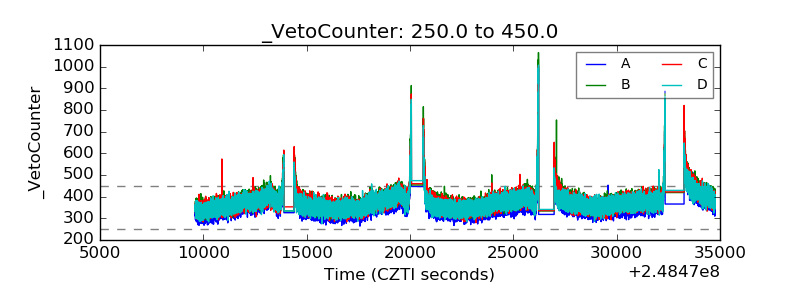 |