| Param | Original file | Final file |
|---|---|---|
| Filename | modeM0/AS1G08_009T01_9000001692_11551cztM0_level2.evt | modeM0/AS1G08_009T01_9000001692_11551cztM0_level2_quad_clean.evt |
| Size (bytes) | 595,244,160 | 46,811,520 |
| Size | 567.7 MB | 44.6 MB |
| Events in quadrant A | 4,787,092 | 242,077 |
| Events in quadrant B | 4,218,431 | 250,576 |
| Events in quadrant C | 3,139,089 | 249,148 |
| Events in quadrant D | 5,454,664 | 233,958 |
| Mode M0 | |||
|---|---|---|---|
| Quadrant | BADHDUFLAG | Total packets | Discarded packets |
| A | 0 | 18625 | 3 |
| B | 0 | 16657 | 2 |
| C | 0 | 13235 | 2 |
| D | 0 | 20385 | 2 |
| Mode M9 | |||
|---|---|---|---|
| Quadrant | BADHDUFLAG | Total packets | Discarded packets |
| A | 0 | 15 | 0 |
| B | 0 | 15 | 0 |
| C | 0 | 15 | 0 |
| D | 0 | 16 | 0 |
| Mode SS | |||
|---|---|---|---|
| Quadrant | BADHDUFLAG | Total packets | Discarded packets |
| A | 0 | 128 | 0 |
| B | 0 | 128 | 0 |
| C | 0 | 128 | 0 |
| D | 0 | 128 | 0 |
| Quadrant | Total seconds | Saturated seconds | Saturation percentage |
|---|---|---|---|
| A | 6322 | 338 | 5.346409% |
| B | 6322 | 287 | 4.539703% |
| C | 6322 | 46 | 0.727618% |
| D | 6322 | 526 | 8.320152% |
Noise dominated data is calculated using 1-second bins in cleaned event files. If a bin has >2000 counts, and if more than 50% of those come from <1% of pixels, then it is considered to be noise-dominated and hence unusable.
| Quadrant | # 1 sec bins | Bins with >0 counts | Bins with >2000 counts | High rate bins dominated by noise | Noise dominated (total time) | Noise dominated (detector-on time) | Marked lightcurve |
|---|---|---|---|---|---|---|---|
| A | 7558 | 6324 | 95 | 95 | 1.26% | 1.50% | 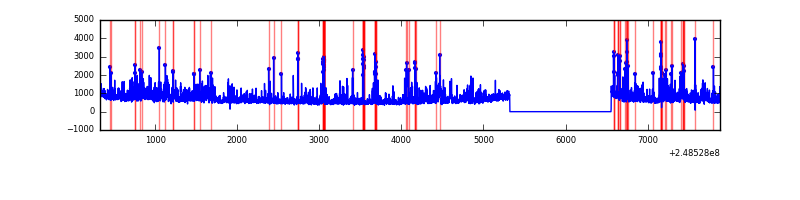 |
| B | 7558 | 6324 | 105 | 105 | 1.39% | 1.66% | 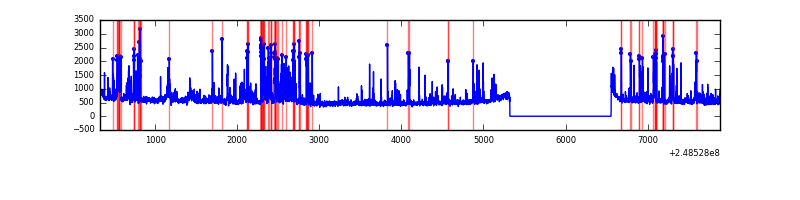 |
| C | 7558 | 6324 | 0 | 0 | 0.00% | 0.00% | 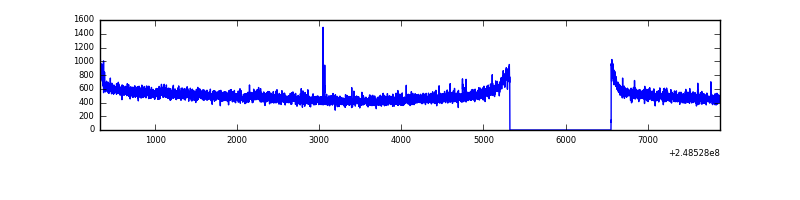 |
| D | 7558 | 6324 | 407 | 407 | 5.39% | 6.44% | 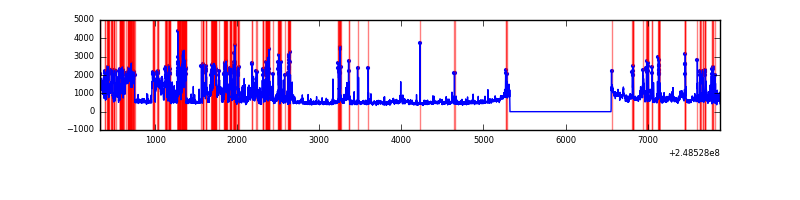 |
Top three noisy pixels from each quadrant. If the there are fewer than three noisy pixels in the level2.evt file, extra rows are filled as -1
| Pixel properties | Quadrant properties | ||||||
|---|---|---|---|---|---|---|---|
| Quadrant | DetID | PixID | Counts | Sigma | Mean | Median | Sigma |
| A | 8 | 5 | 1270743 | 7810.29 | 816 | 801 | 162.6 |
| A | 1 | 162 | 118605 | 724.51 | 816 | 801 | 162.6 |
| A | 1 | 178 | 70051 | 425.9 | 816 | 801 | 162.6 |
| B | 4 | 239 | 764862 | 4959.17 | 815 | 796 | 154.1 |
| B | 11 | 51 | 126152 | 813.62 | 815 | 796 | 154.1 |
| B | 15 | 204 | 69474 | 445.75 | 815 | 796 | 154.1 |
| C | 13 | 61 | 5963 | 27.77 | 803 | 807 | 185.7 |
| C | 14 | 128 | 4587 | 20.36 | 803 | 807 | 185.7 |
| C | 12 | 4 | 3729 | 15.74 | 803 | 807 | 185.7 |
| D | 1 | 52 | 1848518 | 9824.12 | 784 | 764 | 188.1 |
| D | 2 | 120 | 494588 | 2625.56 | 784 | 764 | 188.1 |
| D | 13 | 137 | 44249 | 231.2 | 784 | 764 | 188.1 |
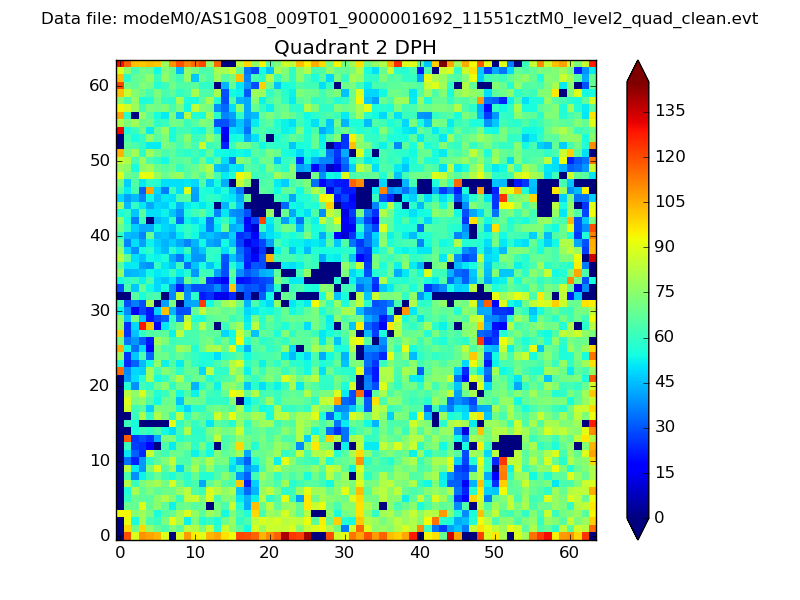
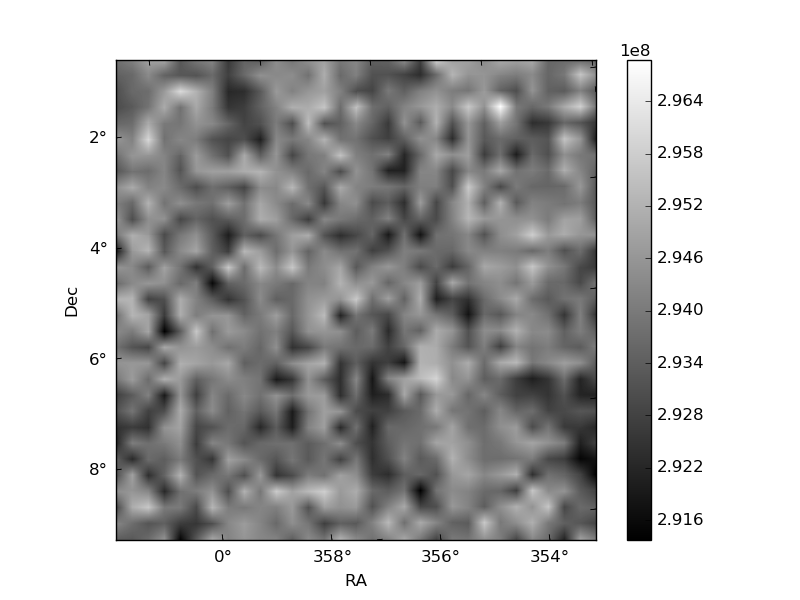
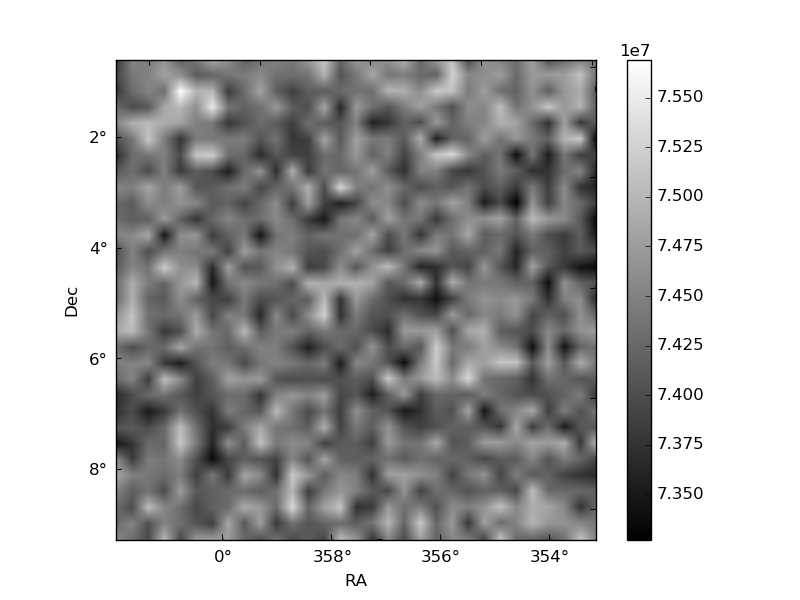
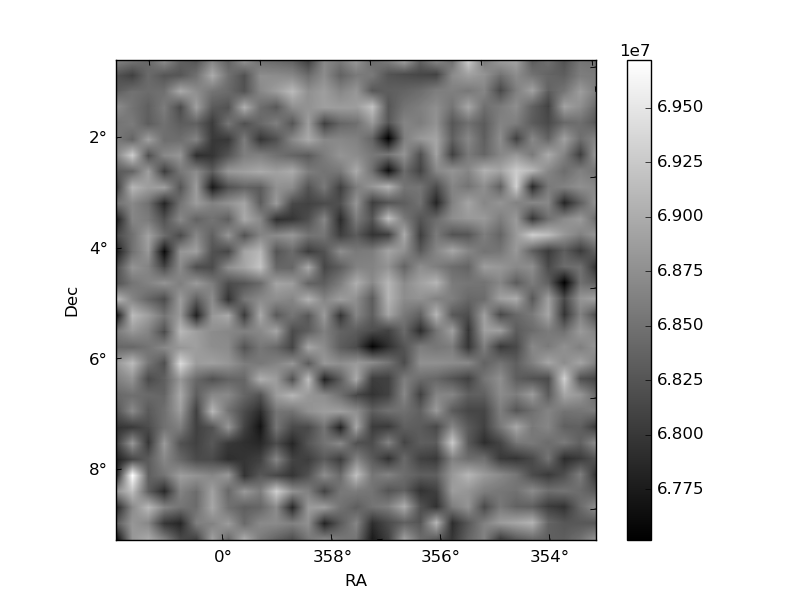
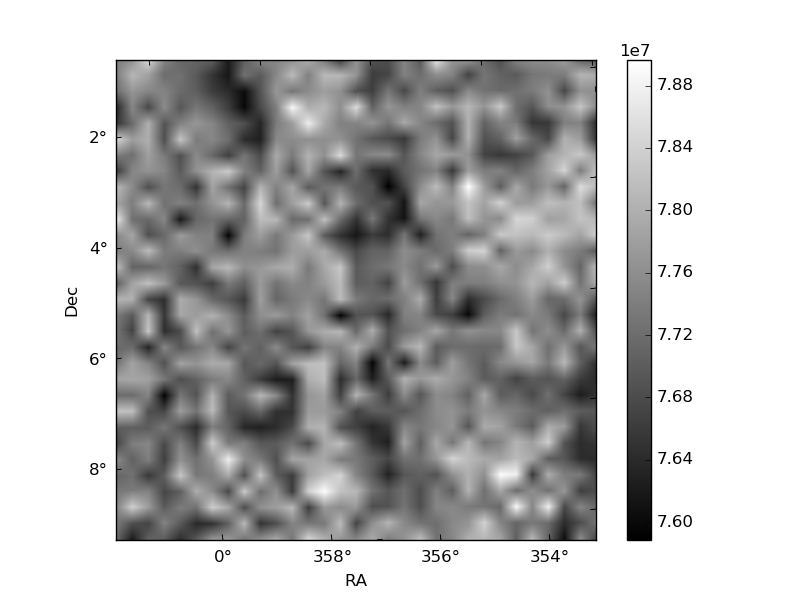
Histogram calculated using DETX and DETY for each event in the final _common_clean file
| Quadrant A | 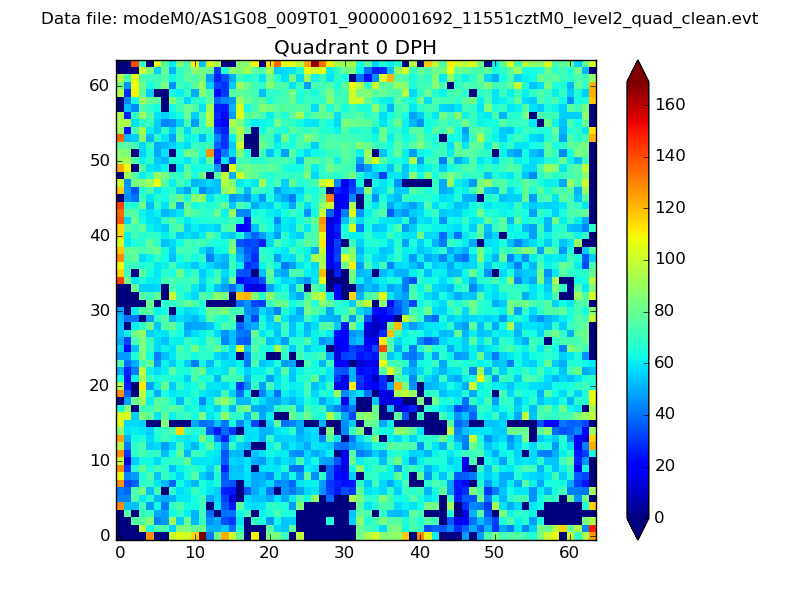 |
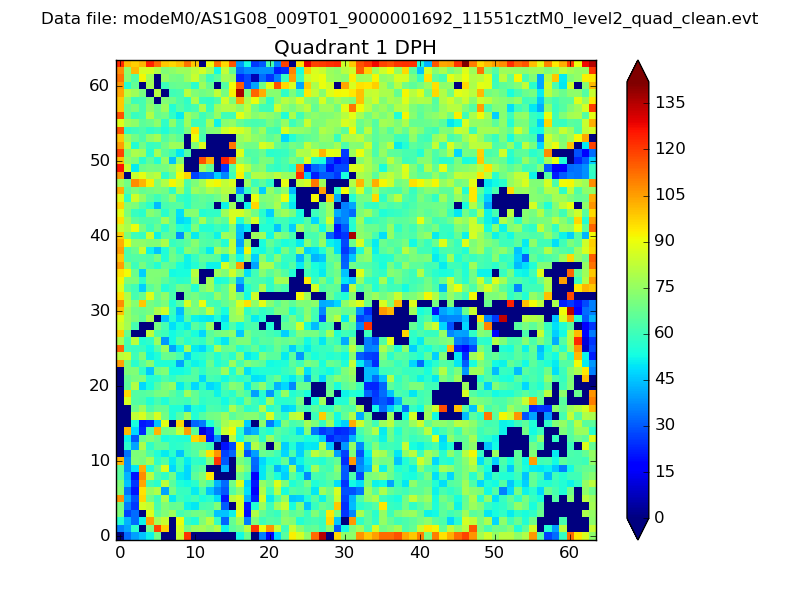 |
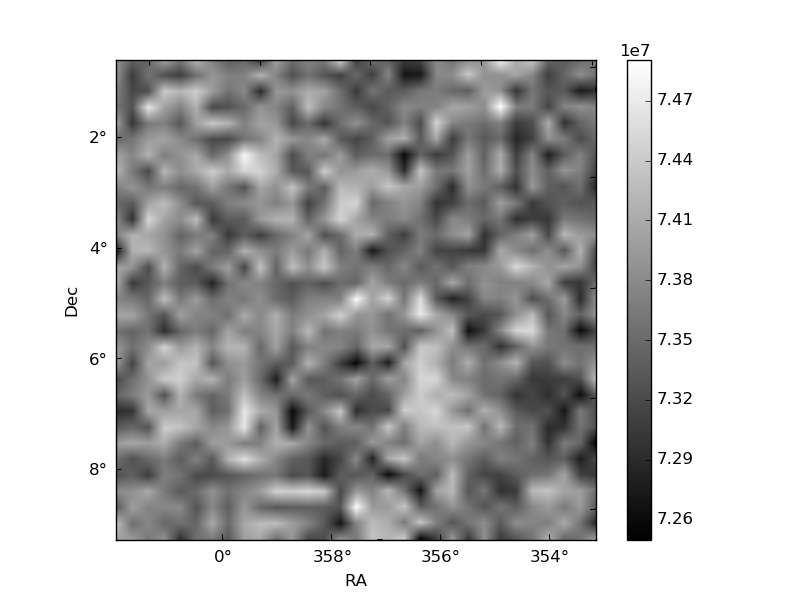
Quadrant B |
|---|---|---|---|
| Quadrant D | 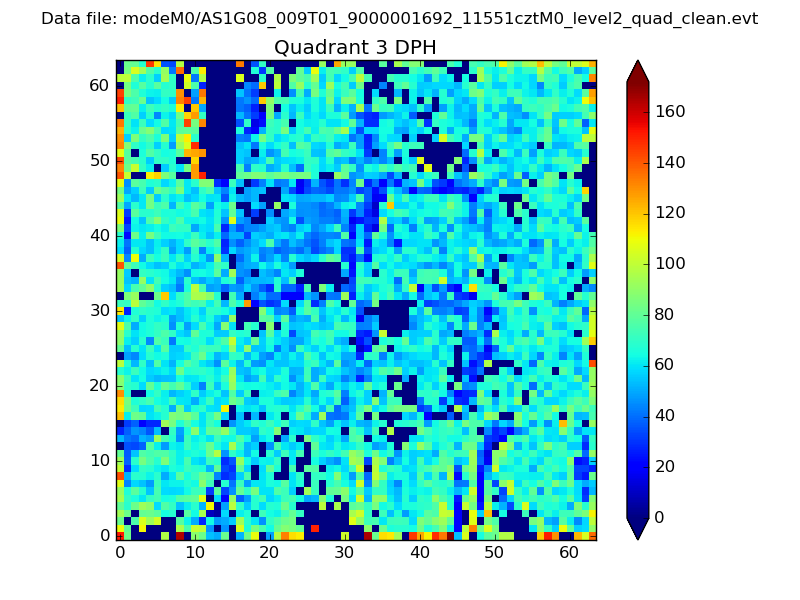 |
 |
Quadrant C |
| Plot type | Count rate plots | Images |
|---|---|---|
| Comparison with Poisson distribution Blue bars denote a histogram of data divided into 1 sec bins. Red curve is a Poisson curve with rate = median count rate of data. |
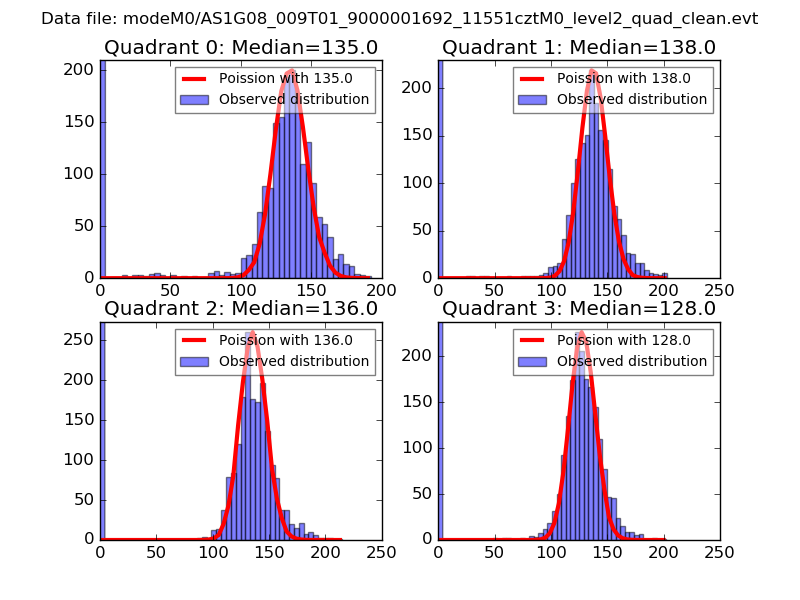 |
 |
| Quadrant-wise count rates Data is divided into 100 sec bins |
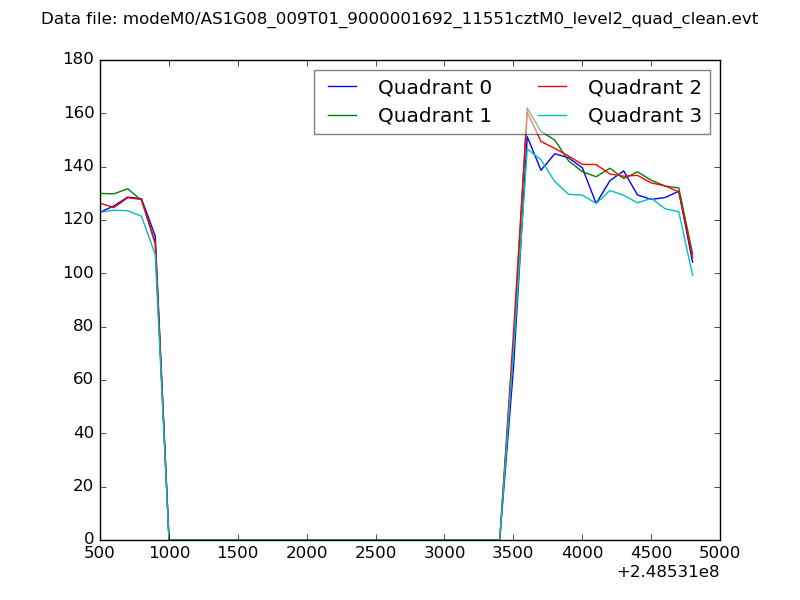 |
|
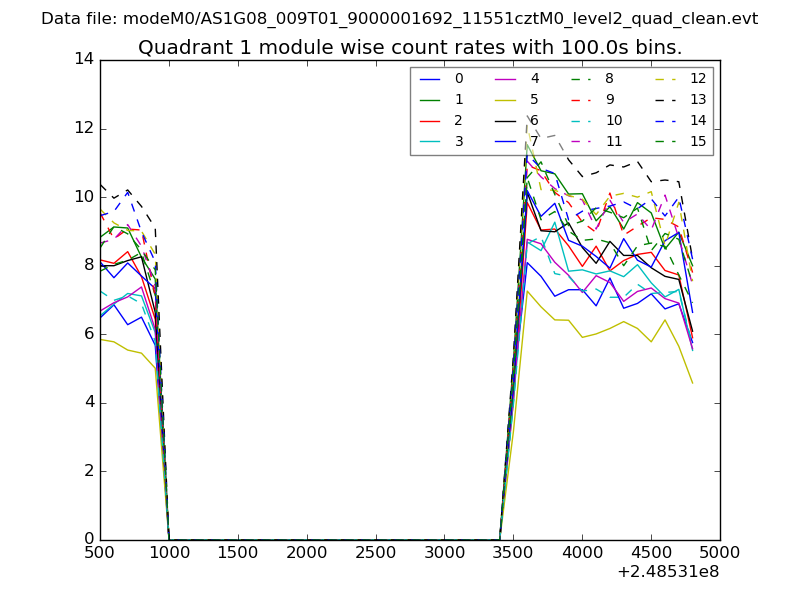
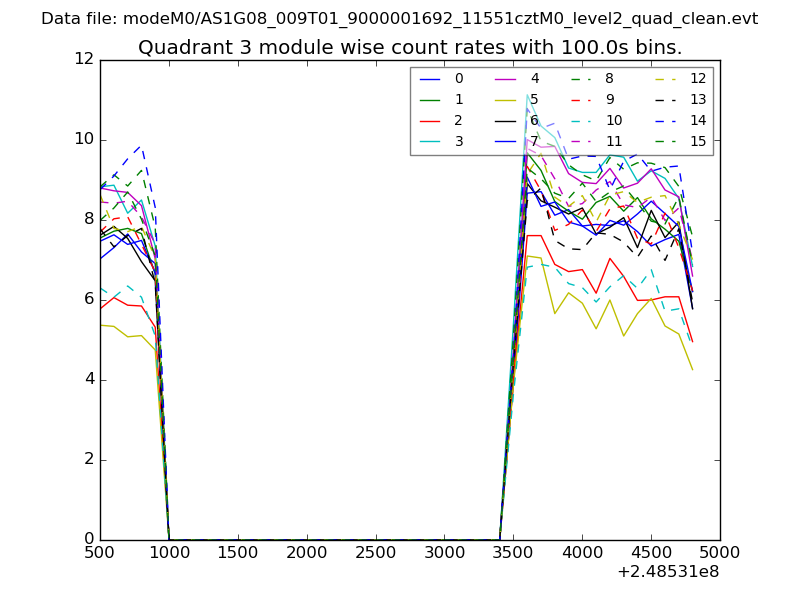
| Module-wise count rates for Quadrant A Data is divided into 100 sec bins |
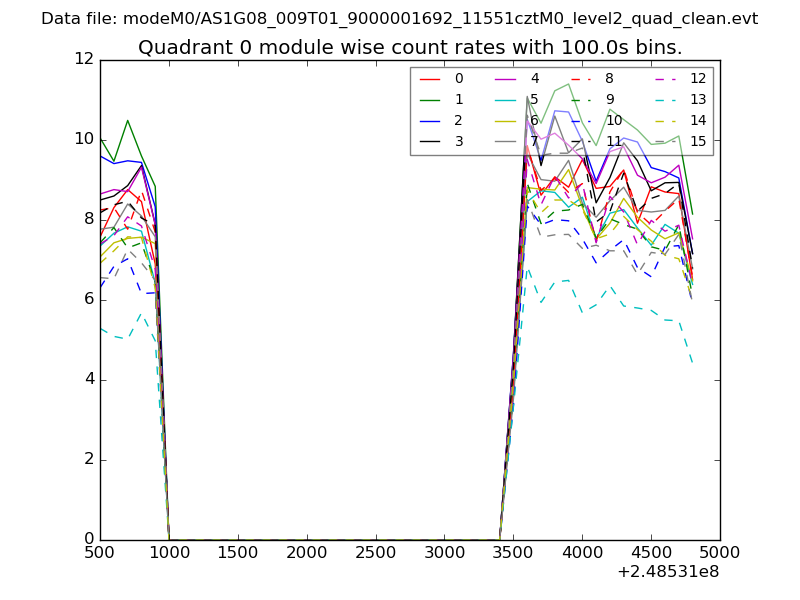 |
 |
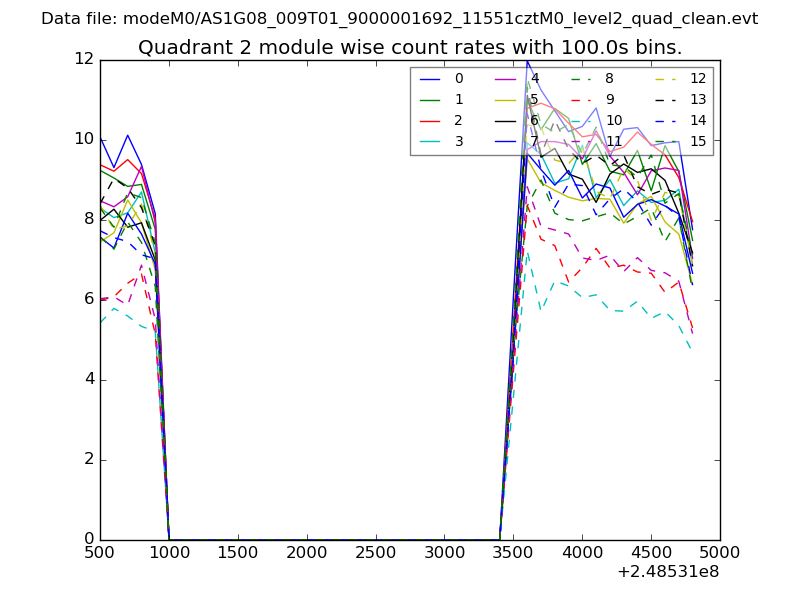
| Module-wise count rates for Quadrant B Data is divided into 100 sec bins |
 |
 |
| Module-wise count rates for Quadrant C Data is divided into 100 sec bins |
 |
 |
| Module-wise count rates for Quadrant D Data is divided into 100 sec bins |
 |
 |
| Parameter | Plot |
|---|---|
| CZT HV Monitor | 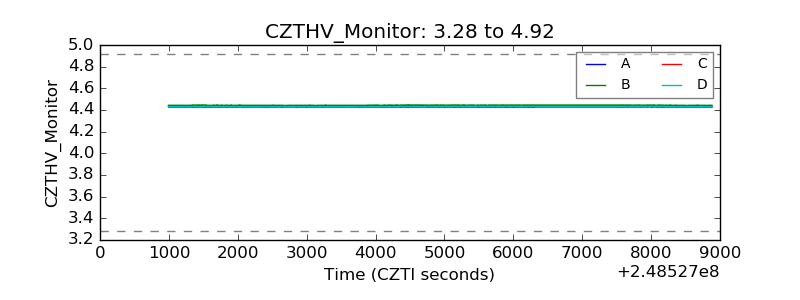 |
| D_VDD | 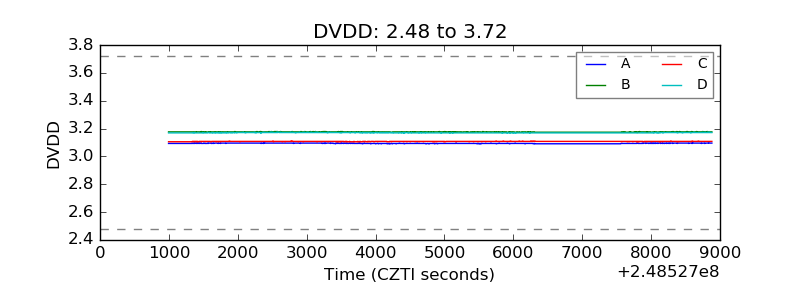 |
| Temperature 1 |  |
| Veto HV Monitor | 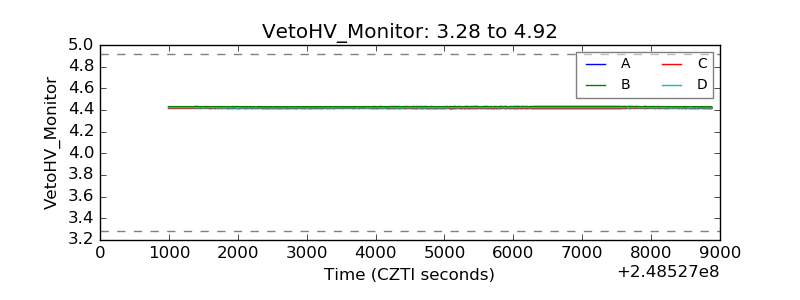 |
| Veto LLD | 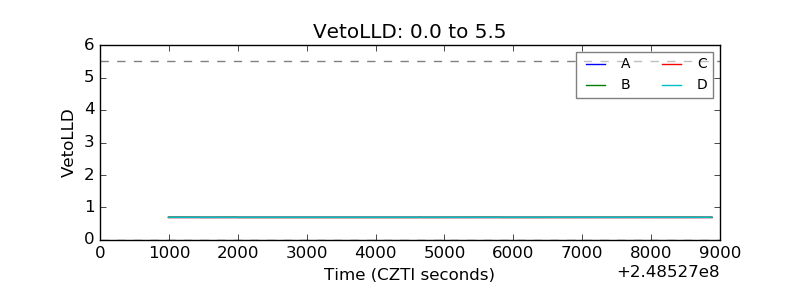 |
| Alpha Counter | 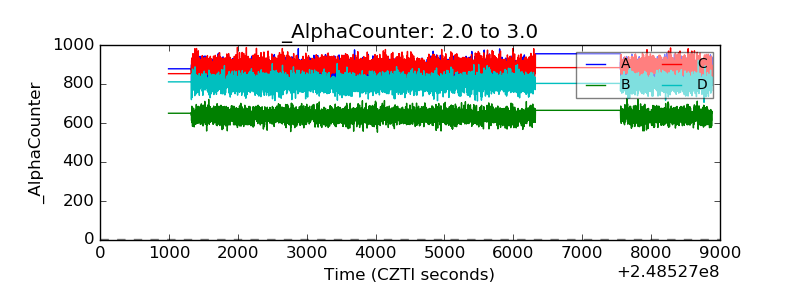 |
| _CPM_Rate | 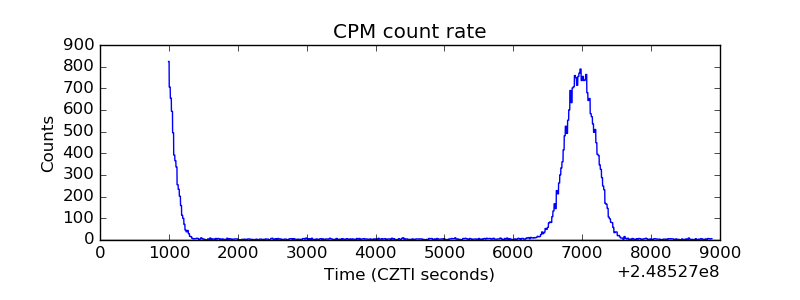 |
| CZT Counter | 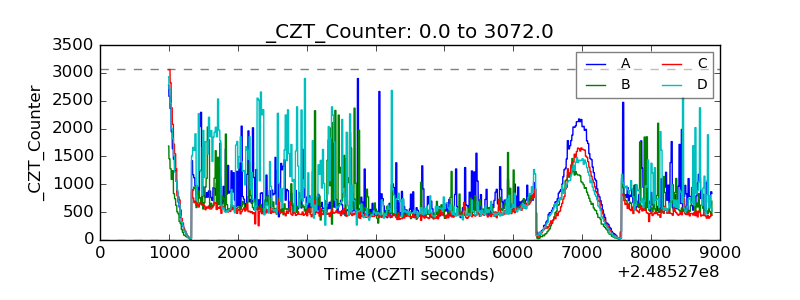 |
| +2.5 Volts monitor |  |
| +5 Volts monitor |  |
| _ROLL_ROT | 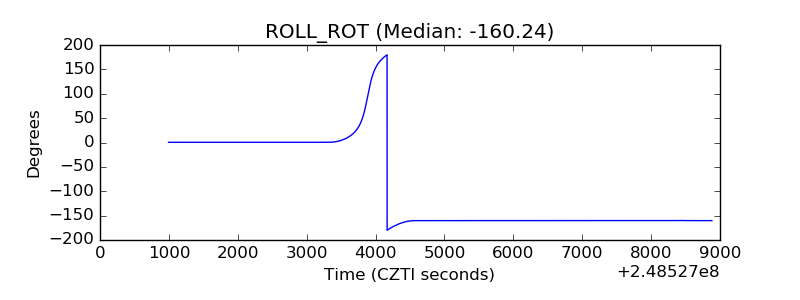 |
| _Roll_DEC | 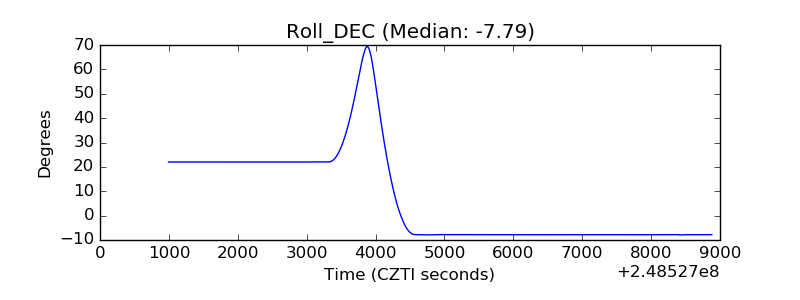 |
| _Roll_RA | 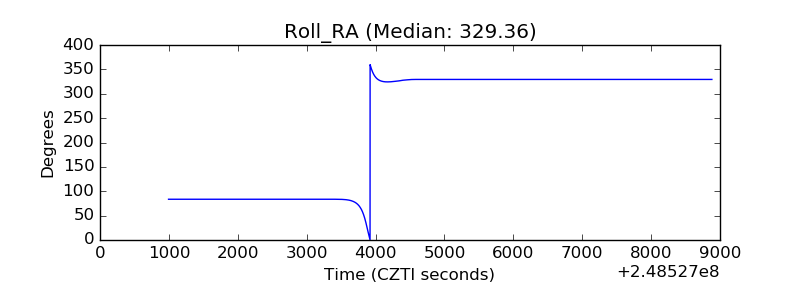 |
| Veto Counter | 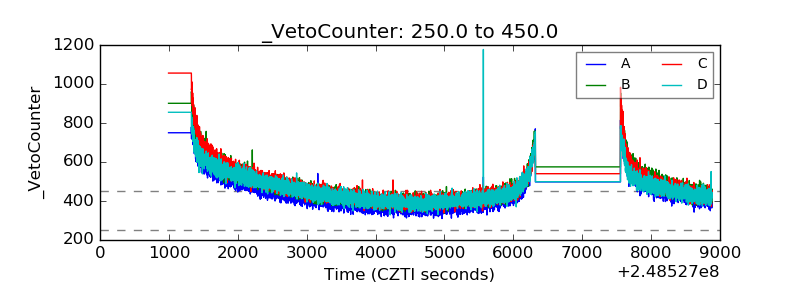 |