| Param | Original file | Final file |
|---|---|---|
| Filename | modeM0/AS1G08_009T01_9000001692_11552cztM0_level2.evt | modeM0/AS1G08_009T01_9000001692_11552cztM0_level2_quad_clean.evt |
| Size (bytes) | 658,785,600 | 89,294,400 |
| Size | 628.3 MB | 85.2 MB |
| Events in quadrant A | 5,663,846 | 550,616 |
| Events in quadrant B | 4,399,284 | 579,554 |
| Events in quadrant C | 3,002,953 | 583,850 |
| Events in quadrant D | 6,445,997 | 536,614 |
| Mode M0 | |||
|---|---|---|---|
| Quadrant | BADHDUFLAG | Total packets | Discarded packets |
| A | 0 | 21391 | 2 |
| B | 0 | 17281 | 1 |
| C | 0 | 13424 | 1 |
| D | 0 | 23713 | 1 |
| Mode M9 | |||
|---|---|---|---|
| Quadrant | BADHDUFLAG | Total packets | Discarded packets |
| A | 0 | 11 | 0 |
| B | 0 | 11 | 0 |
| C | 0 | 11 | 0 |
| D | 0 | 11 | 0 |
| Mode SS | |||
|---|---|---|---|
| Quadrant | BADHDUFLAG | Total packets | Discarded packets |
| A | 0 | 130 | 0 |
| B | 0 | 130 | 0 |
| C | 0 | 130 | 0 |
| D | 0 | 130 | 0 |
| Quadrant | Total seconds | Saturated seconds | Saturation percentage |
|---|---|---|---|
| A | 6503 | 645 | 9.918499% |
| B | 6503 | 310 | 4.767031% |
| C | 6503 | 66 | 1.014916% |
| D | 6503 | 1025 | 15.761956% |
Noise dominated data is calculated using 1-second bins in cleaned event files. If a bin has >2000 counts, and if more than 50% of those come from <1% of pixels, then it is considered to be noise-dominated and hence unusable.
| Quadrant | # 1 sec bins | Bins with >0 counts | Bins with >2000 counts | High rate bins dominated by noise | Noise dominated (total time) | Noise dominated (detector-on time) | Marked lightcurve |
|---|---|---|---|---|---|---|---|
| A | 7529 | 6505 | 279 | 279 | 3.71% | 4.29% | 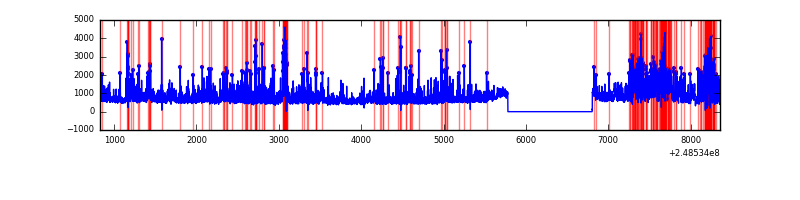 |
| B | 7529 | 6505 | 145 | 145 | 1.93% | 2.23% | 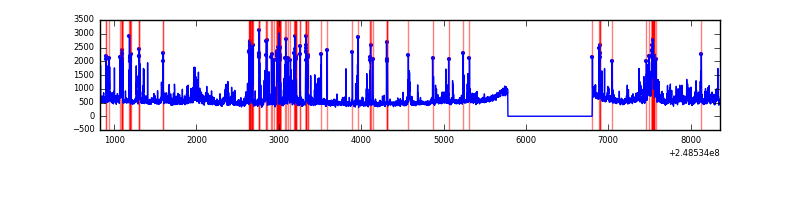 |
| C | 7529 | 6505 | 0 | 0 | 0.00% | 0.00% | 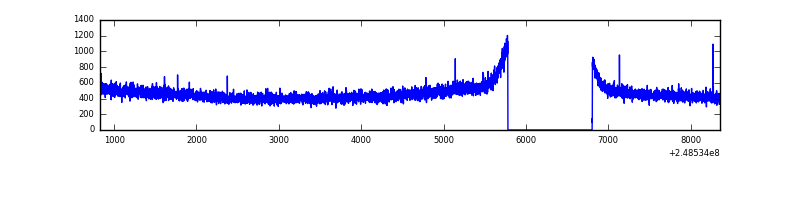 |
| D | 7529 | 6505 | 916 | 916 | 12.17% | 14.08% | 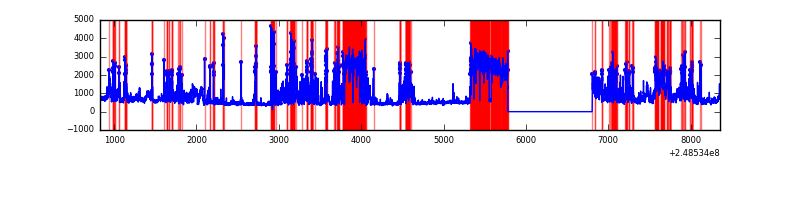 |
Top three noisy pixels from each quadrant. If the there are fewer than three noisy pixels in the level2.evt file, extra rows are filled as -1
| Pixel properties | Quadrant properties | ||||||
|---|---|---|---|---|---|---|---|
| Quadrant | DetID | PixID | Counts | Sigma | Mean | Median | Sigma |
| A | 8 | 5 | 2238291 | 14225.28 | 770 | 754 | 157.3 |
| A | 1 | 162 | 158704 | 1004.18 | 770 | 754 | 157.3 |
| A | 1 | 178 | 91494 | 576.89 | 770 | 754 | 157.3 |
| B | 4 | 239 | 909207 | 6015.54 | 789 | 771 | 151.0 |
| B | 11 | 51 | 190072 | 1253.53 | 789 | 771 | 151.0 |
| B | 15 | 204 | 170661 | 1124.99 | 789 | 771 | 151.0 |
| C | 13 | 61 | 5702 | 27.5 | 769 | 774 | 179.2 |
| C | 13 | 250 | 2042 | 7.08 | 769 | 774 | 179.2 |
| C | 3 | 202 | 1919 | 6.39 | 769 | 774 | 179.2 |
| D | 1 | 52 | 1862177 | 11128.77 | 698 | 678 | 167.3 |
| D | 1 | 255 | 938622 | 5607.4 | 698 | 678 | 167.3 |
| D | 13 | 137 | 584180 | 3488.4 | 698 | 678 | 167.3 |
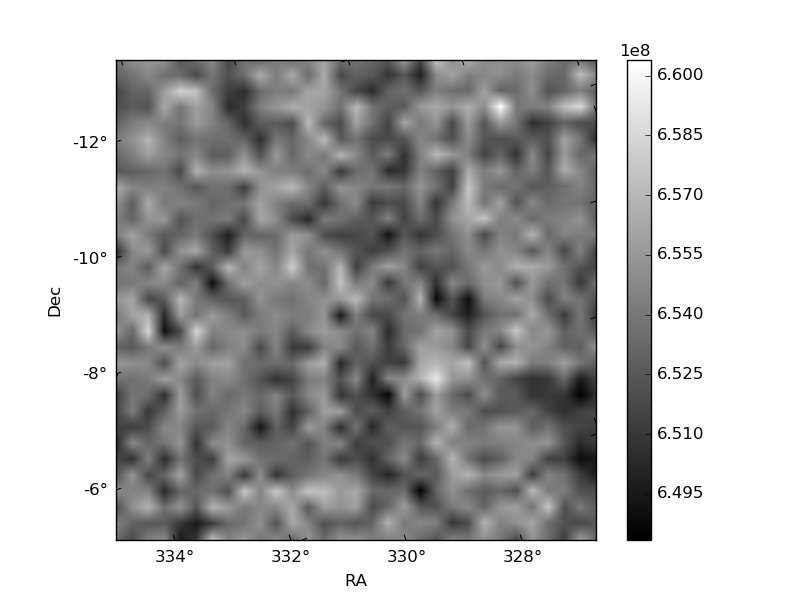
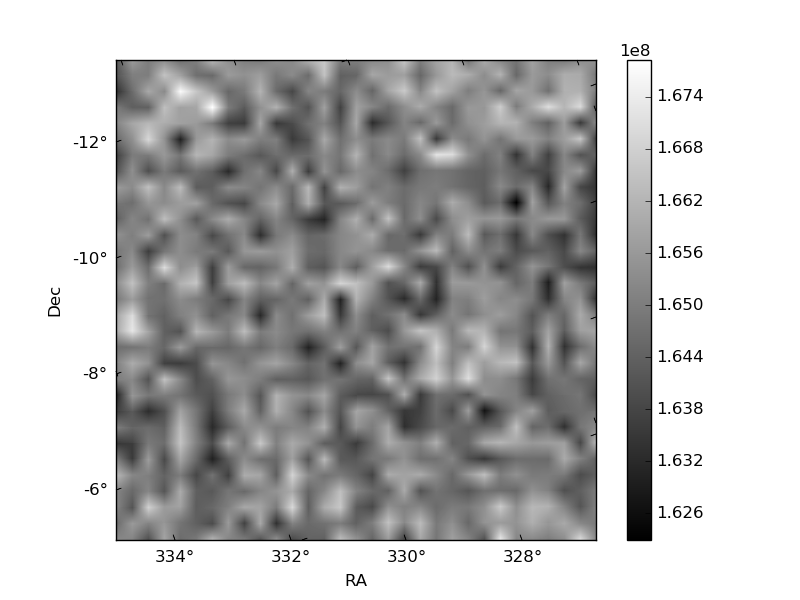
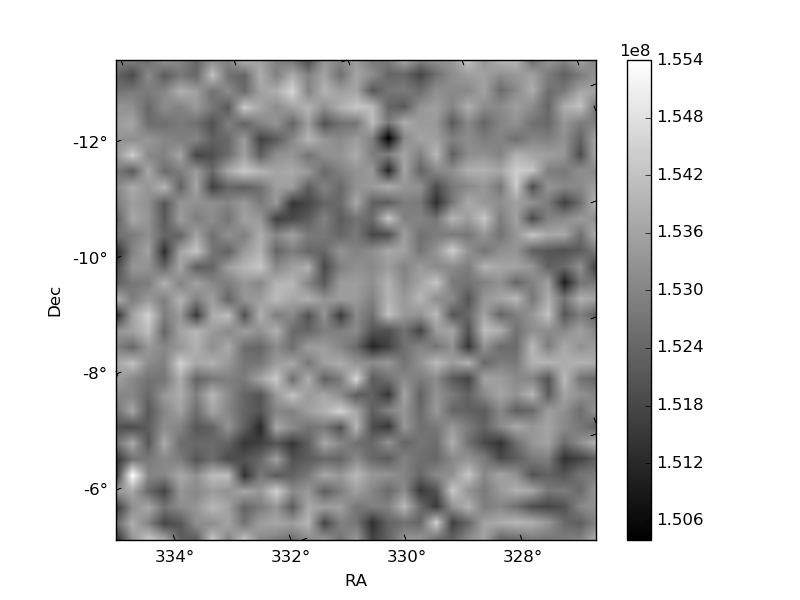
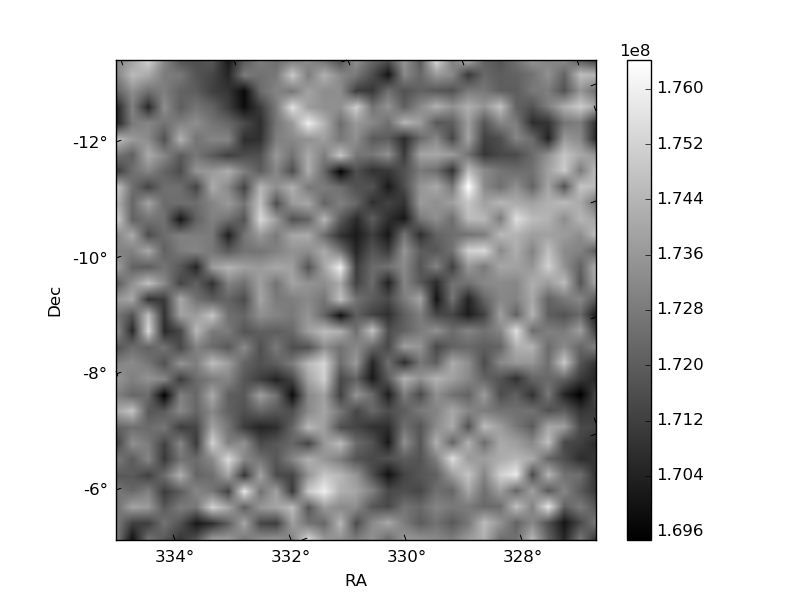
Histogram calculated using DETX and DETY for each event in the final _common_clean file
| Quadrant A | 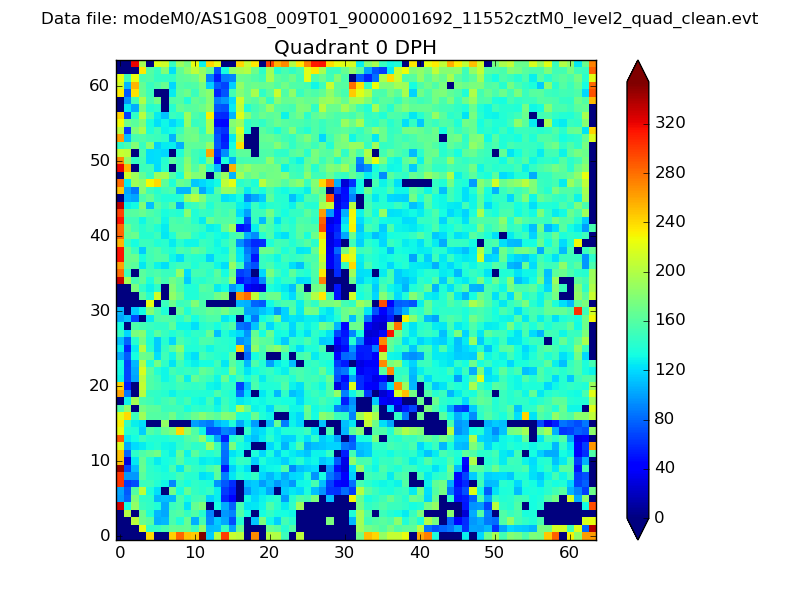 |
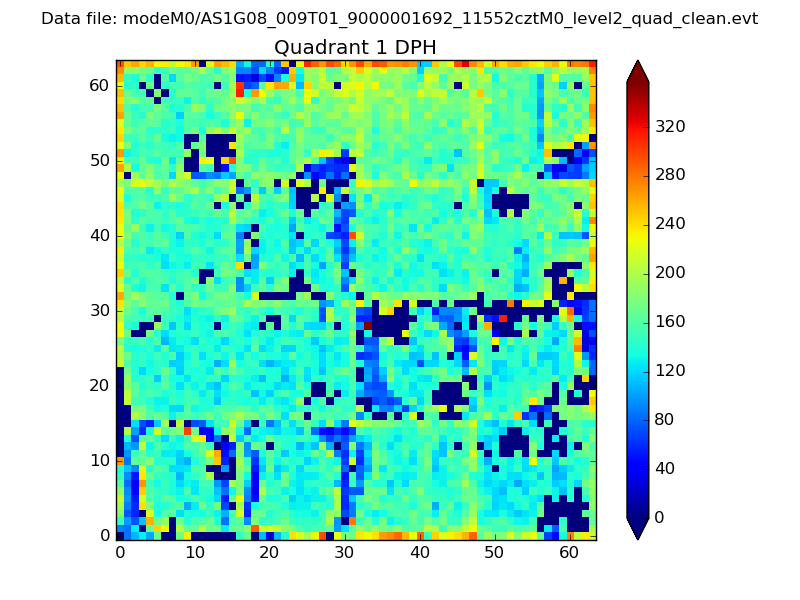 |
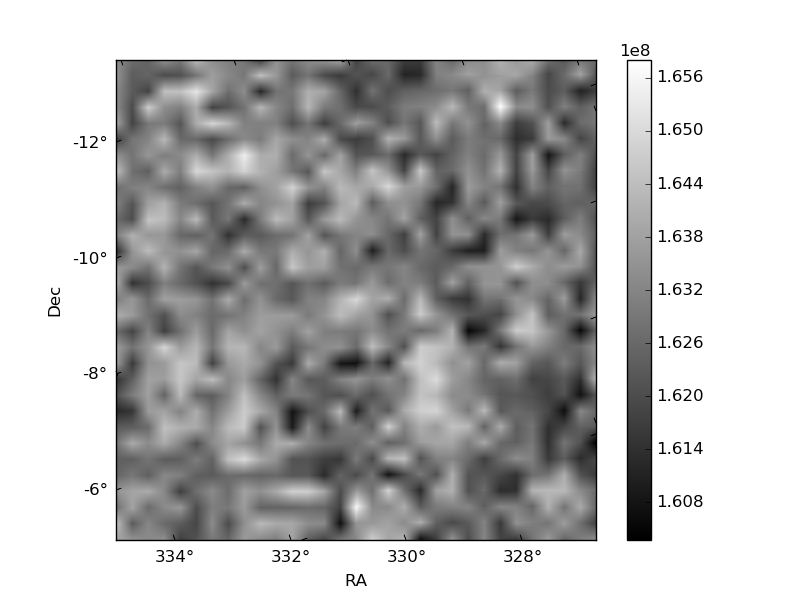
Quadrant B |
|---|---|---|---|
| Quadrant D | 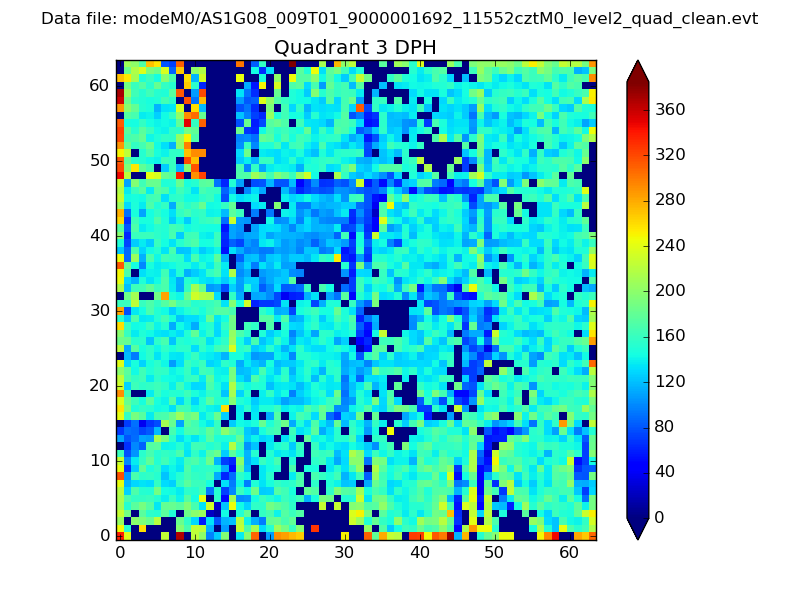 |
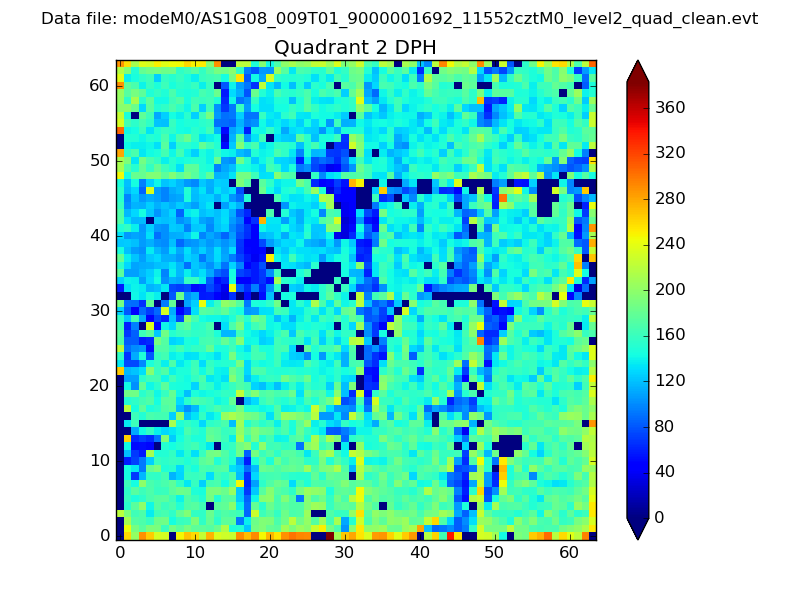 |
Quadrant C |
| Plot type | Count rate plots | Images |
|---|---|---|
| Comparison with Poisson distribution Blue bars denote a histogram of data divided into 1 sec bins. Red curve is a Poisson curve with rate = median count rate of data. |
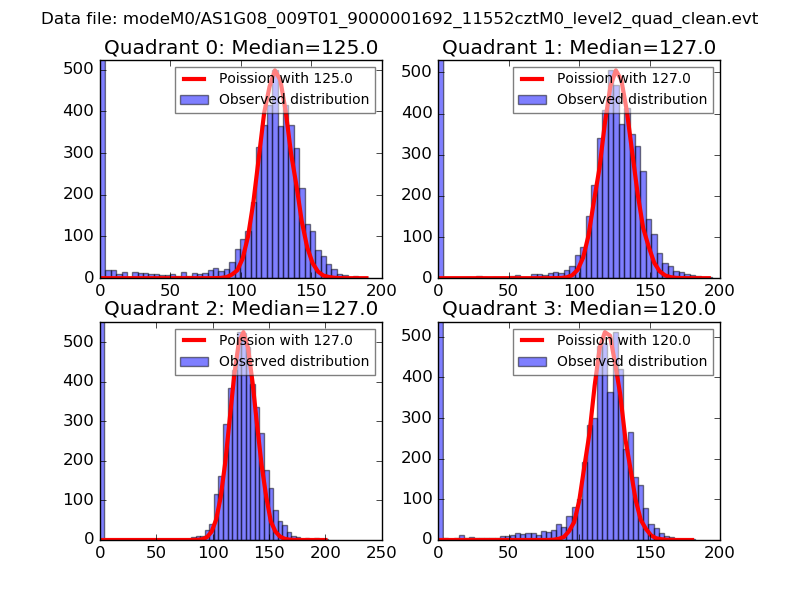 |
 |
| Quadrant-wise count rates Data is divided into 100 sec bins |
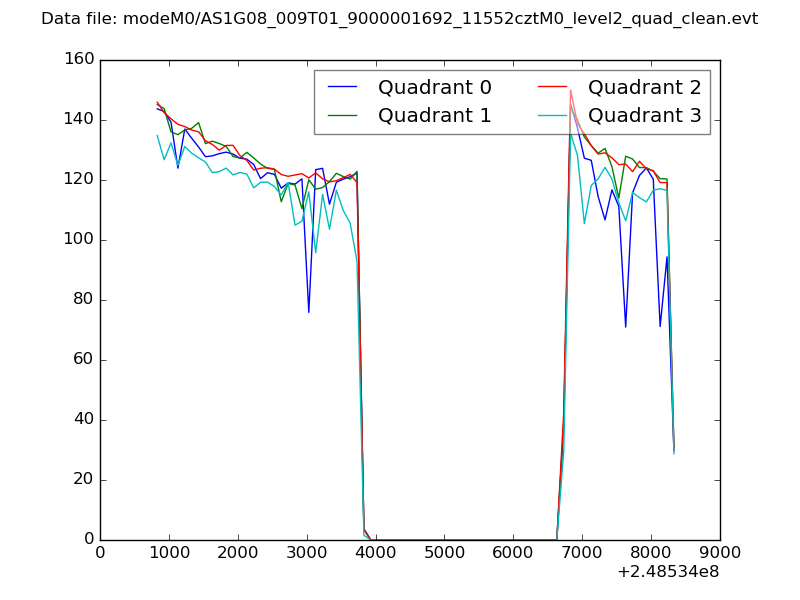 |
|
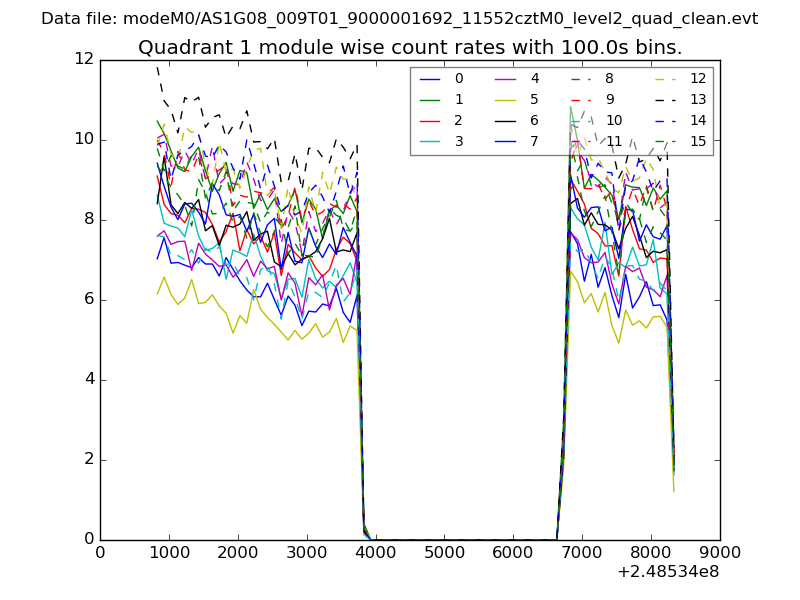
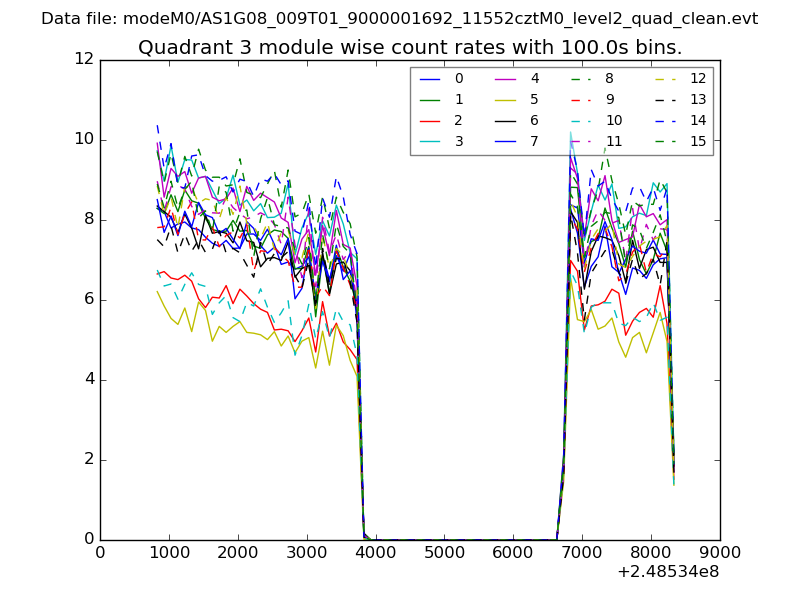
| Module-wise count rates for Quadrant A Data is divided into 100 sec bins |
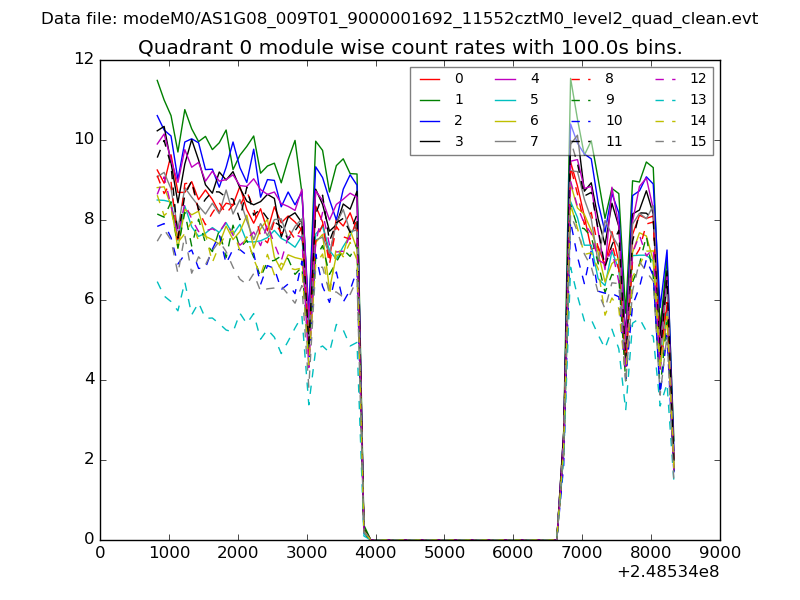 |
 |
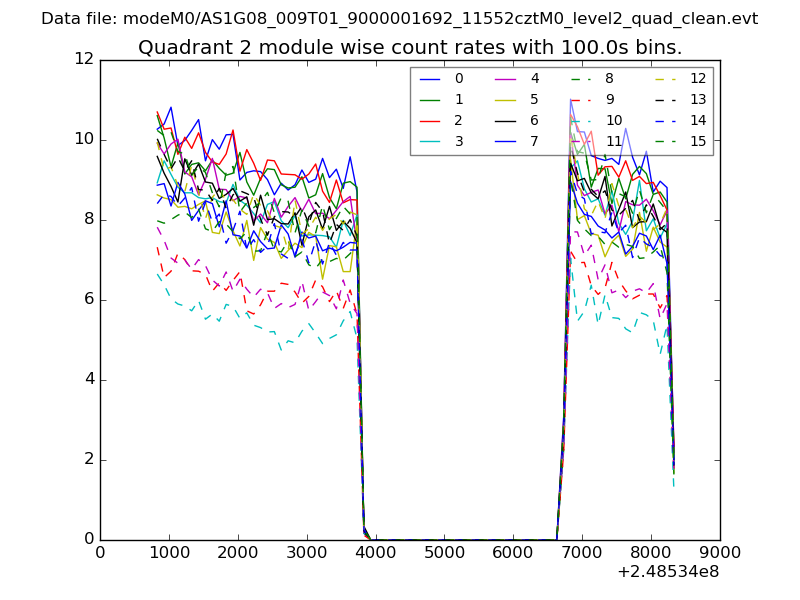
| Module-wise count rates for Quadrant B Data is divided into 100 sec bins |
 |
 |
| Module-wise count rates for Quadrant C Data is divided into 100 sec bins |
 |
 |
| Module-wise count rates for Quadrant D Data is divided into 100 sec bins |
 |
 |
| Parameter | Plot |
|---|---|
| CZT HV Monitor | 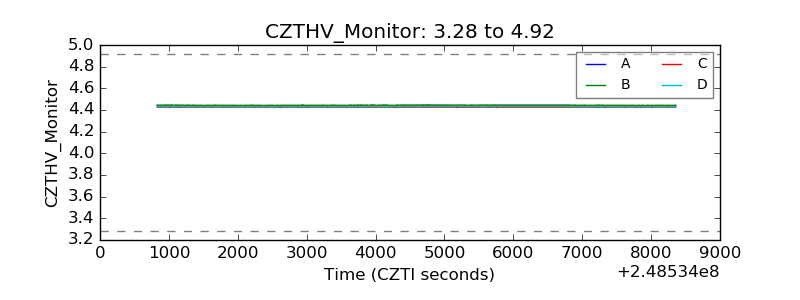 |
| D_VDD | 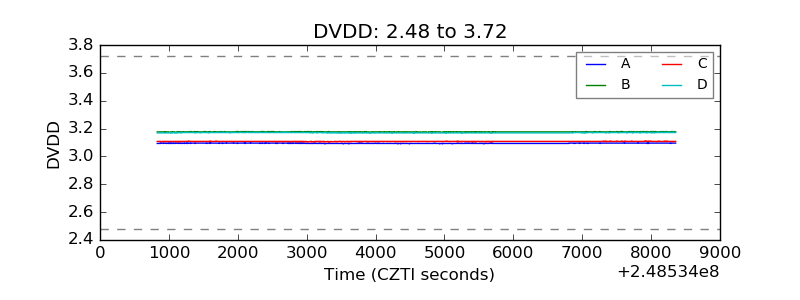 |
| Temperature 1 | 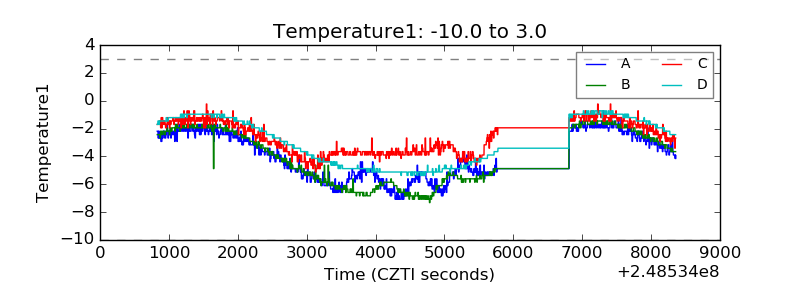 |
| Veto HV Monitor | 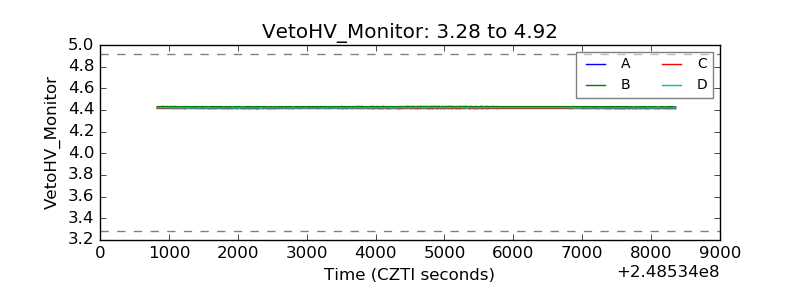 |
| Veto LLD | 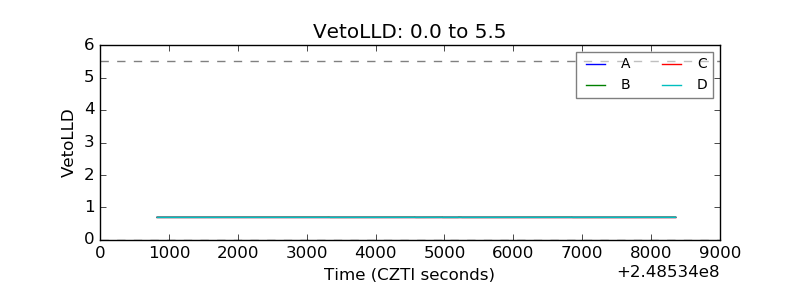 |
| Alpha Counter |  |
| _CPM_Rate | 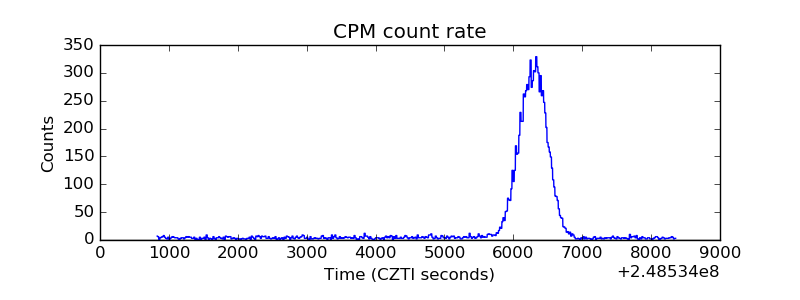 |
| CZT Counter | 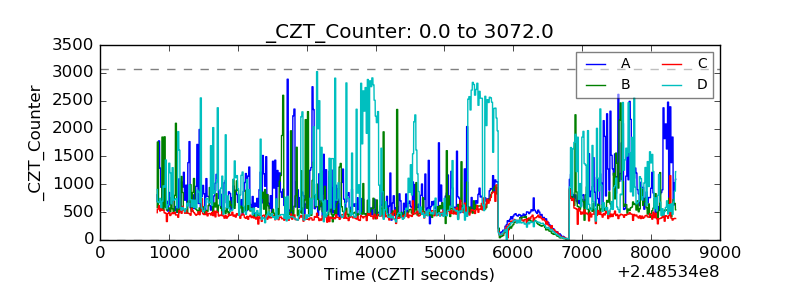 |
| +2.5 Volts monitor | 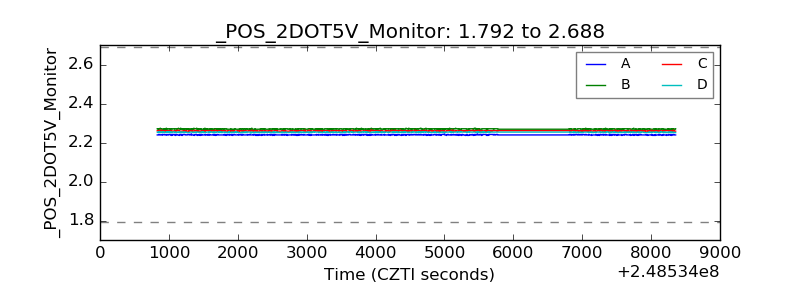 |
| +5 Volts monitor |  |
| _ROLL_ROT | 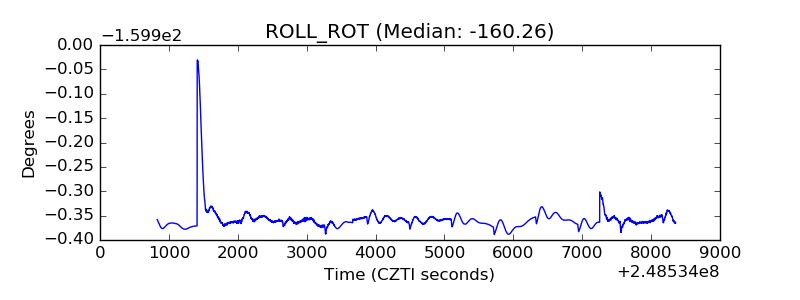 |
| _Roll_DEC | 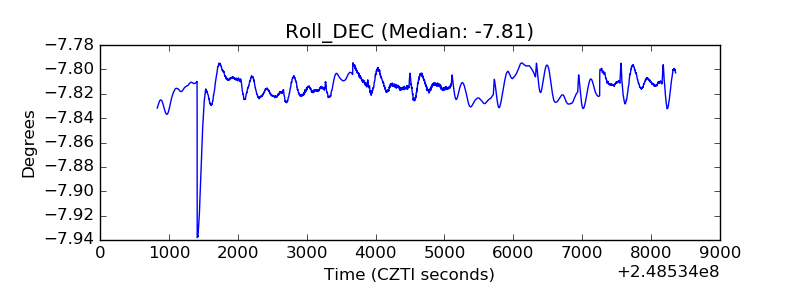 |
| _Roll_RA | 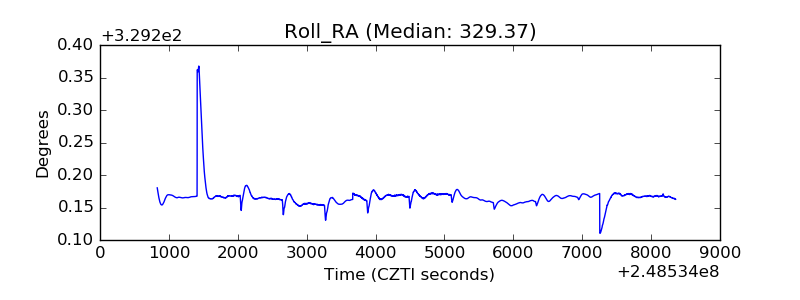 |
| Veto Counter | 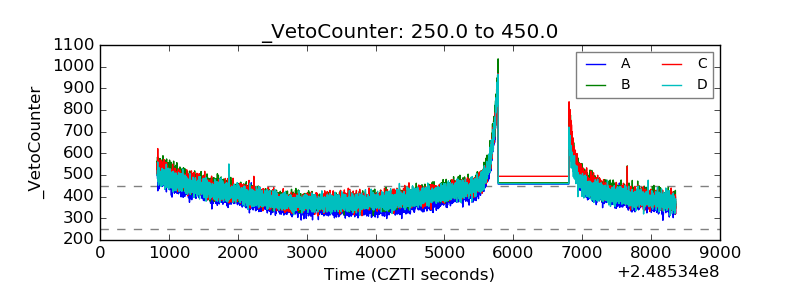 |