| Param | Original file | Final file |
|---|---|---|
| Filename | modeM0/AS1G08_009T01_9000001692_11555cztM0_level2.evt | modeM0/AS1G08_009T01_9000001692_11555cztM0_level2_quad_clean.evt |
| Size (bytes) | 716,382,720 | 108,411,840 |
| Size | 683.2 MB | 103.4 MB |
| Events in quadrant A | 5,294,107 | 689,164 |
| Events in quadrant B | 5,571,969 | 692,702 |
| Events in quadrant C | 3,631,888 | 704,471 |
| Events in quadrant D | 6,657,699 | 641,290 |
| Mode M0 | |||
|---|---|---|---|
| Quadrant | BADHDUFLAG | Total packets | Discarded packets |
| A | 0 | 21216 | 3 |
| B | 0 | 21973 | 3 |
| C | 0 | 16474 | 3 |
| D | 0 | 25231 | 3 |
| Mode M9 | |||
|---|---|---|---|
| Quadrant | BADHDUFLAG | Total packets | Discarded packets |
| A | 0 | 5 | 0 |
| B | 0 | 5 | 0 |
| C | 0 | 5 | 0 |
| D | 0 | 5 | 0 |
| Mode SS | |||
|---|---|---|---|
| Quadrant | BADHDUFLAG | Total packets | Discarded packets |
| A | 0 | 164 | 0 |
| B | 0 | 164 | 0 |
| C | 0 | 164 | 0 |
| D | 0 | 164 | 0 |
| Quadrant | Total seconds | Saturated seconds | Saturation percentage |
|---|---|---|---|
| A | 7983 | 347 | 4.346737% |
| B | 7983 | 471 | 5.900038% |
| C | 7983 | 41 | 0.513591% |
| D | 7983 | 654 | 8.192409% |
Noise dominated data is calculated using 1-second bins in cleaned event files. If a bin has >2000 counts, and if more than 50% of those come from <1% of pixels, then it is considered to be noise-dominated and hence unusable.
| Quadrant | # 1 sec bins | Bins with >0 counts | Bins with >2000 counts | High rate bins dominated by noise | Noise dominated (total time) | Noise dominated (detector-on time) | Marked lightcurve |
|---|---|---|---|---|---|---|---|
| A | 8534 | 7987 | 82 | 82 | 0.96% | 1.03% | 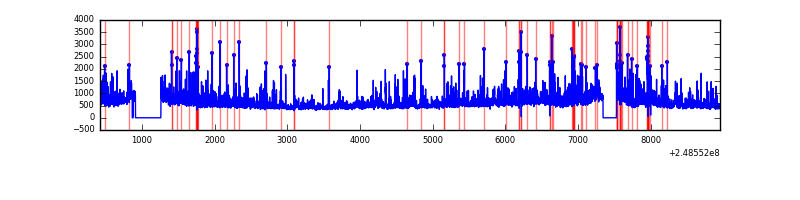 |
| B | 8534 | 7987 | 180 | 180 | 2.11% | 2.25% | 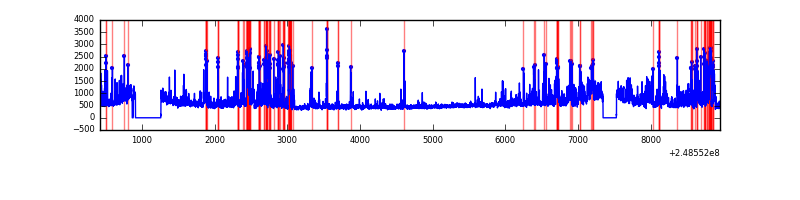 |
| C | 8534 | 7987 | 0 | 0 | 0.00% | 0.00% | 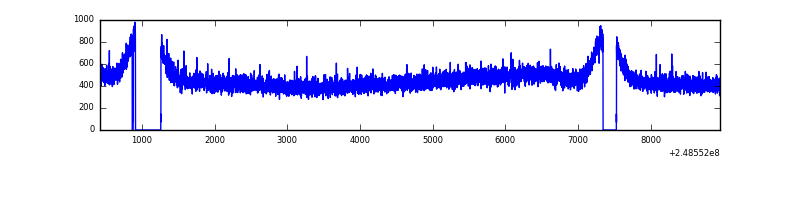 |
| D | 8534 | 7987 | 391 | 391 | 4.58% | 4.90% | 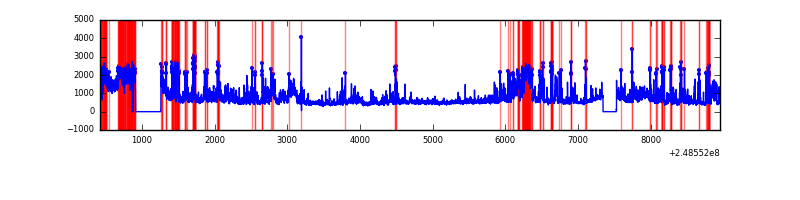 |
Top three noisy pixels from each quadrant. If the there are fewer than three noisy pixels in the level2.evt file, extra rows are filled as -1
| Pixel properties | Quadrant properties | ||||||
|---|---|---|---|---|---|---|---|
| Quadrant | DetID | PixID | Counts | Sigma | Mean | Median | Sigma |
| A | 8 | 5 | 1119155 | 5756.28 | 950 | 927 | 194.3 |
| A | 1 | 162 | 132417 | 676.87 | 950 | 927 | 194.3 |
| A | 9 | 143 | 118966 | 607.63 | 950 | 927 | 194.3 |
| B | 4 | 239 | 1022494 | 5575.01 | 950 | 927 | 183.2 |
| B | 15 | 204 | 522154 | 2844.5 | 950 | 927 | 183.2 |
| B | 11 | 51 | 103958 | 562.27 | 950 | 927 | 183.2 |
| C | 13 | 61 | 7023 | 27.93 | 931 | 935 | 218.0 |
| C | 3 | 202 | 2183 | 5.72 | 931 | 935 | 218.0 |
| C | -1 | -1 | -1 | -1.0 | 931 | 935 | 218.0 |
| D | 13 | 137 | 2042897 | 9339.95 | 899 | 872 | 218.6 |
| D | 1 | 52 | 756238 | 3454.94 | 899 | 872 | 218.6 |
| D | 2 | 120 | 173147 | 787.96 | 899 | 872 | 218.6 |
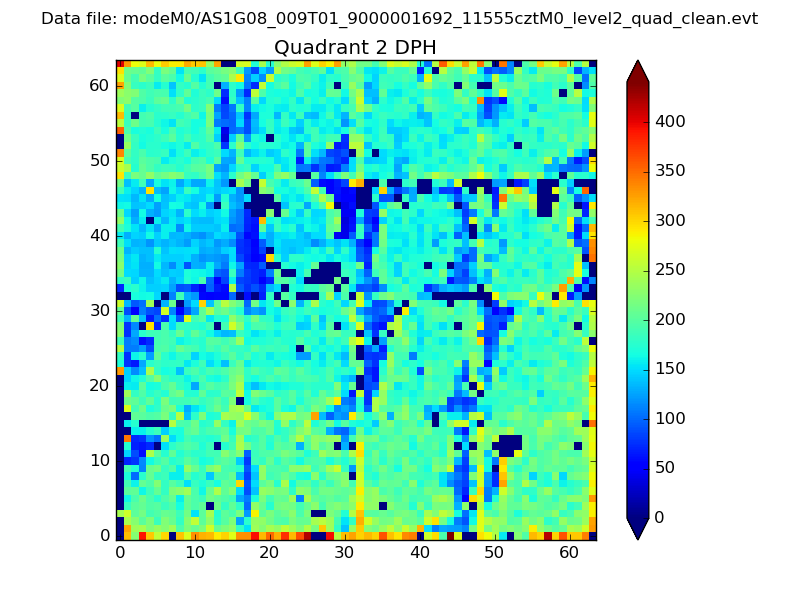
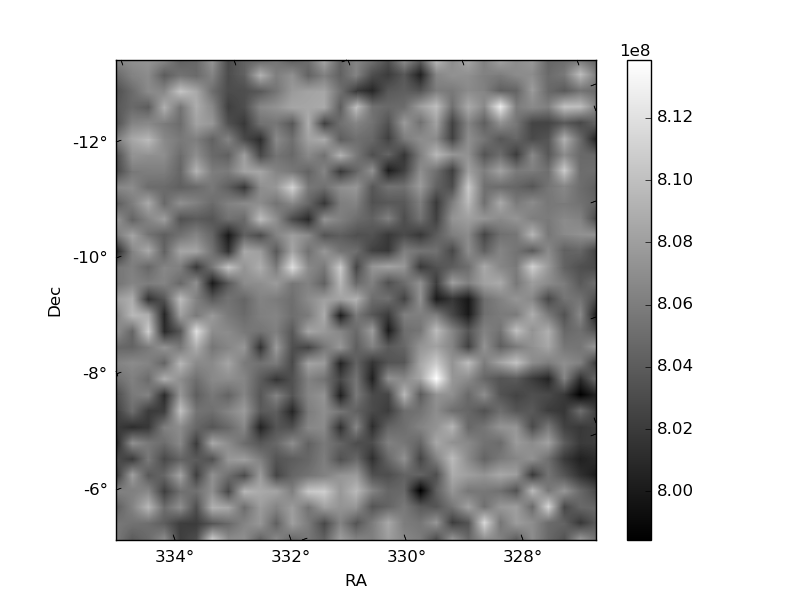
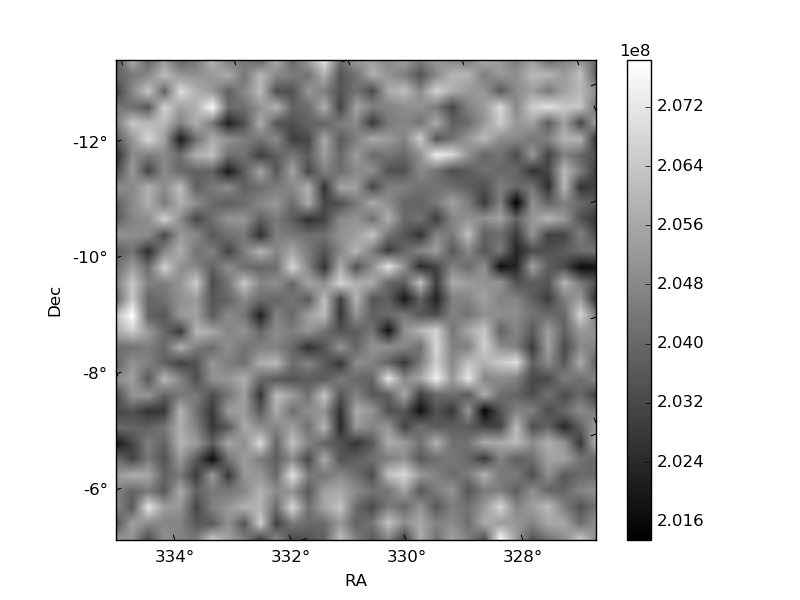
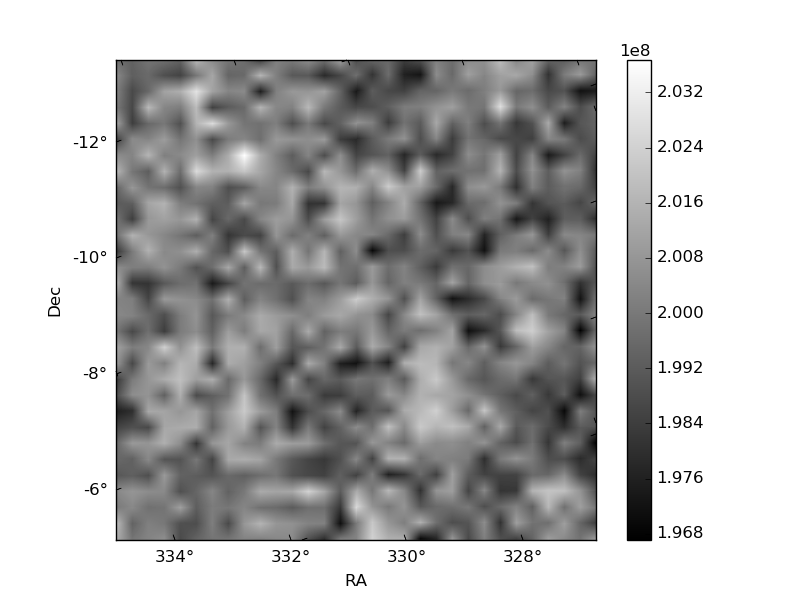
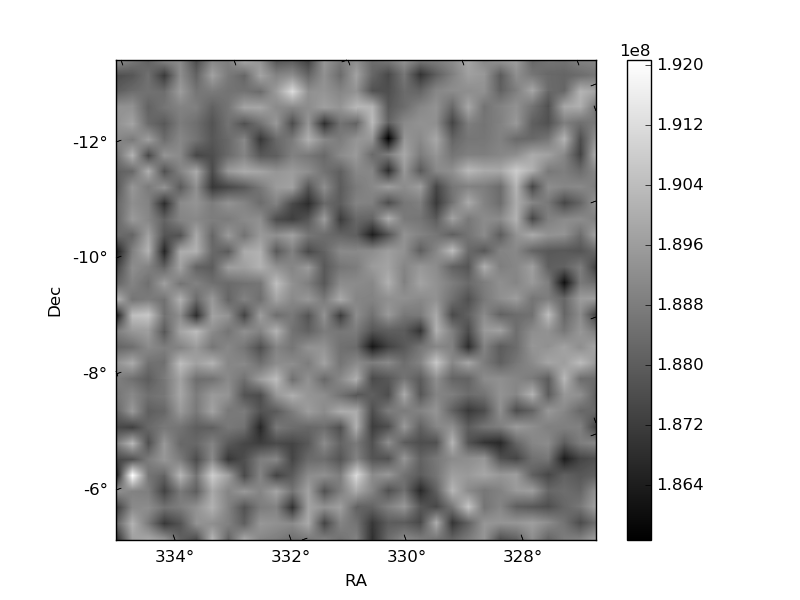
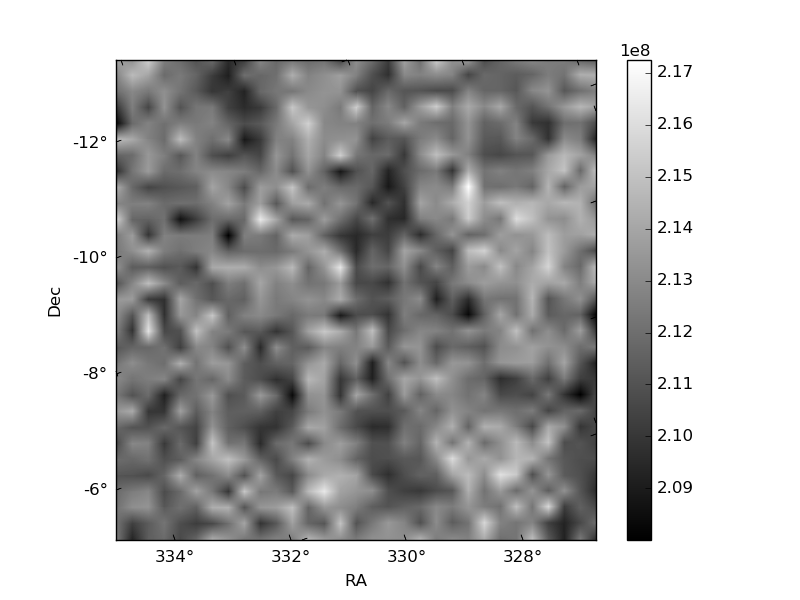
Histogram calculated using DETX and DETY for each event in the final _common_clean file
| Quadrant A | 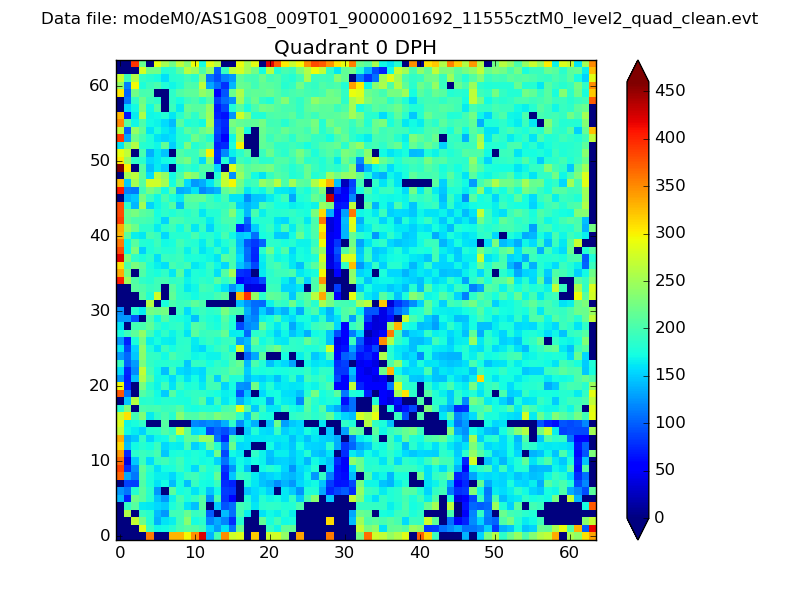 |
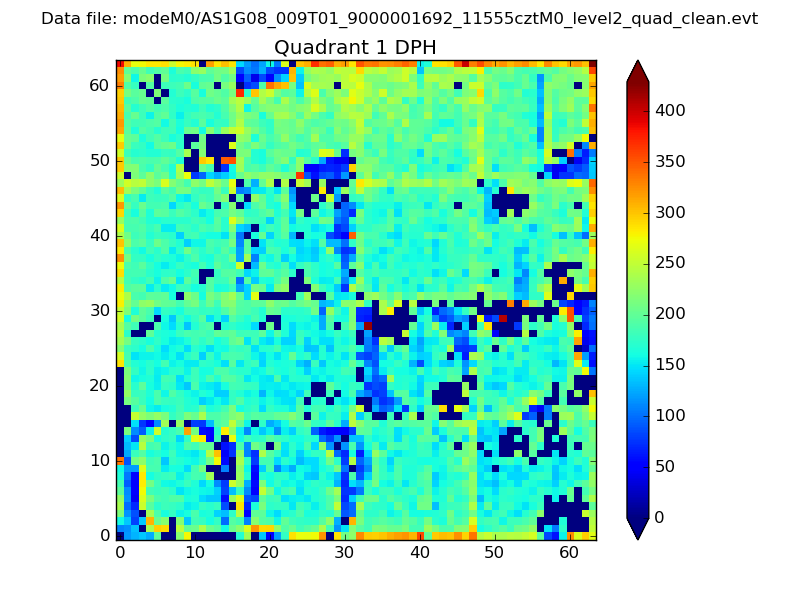 |
Quadrant B |
|---|---|---|---|
| Quadrant D | 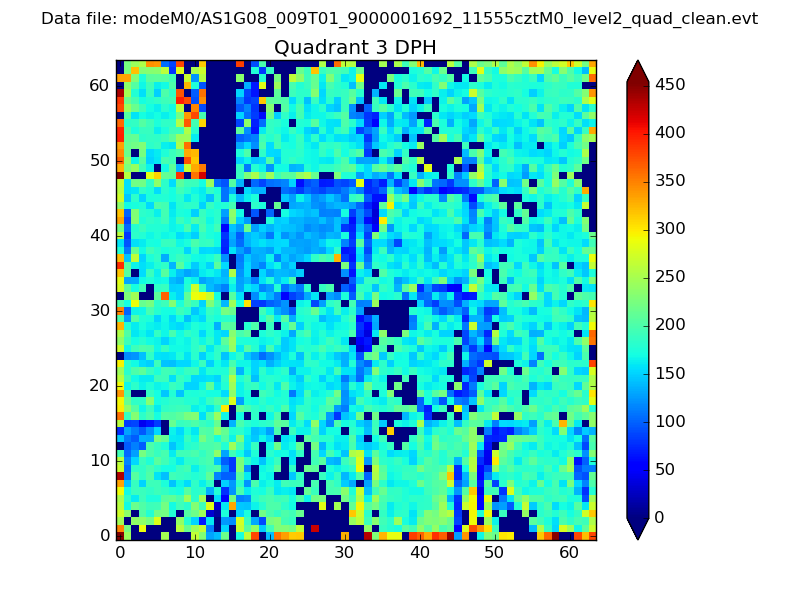 |
 |
Quadrant C |
| Plot type | Count rate plots | Images |
|---|---|---|
| Comparison with Poisson distribution Blue bars denote a histogram of data divided into 1 sec bins. Red curve is a Poisson curve with rate = median count rate of data. |
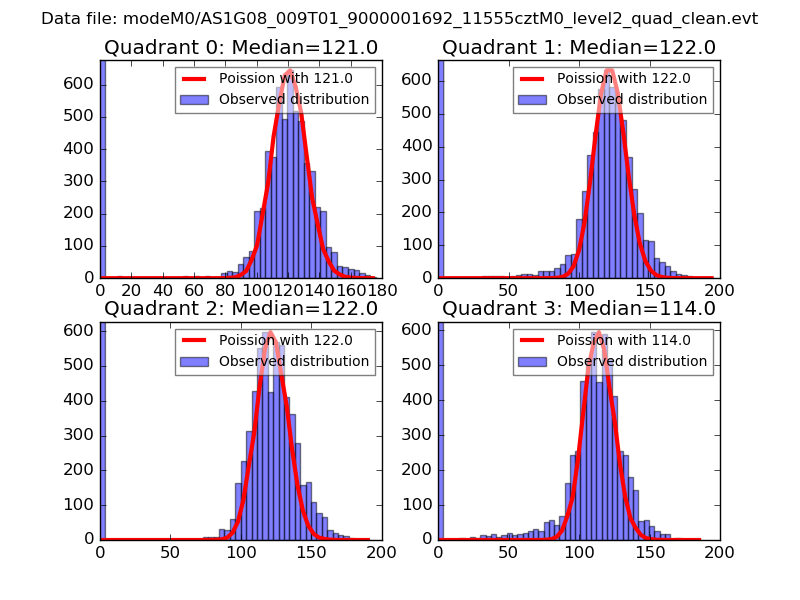 |
 |
| Quadrant-wise count rates Data is divided into 100 sec bins |
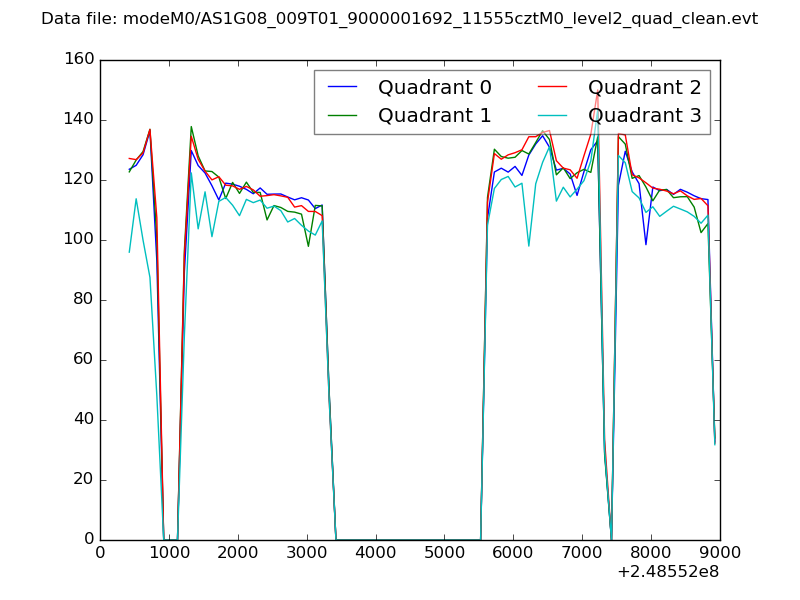 |
|
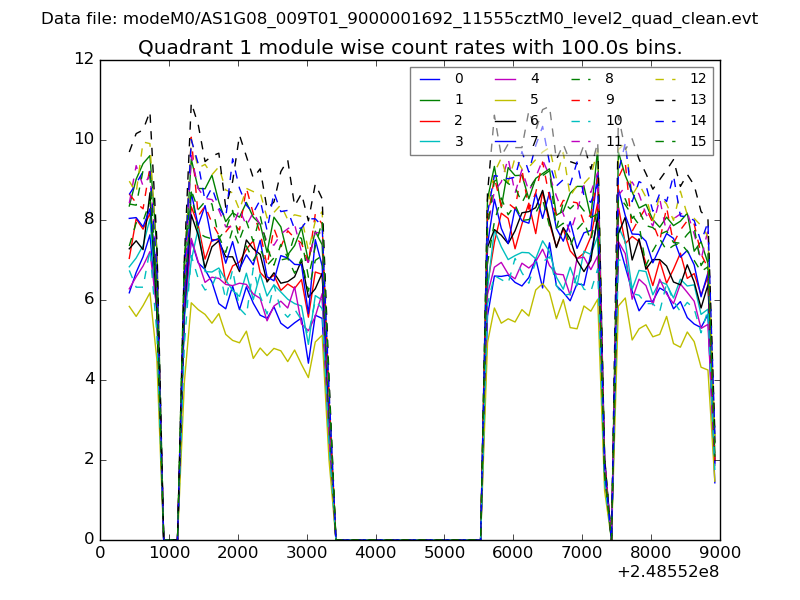
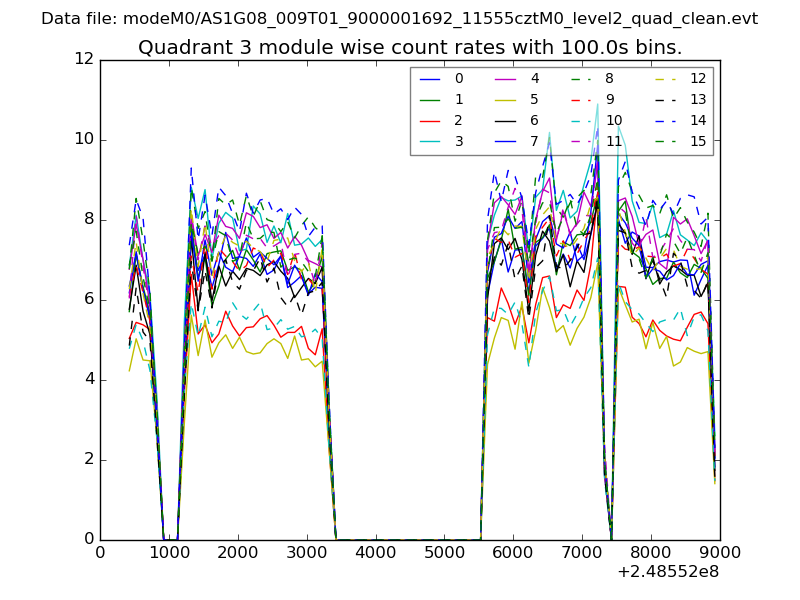
| Module-wise count rates for Quadrant A Data is divided into 100 sec bins |
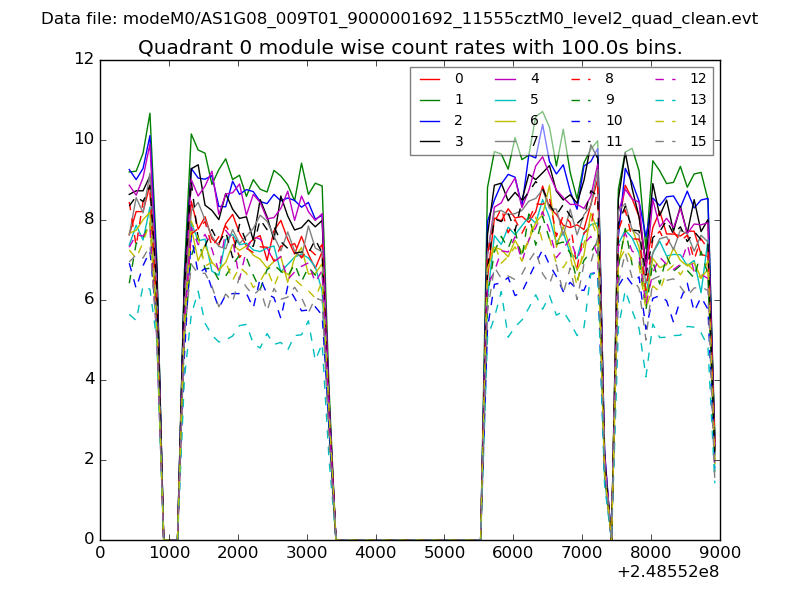 |
 |
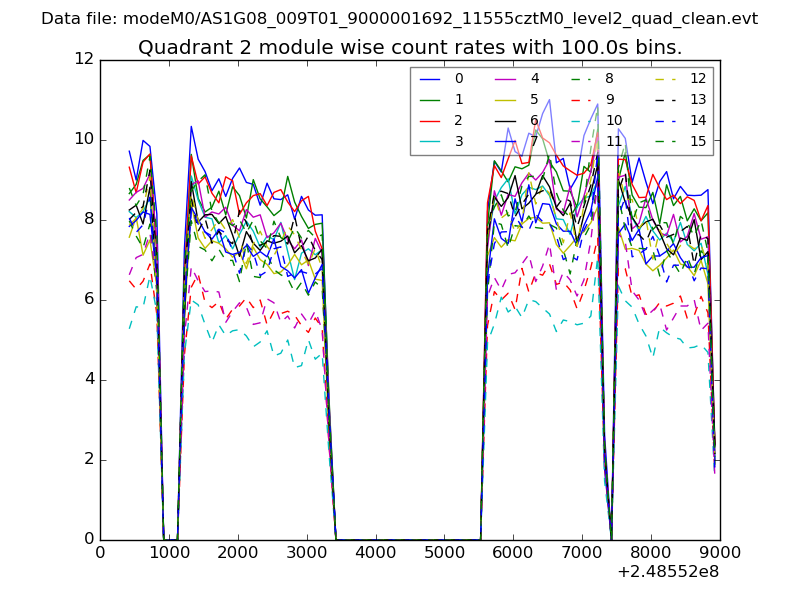
| Module-wise count rates for Quadrant B Data is divided into 100 sec bins |
 |
 |
| Module-wise count rates for Quadrant C Data is divided into 100 sec bins |
 |
 |
| Module-wise count rates for Quadrant D Data is divided into 100 sec bins |
 |
 |
| Parameter | Plot |
|---|---|
| CZT HV Monitor | 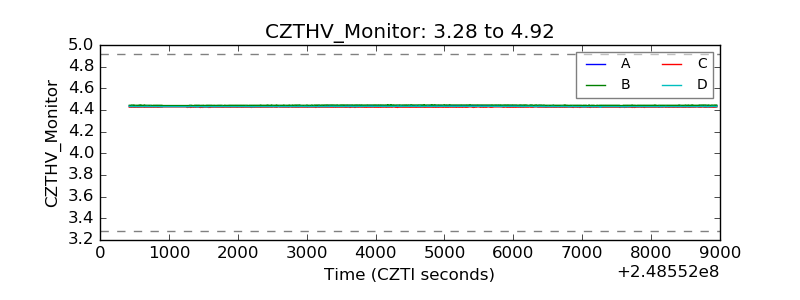 |
| D_VDD |  |
| Temperature 1 | 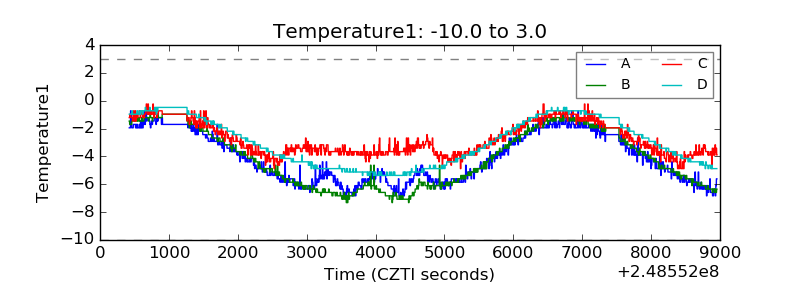 |
| Veto HV Monitor | 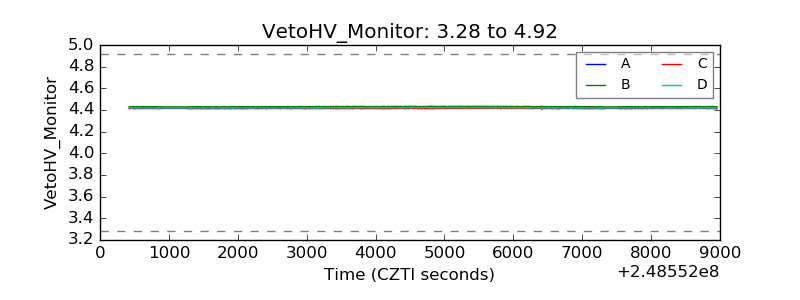 |
| Veto LLD | 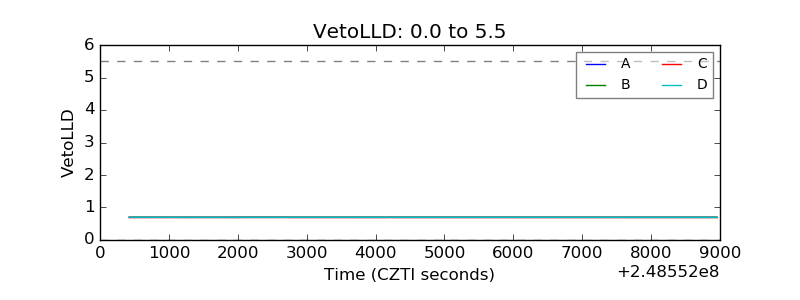 |
| Alpha Counter | 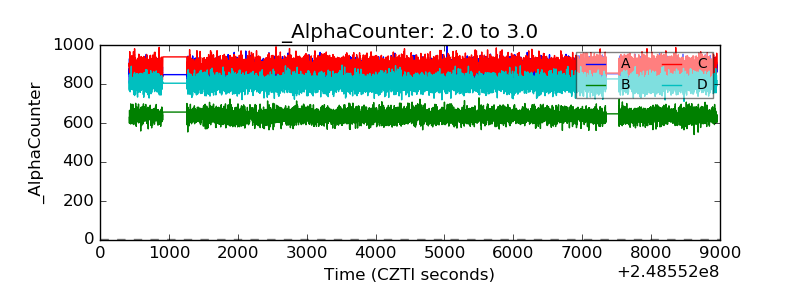 |
| _CPM_Rate | 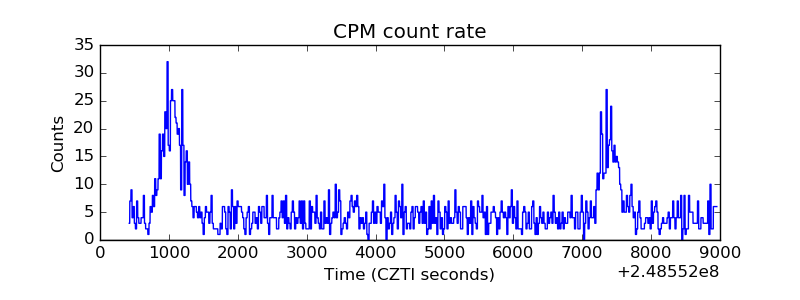 |
| CZT Counter | 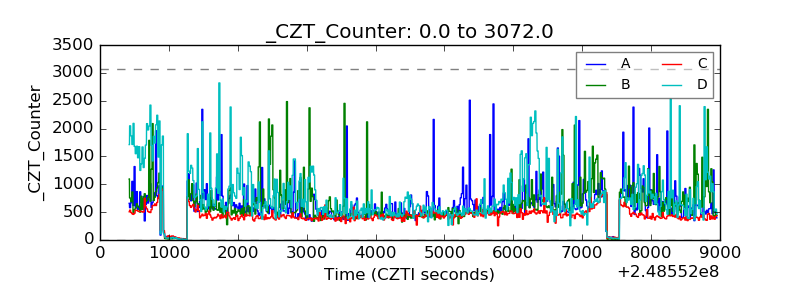 |
| +2.5 Volts monitor |  |
| +5 Volts monitor | 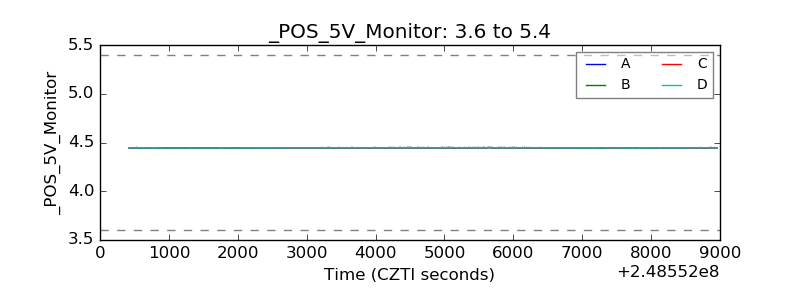 |
| _ROLL_ROT | 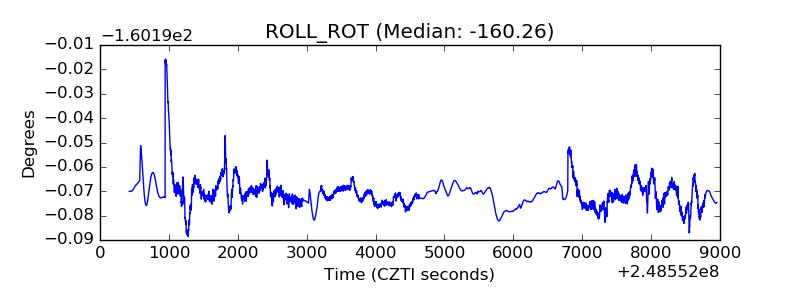 |
| _Roll_DEC | 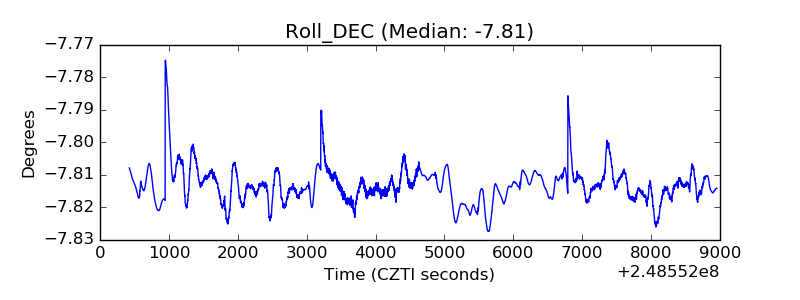 |
| _Roll_RA | 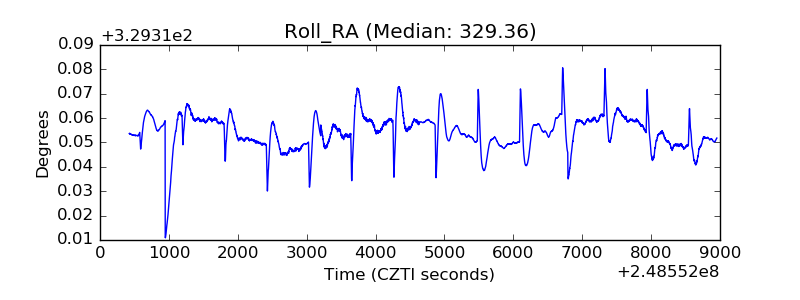 |
| Veto Counter | 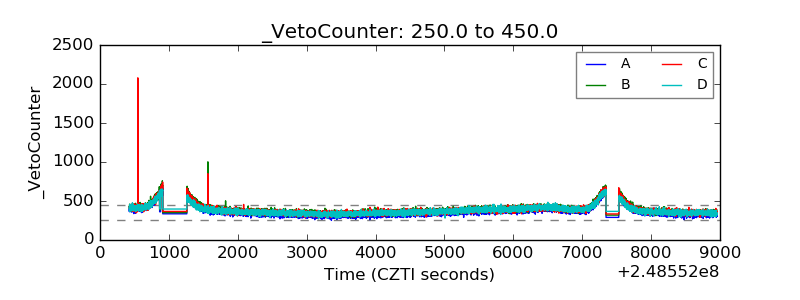 |