| Param | Original file | Final file |
|---|---|---|
| Filename | modeM0/AS1G08_009T01_9000001692_11556cztM0_level2.evt | modeM0/AS1G08_009T01_9000001692_11556cztM0_level2_quad_clean.evt |
| Size (bytes) | 157,950,720 | 29,485,440 |
| Size | 150.6 MB | 28.1 MB |
| Events in quadrant A | 1,166,212 | 192,582 |
| Events in quadrant B | 1,414,831 | 192,388 |
| Events in quadrant C | 768,778 | 199,073 |
| Events in quadrant D | 1,321,289 | 188,735 |
| Mode M0 | |||
|---|---|---|---|
| Quadrant | BADHDUFLAG | Total packets | Discarded packets |
| A | 0 | 4560 | 1 |
| B | 0 | 5343 | 1 |
| C | 0 | 3499 | 1 |
| D | 0 | 5075 | 1 |
| Mode M9 | |||
|---|---|---|---|
| Quadrant | BADHDUFLAG | Total packets | Discarded packets |
| A | 0 | 2 | 0 |
| B | 0 | 2 | 0 |
| C | 0 | 2 | 0 |
| D | 0 | 2 | 0 |
| Mode SS | |||
|---|---|---|---|
| Quadrant | BADHDUFLAG | Total packets | Discarded packets |
| A | 0 | 34 | 0 |
| B | 0 | 34 | 0 |
| C | 0 | 34 | 0 |
| D | 0 | 34 | 0 |
| Quadrant | Total seconds | Saturated seconds | Saturation percentage |
|---|---|---|---|
| A | 1625 | 146 | 8.984615% |
| B | 1625 | 227 | 13.969231% |
| C | 1625 | 29 | 1.784615% |
| D | 1625 | 75 | 4.615385% |
Noise dominated data is calculated using 1-second bins in cleaned event files. If a bin has >2000 counts, and if more than 50% of those come from <1% of pixels, then it is considered to be noise-dominated and hence unusable.
| Quadrant | # 1 sec bins | Bins with >0 counts | Bins with >2000 counts | High rate bins dominated by noise | Noise dominated (total time) | Noise dominated (detector-on time) | Marked lightcurve |
|---|---|---|---|---|---|---|---|
| A | 1811 | 1627 | 28 | 28 | 1.55% | 1.72% | 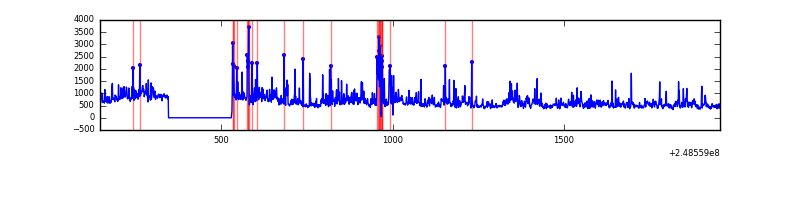 |
| B | 1811 | 1627 | 55 | 55 | 3.04% | 3.38% |  |
| C | 1811 | 1627 | 0 | 0 | 0.00% | 0.00% |  |
| D | 1811 | 1627 | 42 | 42 | 2.32% | 2.58% | 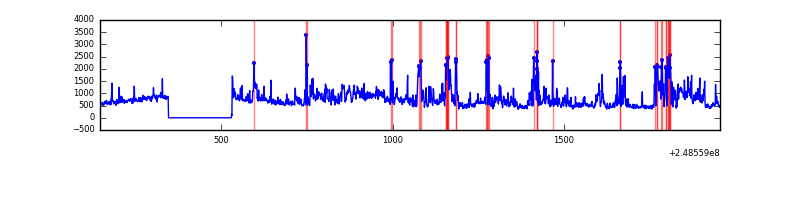 |
Top three noisy pixels from each quadrant. If the there are fewer than three noisy pixels in the level2.evt file, extra rows are filled as -1
| Pixel properties | Quadrant properties | ||||||
|---|---|---|---|---|---|---|---|
| Quadrant | DetID | PixID | Counts | Sigma | Mean | Median | Sigma |
| A | 8 | 5 | 267821 | 6260.62 | 196 | 191 | 42.7 |
| A | 1 | 162 | 43007 | 1001.59 | 196 | 191 | 42.7 |
| A | 1 | 178 | 25561 | 593.48 | 196 | 191 | 42.7 |
| B | 4 | 239 | 346134 | 8534.39 | 197 | 192 | 40.5 |
| B | 15 | 204 | 239450 | 5902.5 | 197 | 192 | 40.5 |
| B | 2 | 209 | 25170 | 616.21 | 197 | 192 | 40.5 |
| C | 13 | 61 | 1504 | 27.18 | 197 | 196 | 48.1 |
| C | 3 | 202 | 463 | 5.55 | 197 | 196 | 48.1 |
| C | -1 | -1 | -1 | -1.0 | 197 | 196 | 48.1 |
| D | 13 | 137 | 368295 | 7552.55 | 195 | 188 | 48.7 |
| D | 1 | 52 | 113334 | 2321.45 | 195 | 188 | 48.7 |
| D | 10 | 199 | 30647 | 624.94 | 195 | 188 | 48.7 |
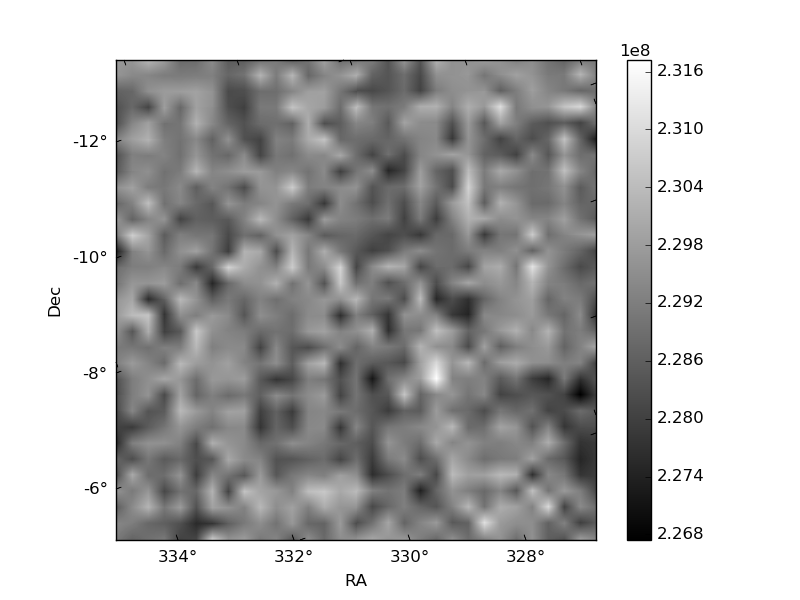
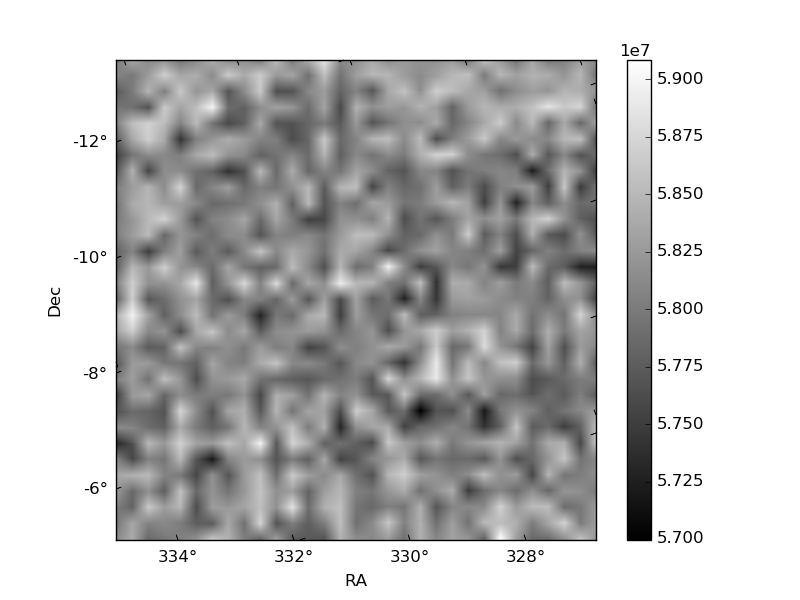
Histogram calculated using DETX and DETY for each event in the final _common_clean file
| Quadrant A | 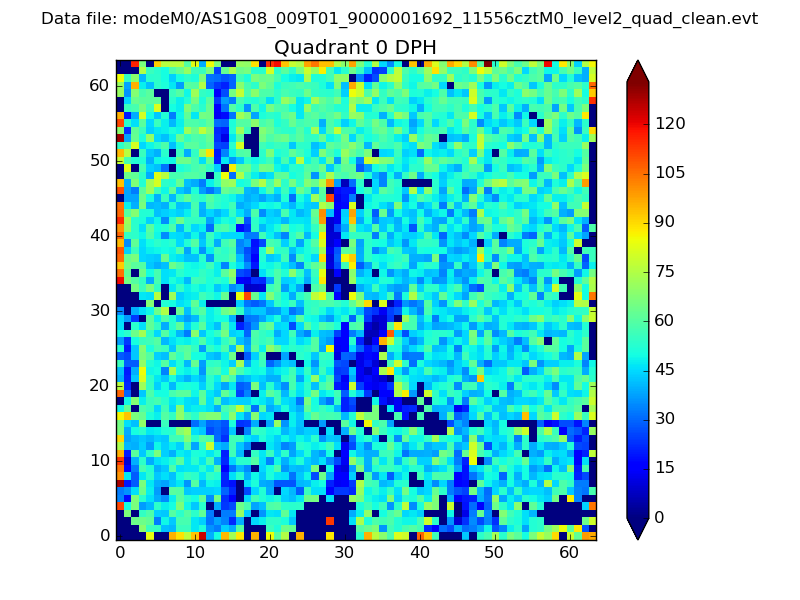 |
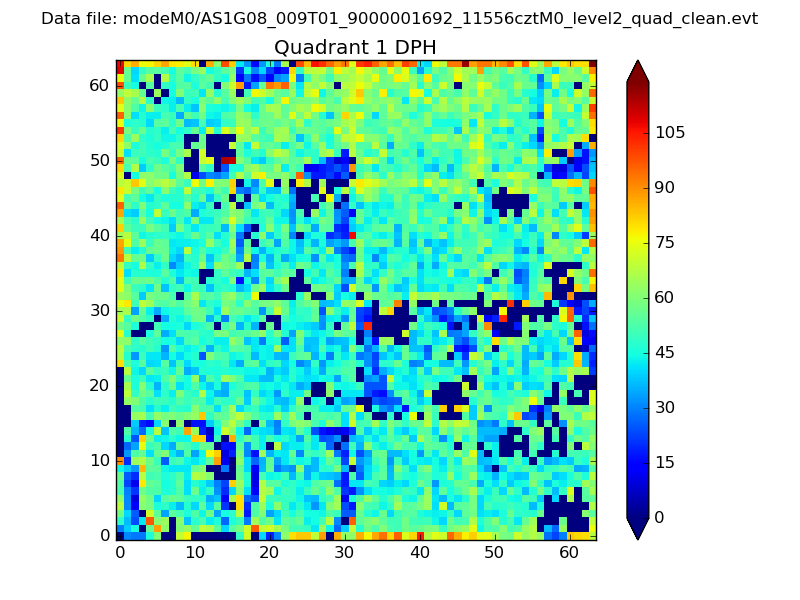 |
Quadrant B |
|---|---|---|---|
| Quadrant D | 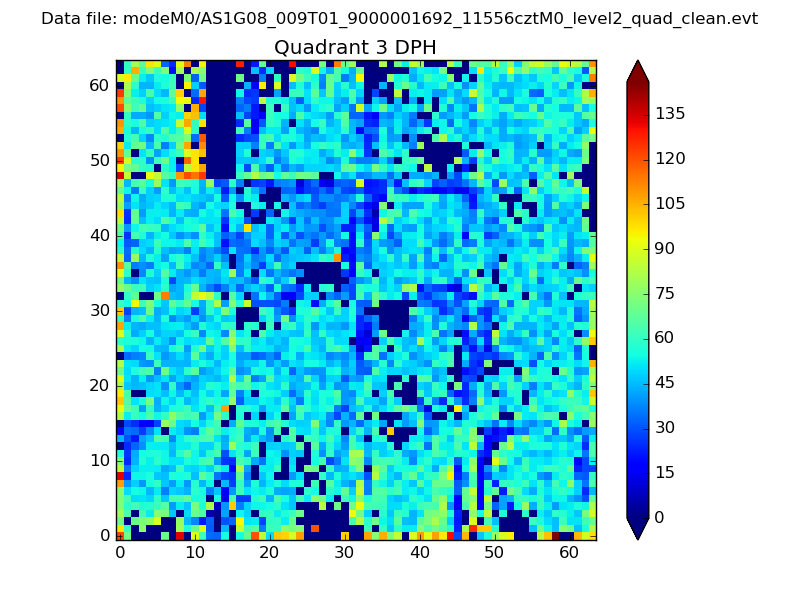 |
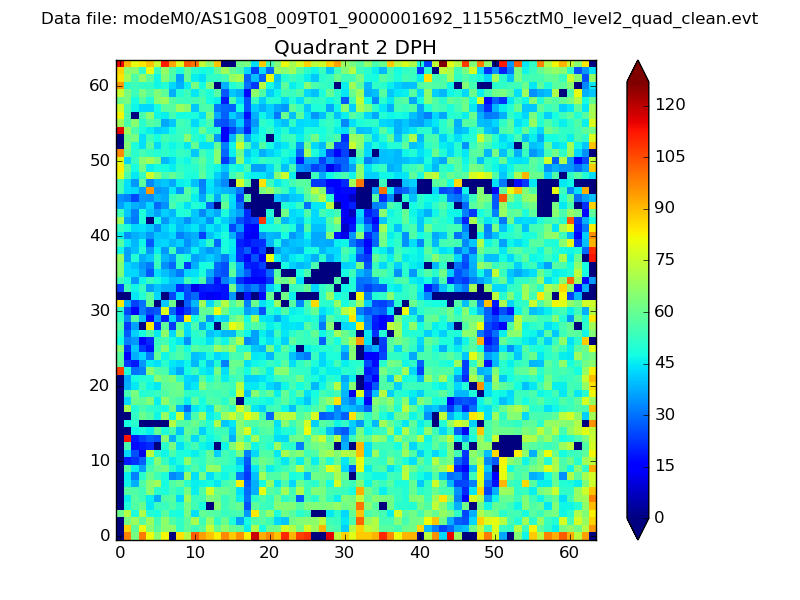 |
Quadrant C |
| Plot type | Count rate plots | Images |
|---|---|---|
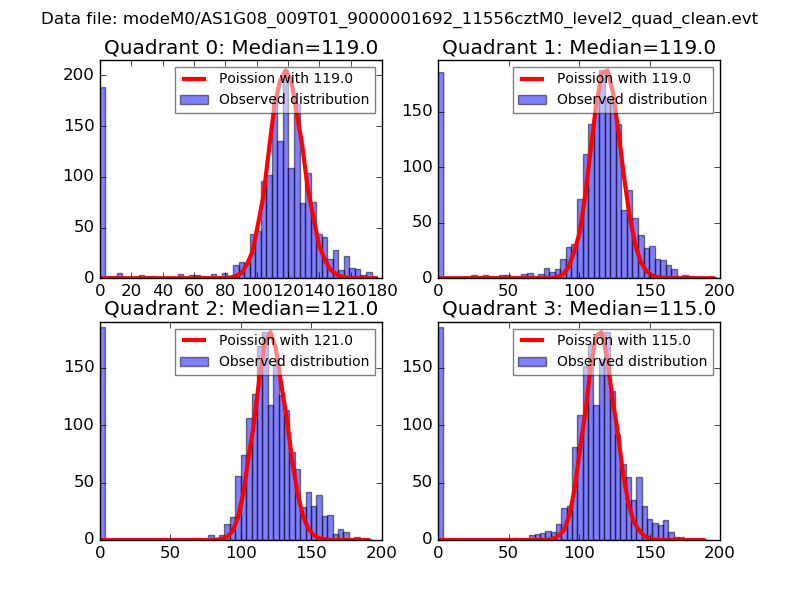
| Comparison with Poisson distribution Blue bars denote a histogram of data divided into 1 sec bins. Red curve is a Poisson curve with rate = median count rate of data. |
 |
 |
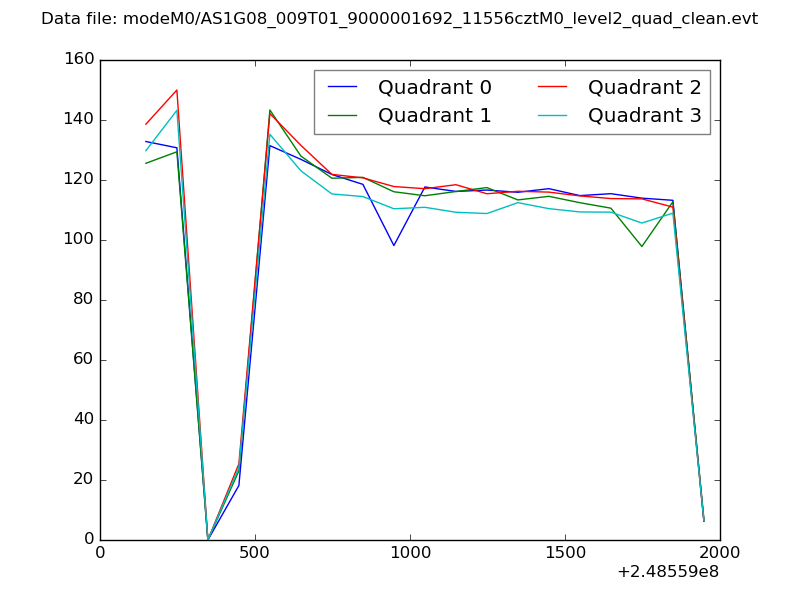
| Quadrant-wise count rates Data is divided into 100 sec bins |
 |
|
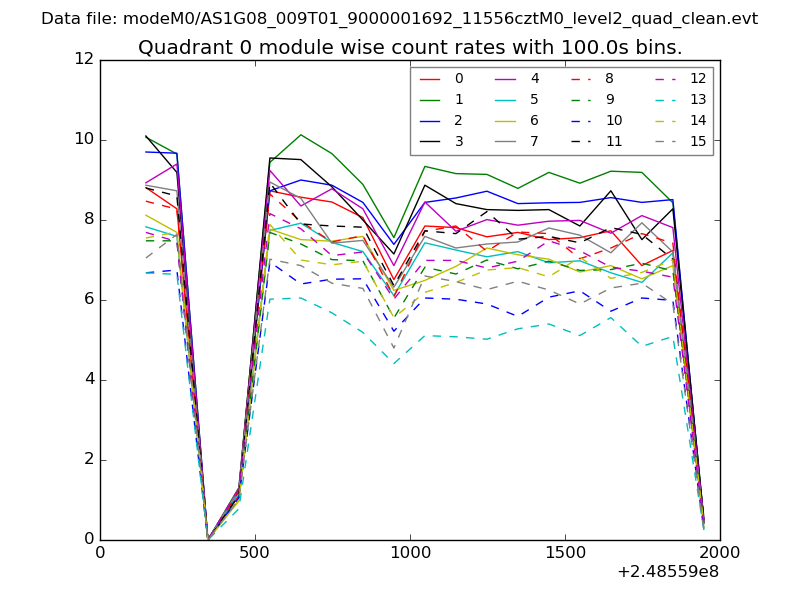
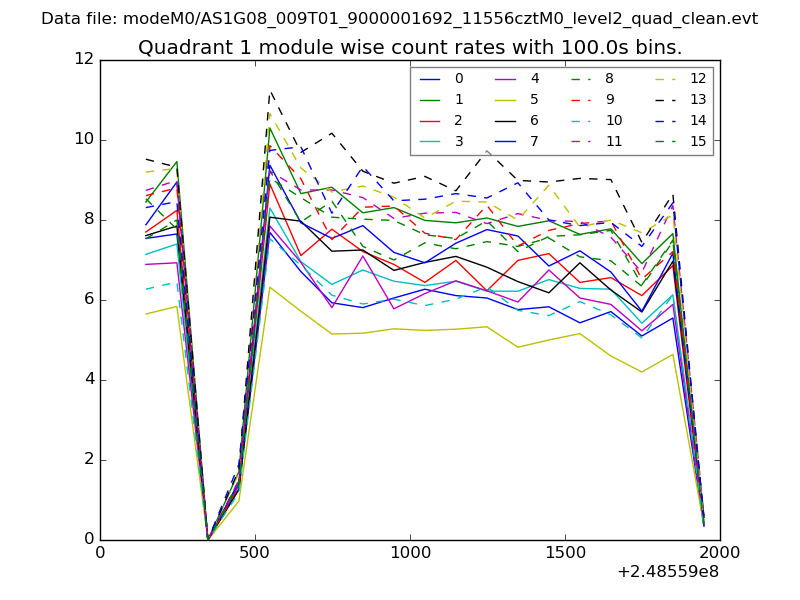
| Module-wise count rates for Quadrant A Data is divided into 100 sec bins |
 |
 |
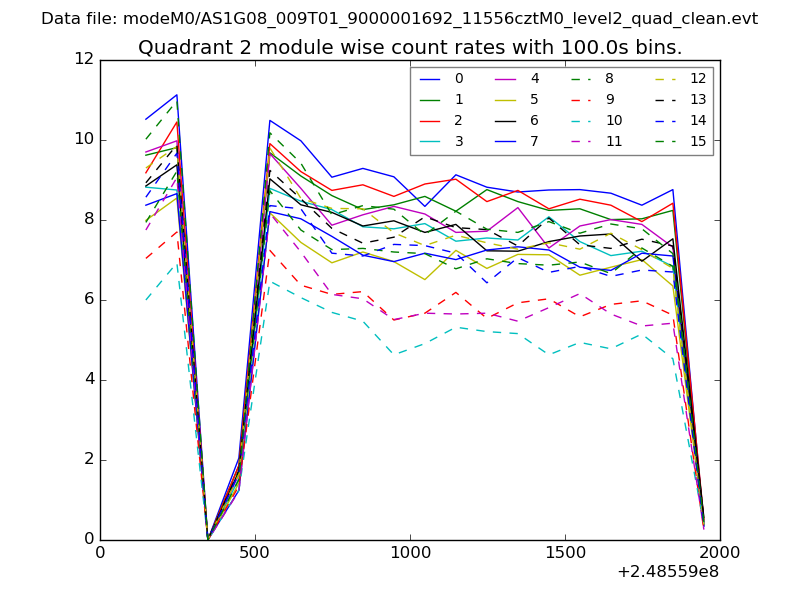
| Module-wise count rates for Quadrant B Data is divided into 100 sec bins |
 |
 |
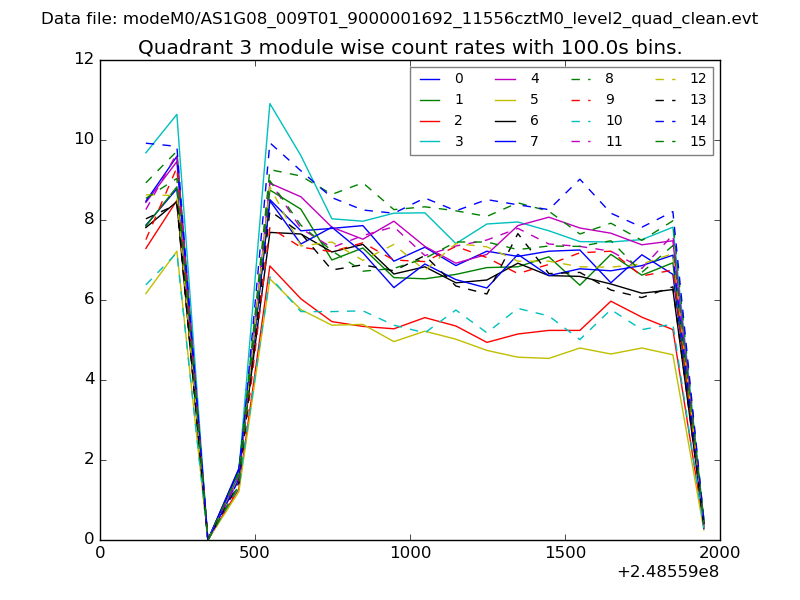
| Module-wise count rates for Quadrant C Data is divided into 100 sec bins |
 |
 |
| Module-wise count rates for Quadrant D Data is divided into 100 sec bins |
 |
 |
| Parameter | Plot |
|---|---|
| CZT HV Monitor | 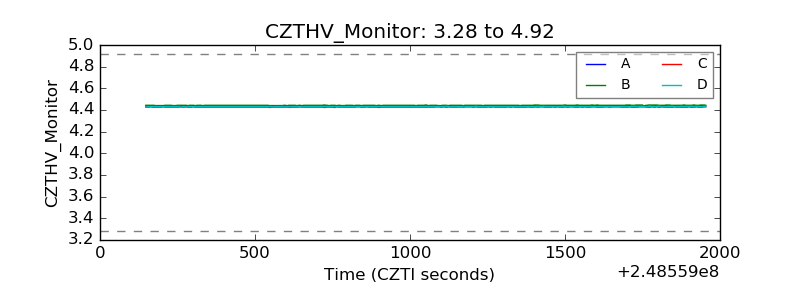 |
| D_VDD | 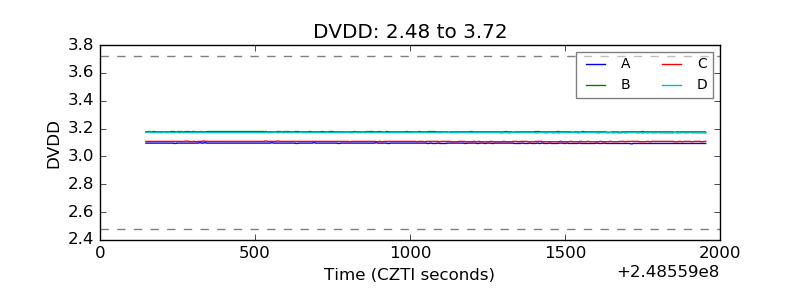 |
| Temperature 1 | 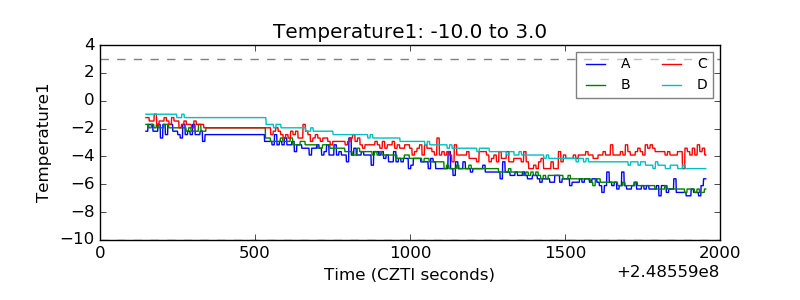 |
| Veto HV Monitor | 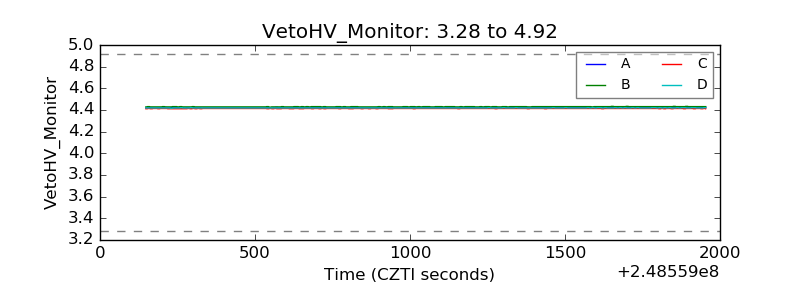 |
| Veto LLD | 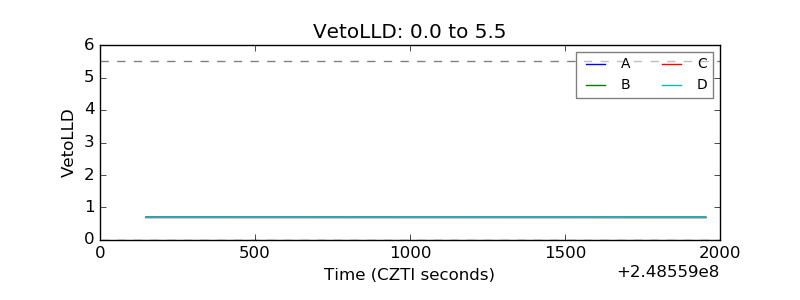 |
| Alpha Counter | 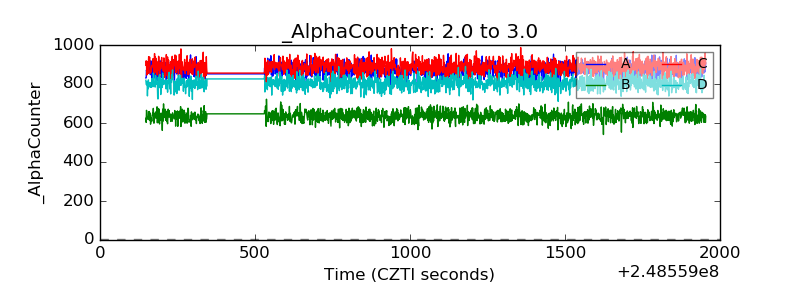 |
| _CPM_Rate | 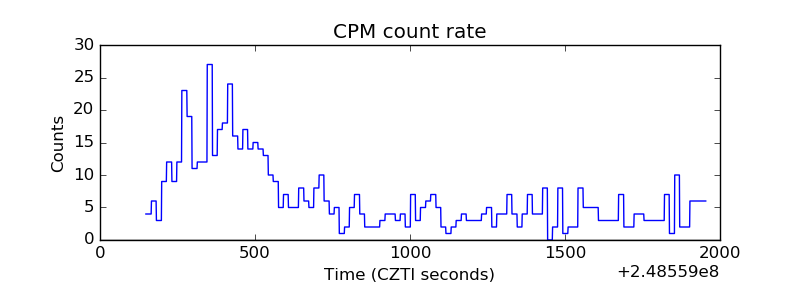 |
| CZT Counter | 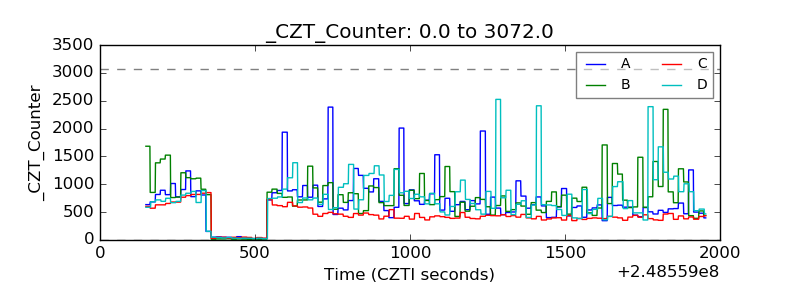 |
| +2.5 Volts monitor |  |
| +5 Volts monitor |  |
| _ROLL_ROT | 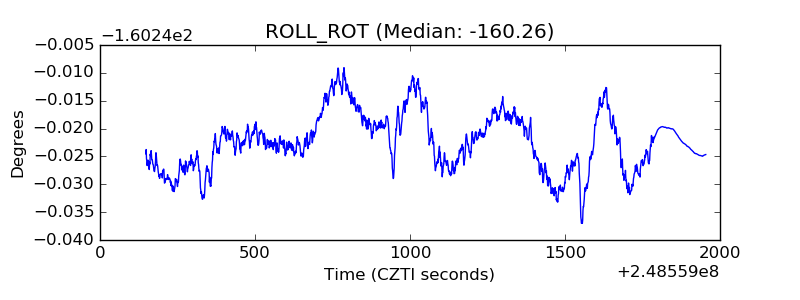 |
| _Roll_DEC | 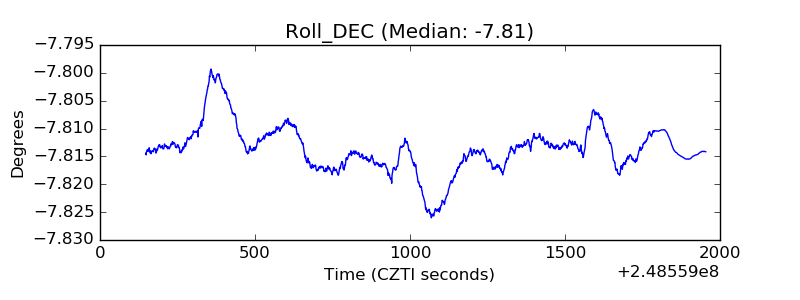 |
| _Roll_RA | 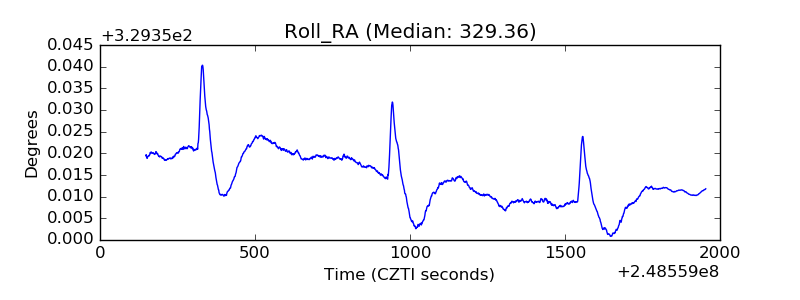 |
| Veto Counter | 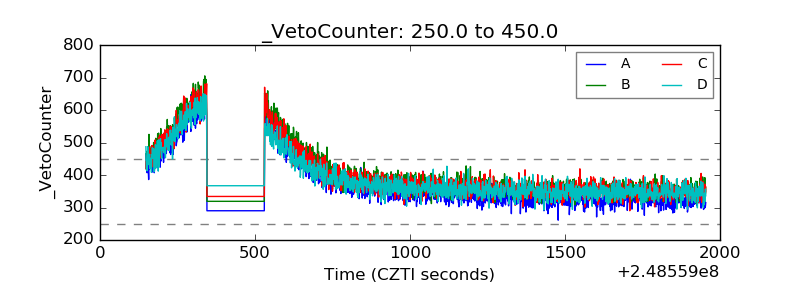 |