| Param | Original file | Final file |
|---|---|---|
| Filename | modeM0/AS1G08_009T01_9000001696cztM0_level2.fits | modeM0/AS1G08_009T01_9000001696cztM0_level2_quad_clean.evt |
| Size (bytes) | 658,117,440 | 637,899,840 |
| Size | 627.6 MB | 608.3 MB |
| Events in quadrant A | 3,897,022 | 3,693,604 |
| Events in quadrant B | 3,849,298 | 3,754,351 |
| Events in quadrant C | 3,990,528 | 3,766,636 |
| Events in quadrant D | 3,336,908 | 3,250,931 |
| Mode SS | |||
|---|---|---|---|
| Quadrant | BADHDUFLAG | Total packets | Discarded packets |
| A | 0 | 1442 | 0 |
| B | 0 | 1442 | 0 |
| C | 0 | 1442 | 0 |
| D | 0 | 1442 | 0 |
| Mode M9 | |||
|---|---|---|---|
| Quadrant | BADHDUFLAG | Total packets | Discarded packets |
| A | 0 | 106 | 0 |
| B | 0 | 106 | 0 |
| C | 0 | 106 | 0 |
| D | 0 | 106 | 0 |
| Mode M0 | |||
|---|---|---|---|
| Quadrant | BADHDUFLAG | Total packets | Discarded packets |
| A | 0 | 212295 | 0 |
| B | 0 | 188011 | 0 |
| C | 0 | 145311 | 0 |
| D | 0 | 206275 | 0 |
| Quadrant | Total seconds | Saturated seconds | Saturation percentage |
|---|---|---|---|
| A | 70757 | 5022 | 7.097531% |
| B | 70757 | 3503 | 4.950747% |
| C | 70757 | 454 | 0.641633% |
| D | 70757 | 4945 | 6.988708% |
Noise dominated data is calculated using 1-second bins in cleaned event files. If a bin has >2000 counts, and if more than 50% of those come from <1% of pixels, then it is considered to be noise-dominated and hence unusable.
| Quadrant | # 1 sec bins | Bins with >0 counts | Bins with >2000 counts | High rate bins dominated by noise | Noise dominated (total time) | Noise dominated (detector-on time) | Marked lightcurve |
|---|---|---|---|---|---|---|---|
| A | 81478 | 70456 | 0 | 0 | 0.00% | 0.00% |  |
| B | 81478 | 70756 | 0 | 0 | 0.00% | 0.00% |  |
| C | 81478 | 70759 | 0 | 0 | 0.00% | 0.00% |  |
| D | 81478 | 70719 | 0 | 0 | 0.00% | 0.00% |  |
Top three noisy pixels from each quadrant. If the there are fewer than three noisy pixels in the level2.evt file, extra rows are filled as -1
| Pixel properties | Quadrant properties | ||||||
|---|---|---|---|---|---|---|---|
| Quadrant | DetID | PixID | Counts | Sigma | Mean | Median | Sigma |
| A | 0 | 29 | 3764 | 11.01 | 1015 | 949 | 255.6 |
| A | 7 | 110 | 3233 | 8.93 | 1015 | 949 | 255.6 |
| A | 0 | 30 | 2865 | 7.49 | 1015 | 949 | 255.6 |
| B | 2 | 9 | 3325 | 11.82 | 1013 | 964 | 199.7 |
| B | 3 | 17 | 2552 | 7.95 | 1013 | 964 | 199.7 |
| B | 5 | 225 | 2544 | 7.91 | 1013 | 964 | 199.7 |
| C | 1 | 81 | 2908 | 7.05 | 1052 | 975 | 274.1 |
| C | 1 | 80 | 2865 | 6.9 | 1052 | 975 | 274.1 |
| C | 2 | 191 | 2737 | 6.43 | 1052 | 975 | 274.1 |
| D | 3 | 14 | 2452 | 6.2 | 954 | 866 | 255.8 |
| D | 7 | 3 | 2395 | 5.98 | 954 | 866 | 255.8 |
| D | 7 | 5 | 2394 | 5.97 | 954 | 866 | 255.8 |
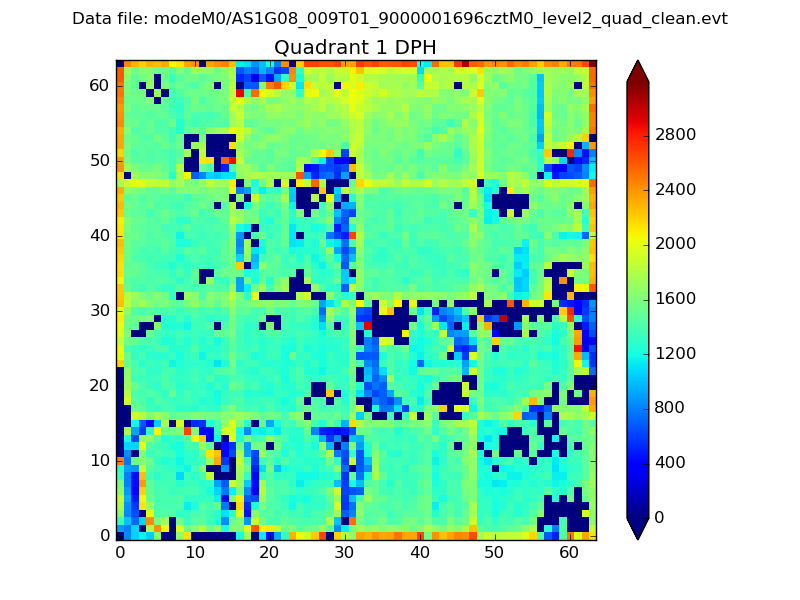
Histogram calculated using DETX and DETY for each event in the final _common_clean file
| Quadrant A |  |
 |
Quadrant B |
|---|---|---|---|
| Quadrant D | 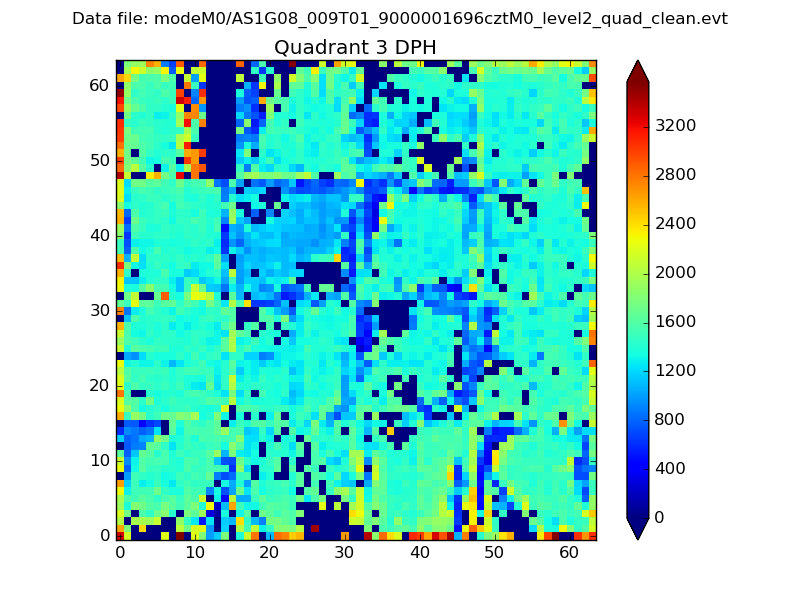 |
 |
Quadrant C |
| Plot type | Count rate plots | Images |
|---|---|---|
| Comparison with Poisson distribution Blue bars denote a histogram of data divided into 1 sec bins. Red curve is a Poisson curve with rate = median count rate of data. |
 |
 |
| Quadrant-wise count rates Data is divided into 100 sec bins |
 |
|
| Module-wise count rates for Quadrant A Data is divided into 100 sec bins |
 |
 |
| Module-wise count rates for Quadrant B Data is divided into 100 sec bins |
 |
 |
| Module-wise count rates for Quadrant C Data is divided into 100 sec bins |
 |
 |
| Module-wise count rates for Quadrant D Data is divided into 100 sec bins |
 |
 |
| Parameter | Plot |
|---|---|
| CZT HV Monitor |  |
| D_VDD |  |
| Temperature 1 | 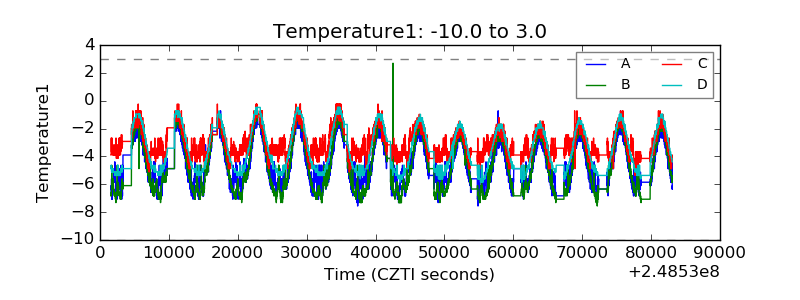 |
| Veto HV Monitor |  |
| Veto LLD | 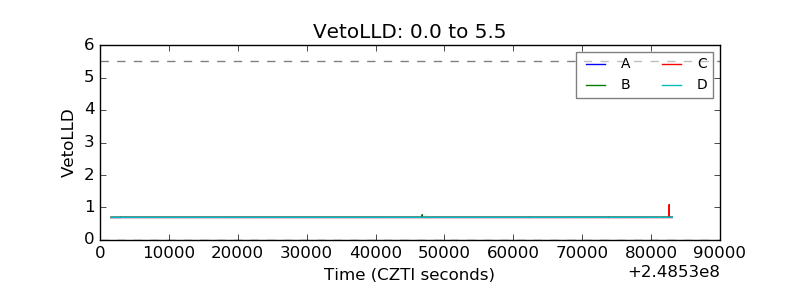 |
| Alpha Counter |  |
| _CPM_Rate |  |
| CZT Counter |  |
| +2.5 Volts monitor |  |
| +5 Volts monitor |  |
| _ROLL_ROT | 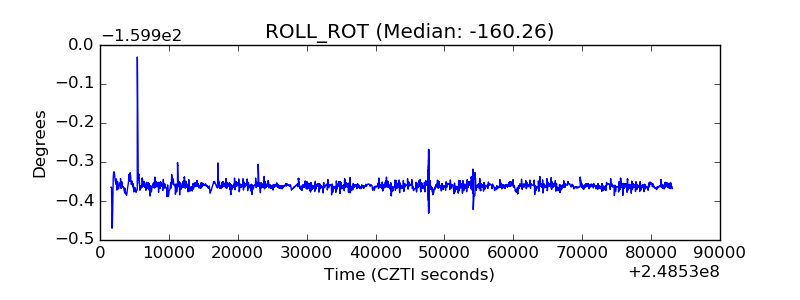 |
| _Roll_DEC |  |
| _Roll_RA |  |
| Veto Counter |  |