| Param | Original file | Final file |
|---|---|---|
| Filename | modeM0/AS1G08_009T01_9000001696_11551cztM0_level2.evt | modeM0/AS1G08_009T01_9000001696_11551cztM0_level2_quad_clean.evt |
| Size (bytes) | 267,137,280 | 60,027,840 |
| Size | 254.8 MB | 57.2 MB |
| Events in quadrant A | 2,324,012 | 399,793 |
| Events in quadrant B | 1,911,612 | 410,575 |
| Events in quadrant C | 1,520,077 | 404,960 |
| Events in quadrant D | 2,126,377 | 386,418 |
| Mode SS | |||
|---|---|---|---|
| Quadrant | BADHDUFLAG | Total packets | Discarded packets |
| A | 0 | 62 | 0 |
| B | 0 | 62 | 0 |
| C | 0 | 62 | 0 |
| D | 0 | 62 | 0 |
| Mode M9 | |||
|---|---|---|---|
| Quadrant | BADHDUFLAG | Total packets | Discarded packets |
| A | 0 | 12 | 0 |
| B | 0 | 12 | 0 |
| C | 0 | 12 | 0 |
| D | 0 | 12 | 0 |
| Mode M0 | |||
|---|---|---|---|
| Quadrant | BADHDUFLAG | Total packets | Discarded packets |
| A | 0 | 9047 | 2 |
| B | 0 | 7620 | 1 |
| C | 0 | 6433 | 1 |
| D | 0 | 8345 | 1 |
| Quadrant | Total seconds | Saturated seconds | Saturation percentage |
|---|---|---|---|
| A | 3047 | 207 | 6.793567% |
| B | 3047 | 159 | 5.218247% |
| C | 3047 | 42 | 1.378405% |
| D | 3047 | 120 | 3.938300% |
Noise dominated data is calculated using 1-second bins in cleaned event files. If a bin has >2000 counts, and if more than 50% of those come from <1% of pixels, then it is considered to be noise-dominated and hence unusable.
| Quadrant | # 1 sec bins | Bins with >0 counts | Bins with >2000 counts | High rate bins dominated by noise | Noise dominated (total time) | Noise dominated (detector-on time) | Marked lightcurve |
|---|---|---|---|---|---|---|---|
| A | 4283 | 3049 | 50 | 50 | 1.17% | 1.64% | 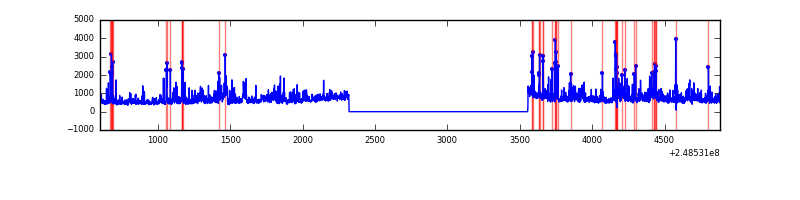 |
| B | 4283 | 3049 | 32 | 32 | 0.75% | 1.05% | 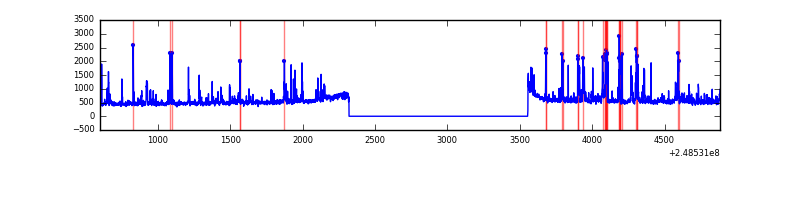 |
| C | 4283 | 3049 | 0 | 0 | 0.00% | 0.00% | 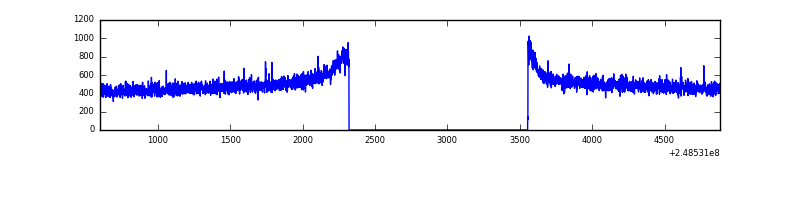 |
| D | 4283 | 3049 | 52 | 52 | 1.21% | 1.71% | 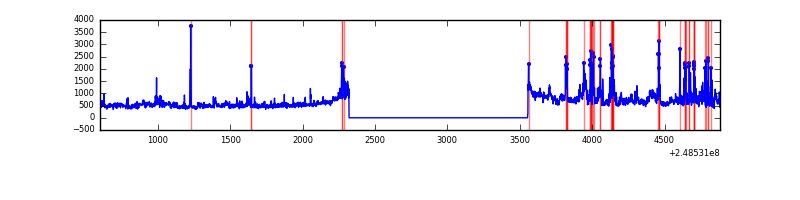 |
Top three noisy pixels from each quadrant. If the there are fewer than three noisy pixels in the level2.evt file, extra rows are filled as -1
| Pixel properties | Quadrant properties | ||||||
|---|---|---|---|---|---|---|---|
| Quadrant | DetID | PixID | Counts | Sigma | Mean | Median | Sigma |
| A | 8 | 5 | 615056 | 7506.02 | 396 | 387 | 81.9 |
| A | 1 | 162 | 67581 | 820.54 | 396 | 387 | 81.9 |
| A | 1 | 178 | 38979 | 471.27 | 396 | 387 | 81.9 |
| B | 4 | 239 | 275965 | 3512.84 | 398 | 389 | 78.4 |
| B | 11 | 51 | 29849 | 375.53 | 398 | 389 | 78.4 |
| B | 15 | 204 | 21856 | 273.65 | 398 | 389 | 78.4 |
| C | 13 | 61 | 2887 | 27.31 | 389 | 392 | 91.4 |
| C | 12 | 4 | 1771 | 15.09 | 389 | 392 | 91.4 |
| C | 13 | 250 | 1013 | 6.8 | 389 | 392 | 91.4 |
| D | 1 | 52 | 570277 | 6056.99 | 385 | 374 | 94.1 |
| D | 13 | 137 | 31762 | 333.59 | 385 | 374 | 94.1 |
| D | 2 | 120 | 22329 | 233.34 | 385 | 374 | 94.1 |
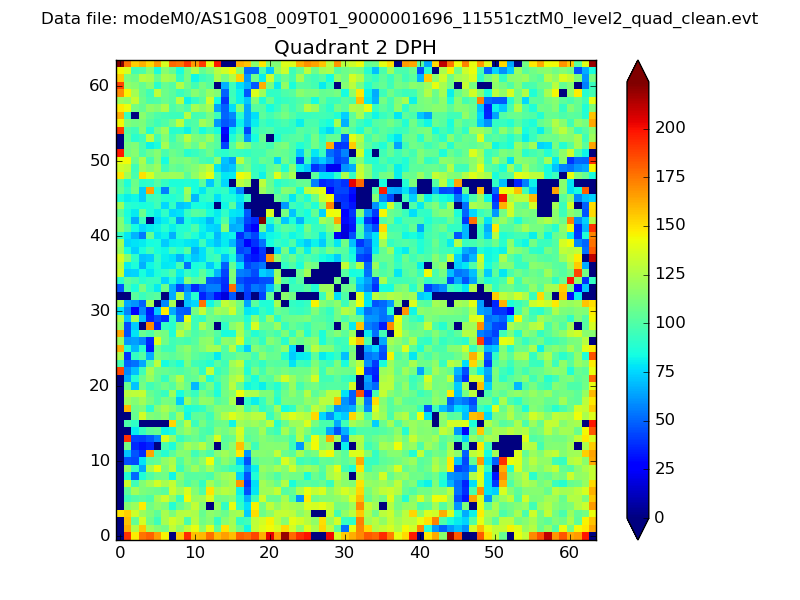
Histogram calculated using DETX and DETY for each event in the final _common_clean file
| Quadrant A | 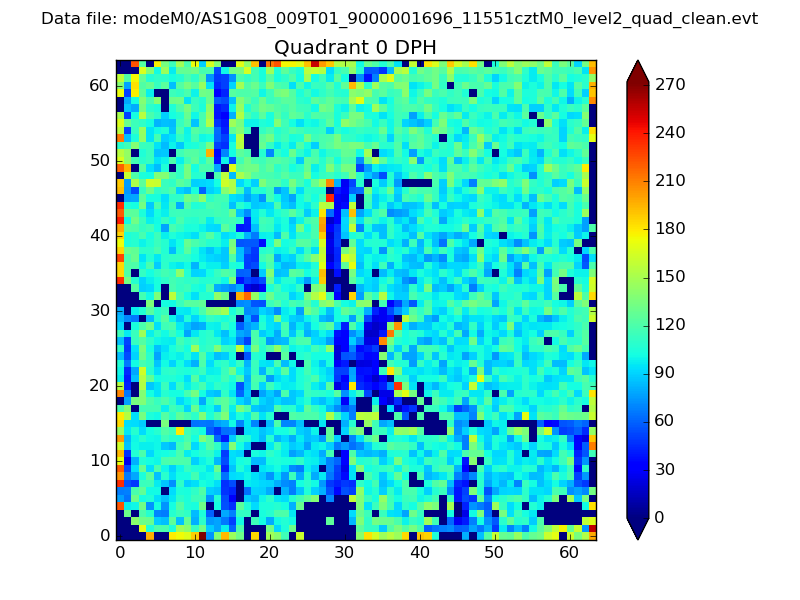 |
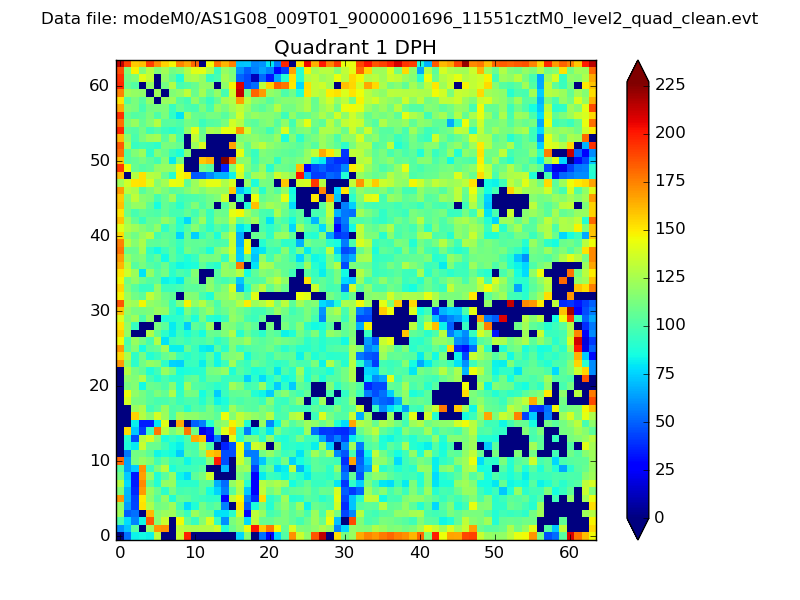 |
Quadrant B |
|---|---|---|---|
| Quadrant D | 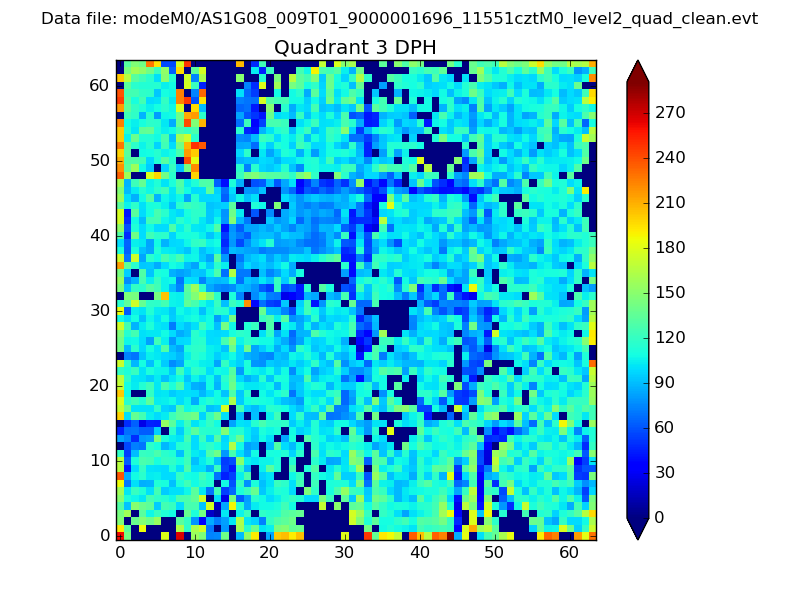 |
 |
Quadrant C |
| Plot type | Count rate plots | Images |
|---|---|---|
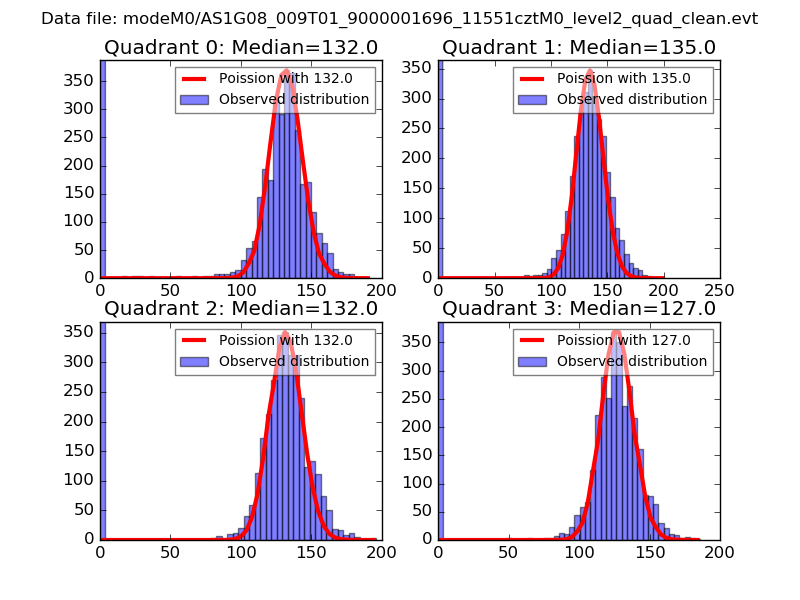
| Comparison with Poisson distribution Blue bars denote a histogram of data divided into 1 sec bins. Red curve is a Poisson curve with rate = median count rate of data. |
 |
 |
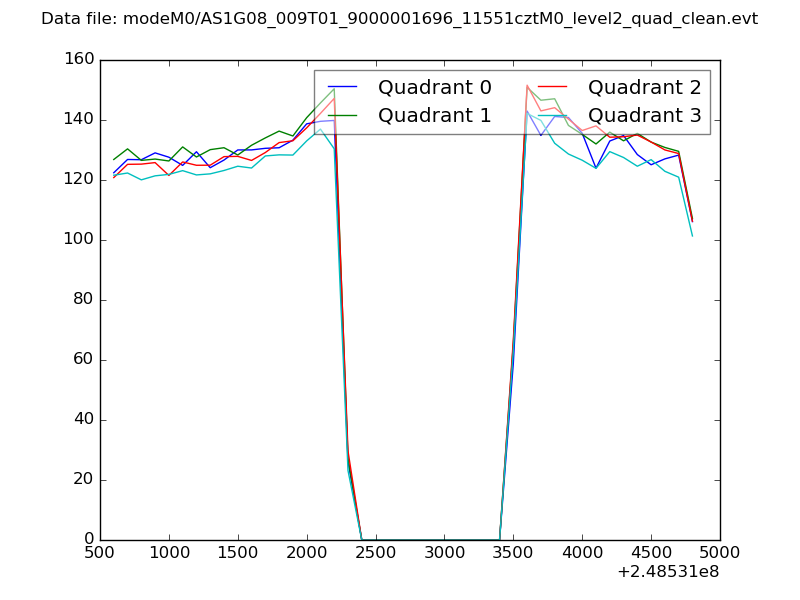
| Quadrant-wise count rates Data is divided into 100 sec bins |
 |
|
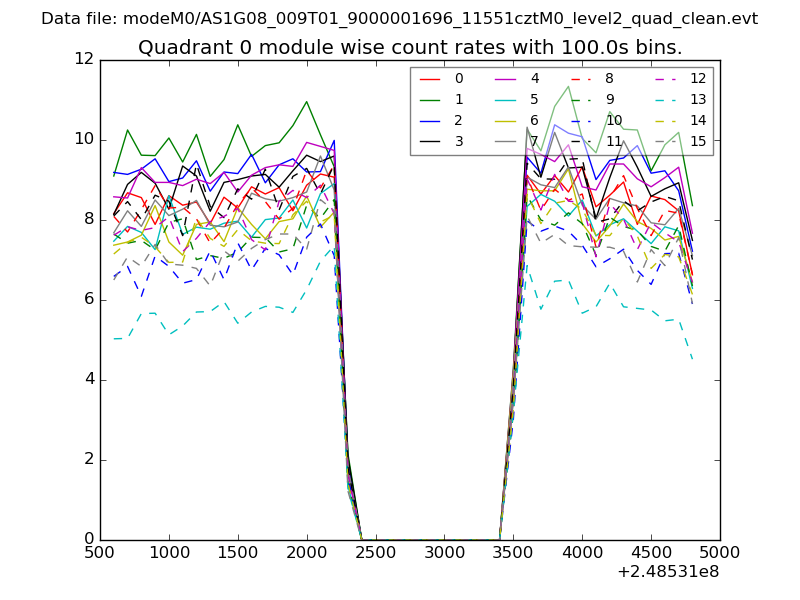
| Module-wise count rates for Quadrant A Data is divided into 100 sec bins |
 |
 |
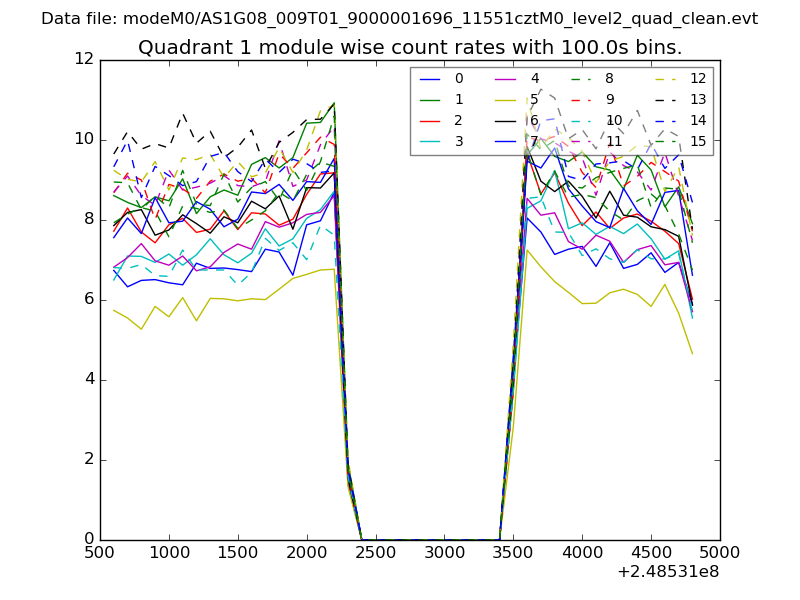
| Module-wise count rates for Quadrant B Data is divided into 100 sec bins |
 |
 |
| Module-wise count rates for Quadrant C Data is divided into 100 sec bins |
 |
 |
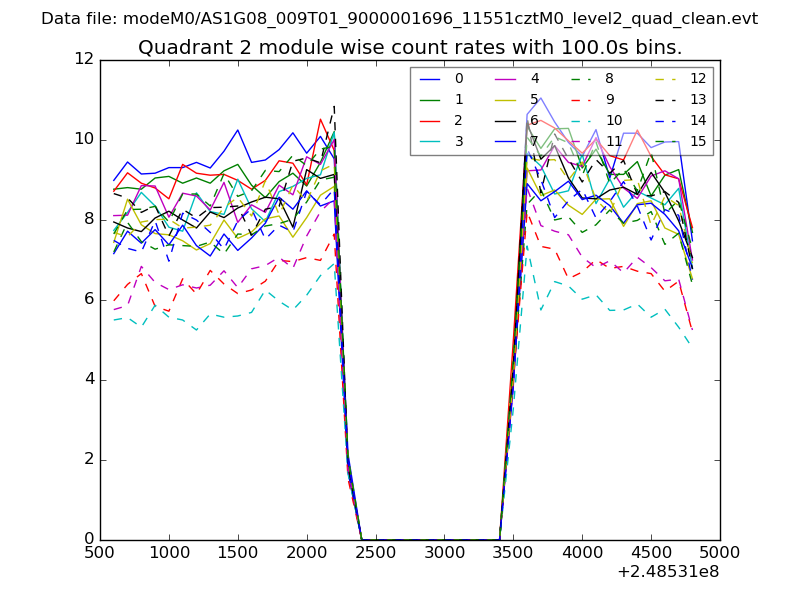
| Module-wise count rates for Quadrant D Data is divided into 100 sec bins |
 |
 |
| Parameter | Plot |
|---|---|
| CZT HV Monitor | 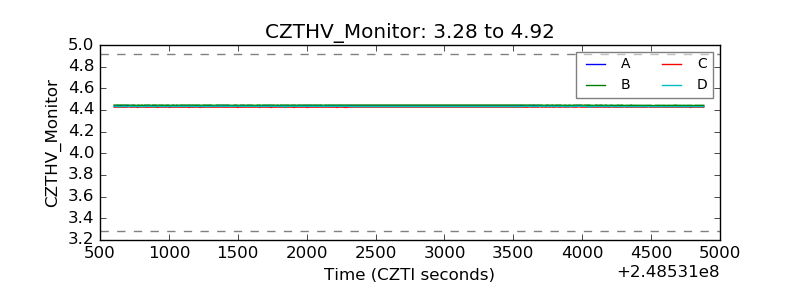 |
| D_VDD | 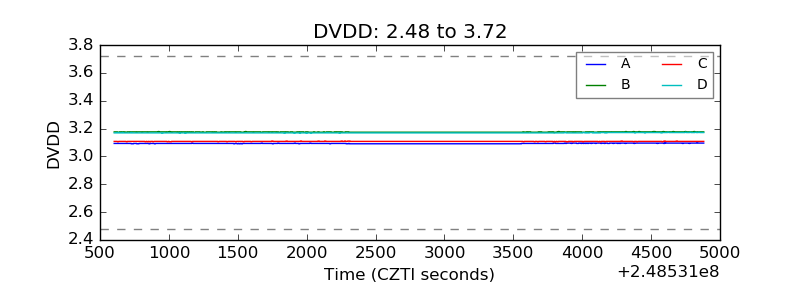 |
| Temperature 1 |  |
| Veto HV Monitor | 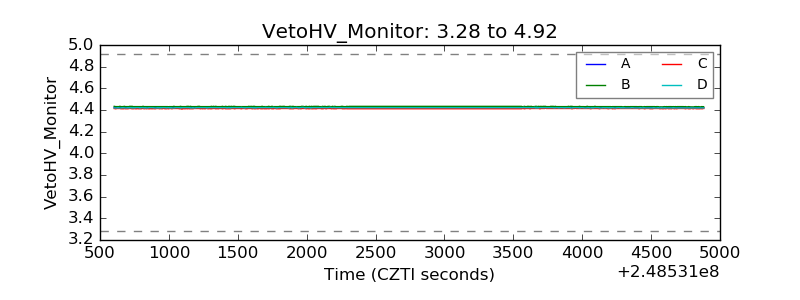 |
| Veto LLD |  |
| Alpha Counter | 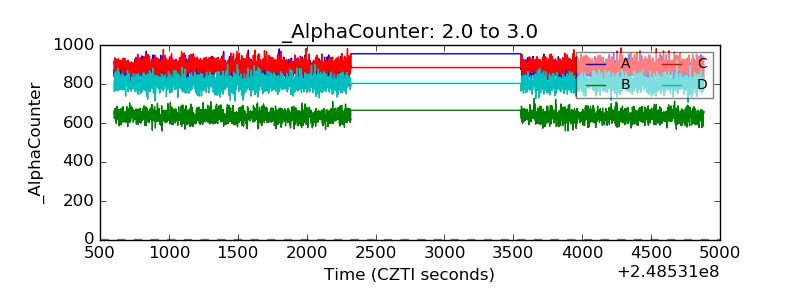 |
| _CPM_Rate | 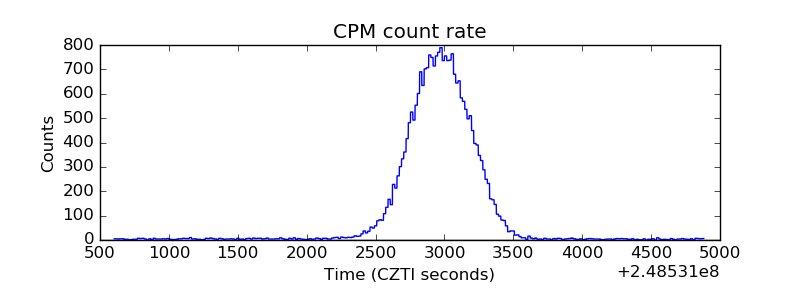 |
| CZT Counter | 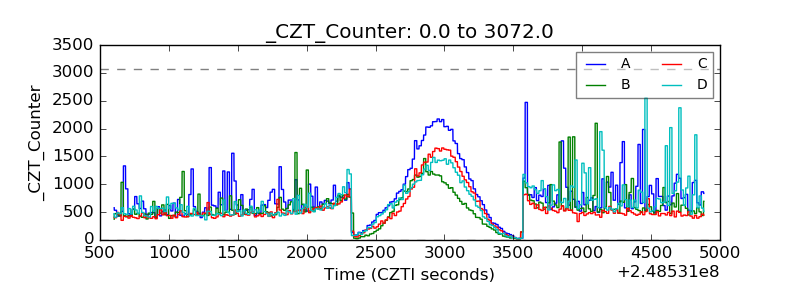 |
| +2.5 Volts monitor |  |
| +5 Volts monitor | 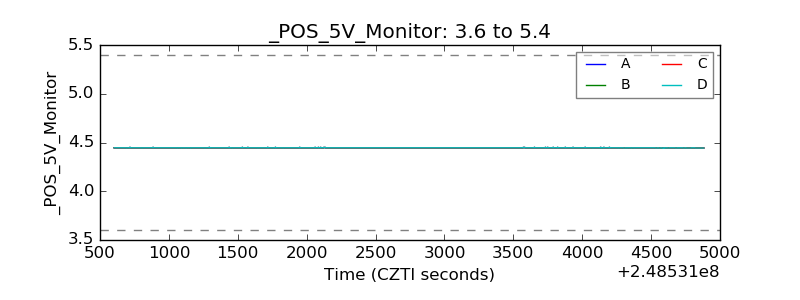 |
| _ROLL_ROT | 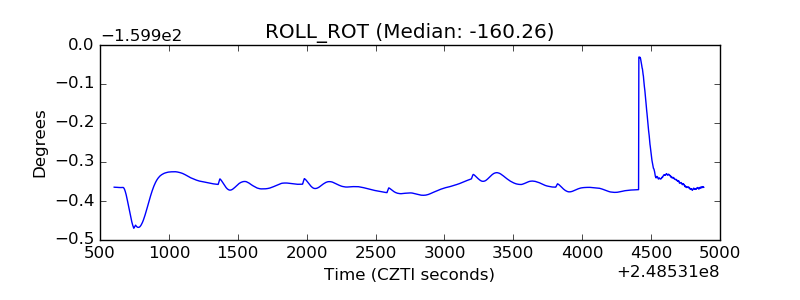 |
| _Roll_DEC | 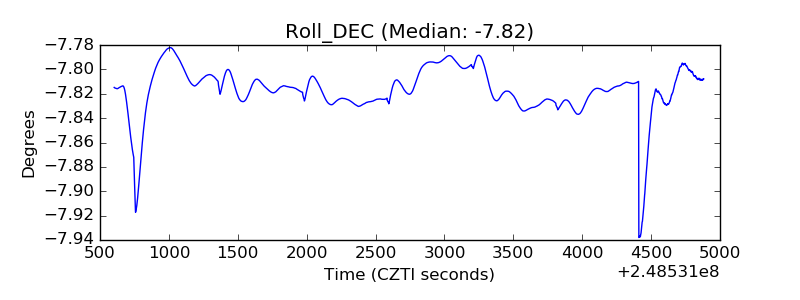 |
| _Roll_RA | 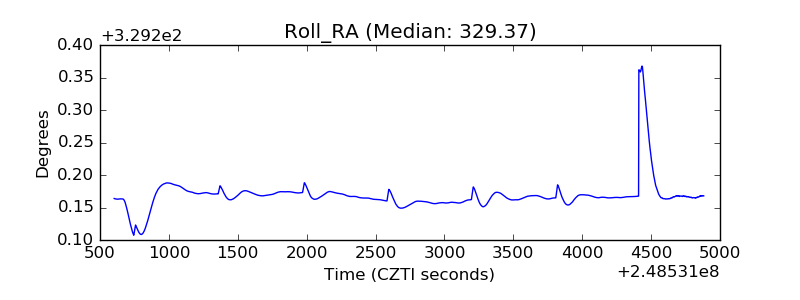 |
| Veto Counter | 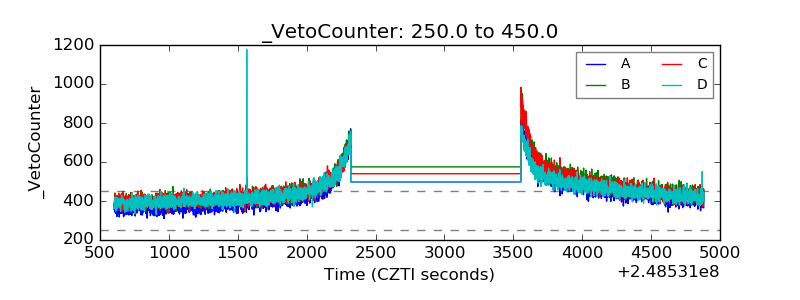 |