| Param | Original file | Final file |
|---|---|---|
| Filename | modeM0/AS1G08_009T01_9000001696_11554cztM0_level2.evt | modeM0/AS1G08_009T01_9000001696_11554cztM0_level2_quad_clean.evt |
| Size (bytes) | 712,820,160 | 95,189,760 |
| Size | 679.8 MB | 90.8 MB |
| Events in quadrant A | 5,246,892 | 603,584 |
| Events in quadrant B | 4,955,074 | 610,252 |
| Events in quadrant C | 3,274,286 | 619,133 |
| Events in quadrant D | 7,617,276 | 539,881 |
| Mode SS | |||
|---|---|---|---|
| Quadrant | BADHDUFLAG | Total packets | Discarded packets |
| A | 0 | 150 | 0 |
| B | 0 | 150 | 0 |
| C | 0 | 150 | 0 |
| D | 0 | 150 | 0 |
| Mode M9 | |||
|---|---|---|---|
| Quadrant | BADHDUFLAG | Total packets | Discarded packets |
| A | 0 | 7 | 0 |
| B | 0 | 7 | 0 |
| C | 0 | 7 | 0 |
| D | 0 | 8 | 0 |
| Mode M0 | |||
|---|---|---|---|
| Quadrant | BADHDUFLAG | Total packets | Discarded packets |
| A | 0 | 20604 | 4 |
| B | 0 | 19619 | 3 |
| C | 0 | 14974 | 3 |
| D | 0 | 27692 | 3 |
| Quadrant | Total seconds | Saturated seconds | Saturation percentage |
|---|---|---|---|
| A | 7304 | 339 | 4.641292% |
| B | 7304 | 386 | 5.284775% |
| C | 7304 | 16 | 0.219058% |
| D | 7304 | 1281 | 17.538335% |
Noise dominated data is calculated using 1-second bins in cleaned event files. If a bin has >2000 counts, and if more than 50% of those come from <1% of pixels, then it is considered to be noise-dominated and hence unusable.
| Quadrant | # 1 sec bins | Bins with >0 counts | Bins with >2000 counts | High rate bins dominated by noise | Noise dominated (total time) | Noise dominated (detector-on time) | Marked lightcurve |
|---|---|---|---|---|---|---|---|
| A | 7670 | 7307 | 135 | 135 | 1.76% | 1.85% | 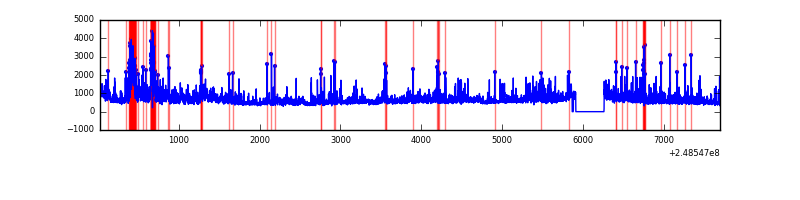 |
| B | 7670 | 7307 | 214 | 214 | 2.79% | 2.93% | 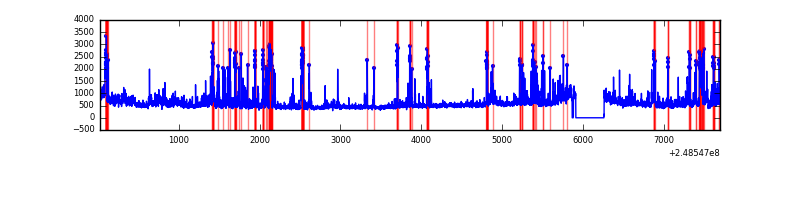 |
| C | 7670 | 7307 | 0 | 0 | 0.00% | 0.00% | 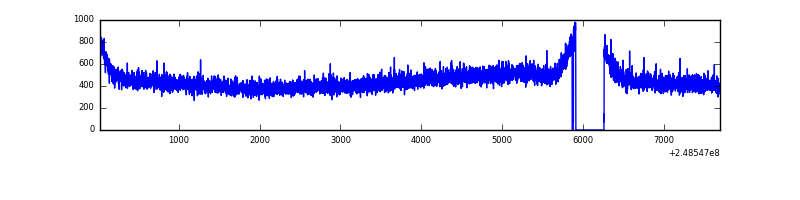 |
| D | 7670 | 7307 | 860 | 860 | 11.21% | 11.77% | 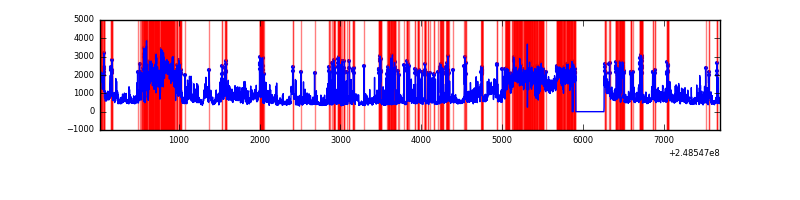 |
Top three noisy pixels from each quadrant. If the there are fewer than three noisy pixels in the level2.evt file, extra rows are filled as -1
| Pixel properties | Quadrant properties | ||||||
|---|---|---|---|---|---|---|---|
| Quadrant | DetID | PixID | Counts | Sigma | Mean | Median | Sigma |
| A | 8 | 5 | 1568233 | 8865.36 | 858 | 841 | 176.8 |
| A | 1 | 162 | 105768 | 593.48 | 858 | 841 | 176.8 |
| A | 1 | 178 | 64455 | 359.81 | 858 | 841 | 176.8 |
| B | 4 | 239 | 912334 | 5533.39 | 857 | 835 | 164.7 |
| B | 15 | 204 | 346609 | 2099.07 | 857 | 835 | 164.7 |
| B | 11 | 51 | 190013 | 1148.43 | 857 | 835 | 164.7 |
| C | 13 | 61 | 6096 | 26.72 | 840 | 843 | 196.6 |
| C | 3 | 202 | 2023 | 6.0 | 840 | 843 | 196.6 |
| C | -1 | -1 | -1 | -1.0 | 840 | 843 | 196.6 |
| D | 13 | 137 | 2462455 | 12920.36 | 784 | 761 | 190.5 |
| D | 1 | 52 | 1908631 | 10013.58 | 784 | 761 | 190.5 |
| D | 2 | 120 | 148608 | 775.98 | 784 | 761 | 190.5 |
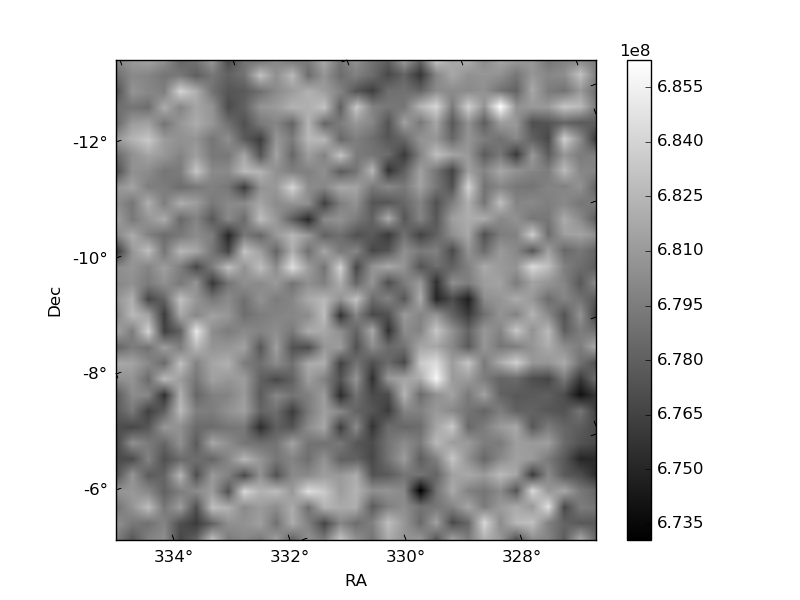
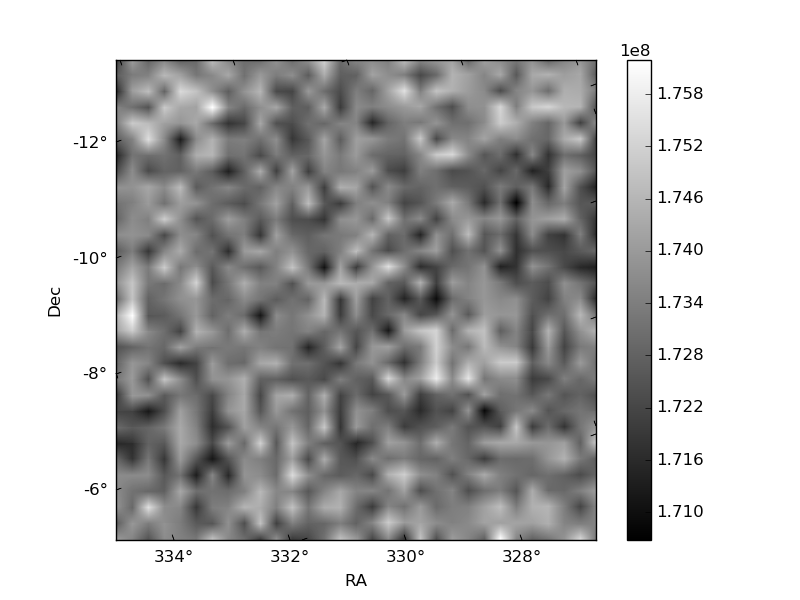
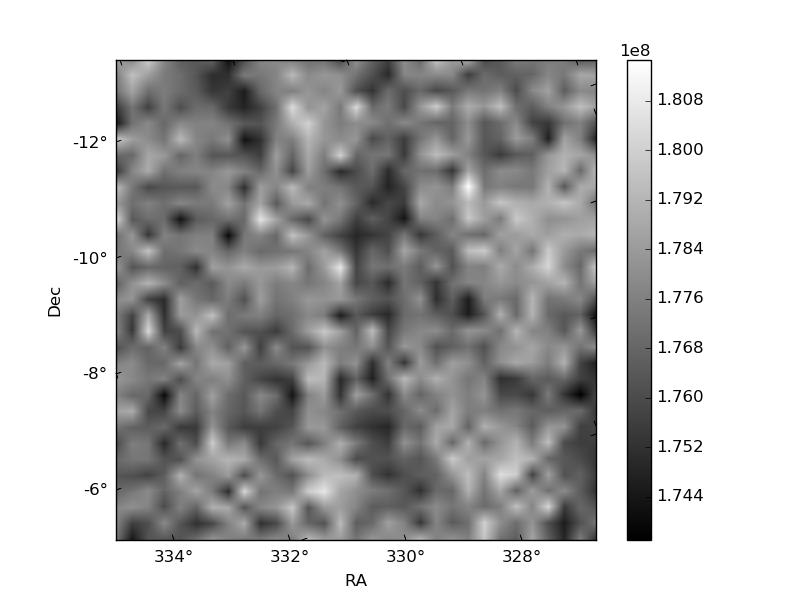
Histogram calculated using DETX and DETY for each event in the final _common_clean file
| Quadrant A | 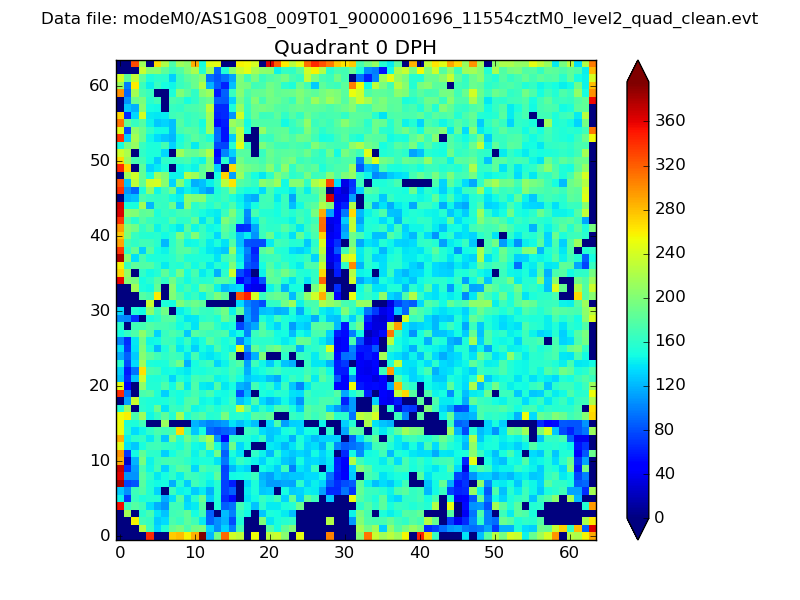 |
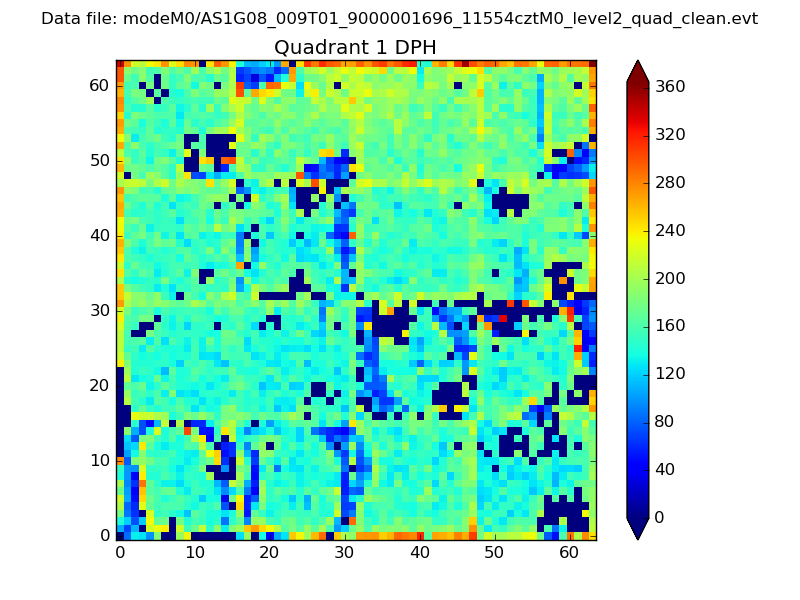 |
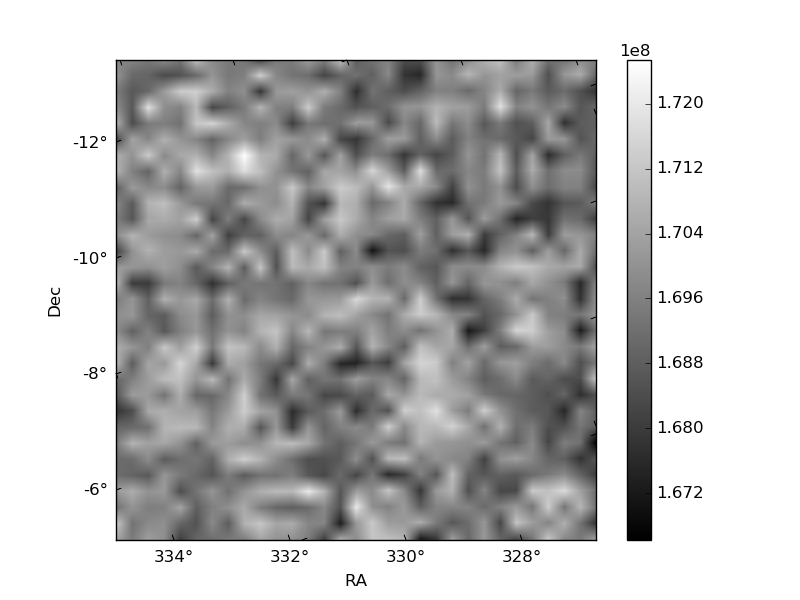
Quadrant B |
|---|---|---|---|
| Quadrant D | 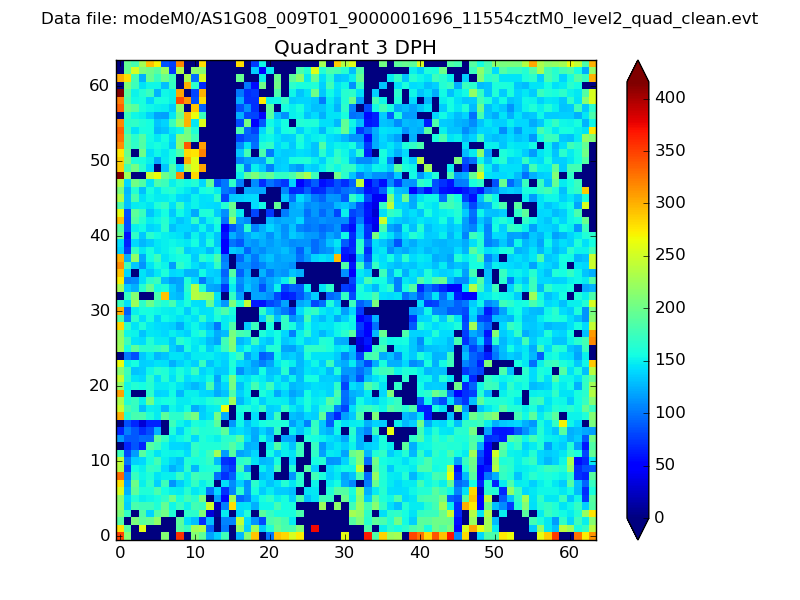 |
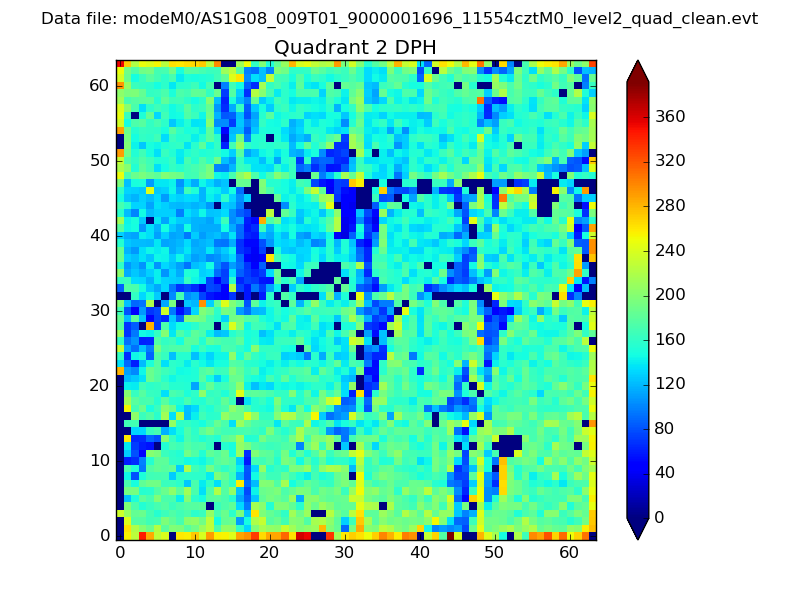 |
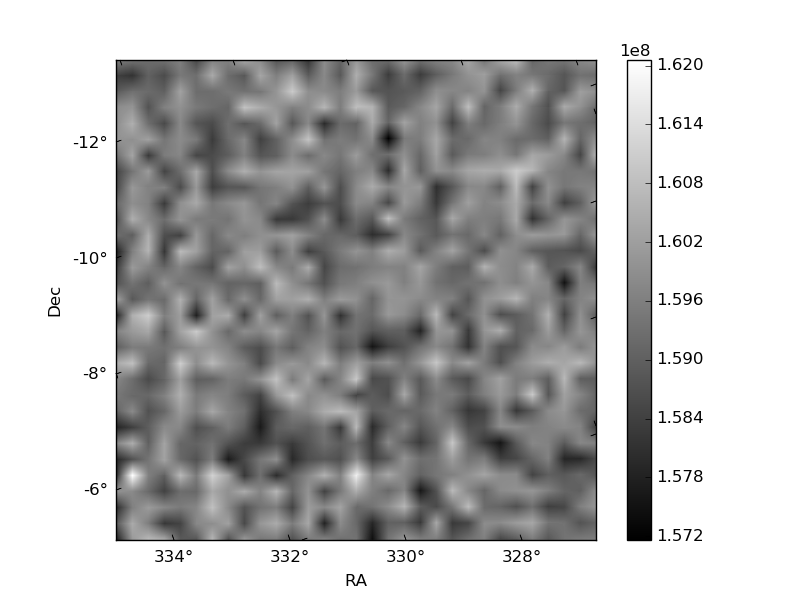
Quadrant C |
| Plot type | Count rate plots | Images |
|---|---|---|
| Comparison with Poisson distribution Blue bars denote a histogram of data divided into 1 sec bins. Red curve is a Poisson curve with rate = median count rate of data. |
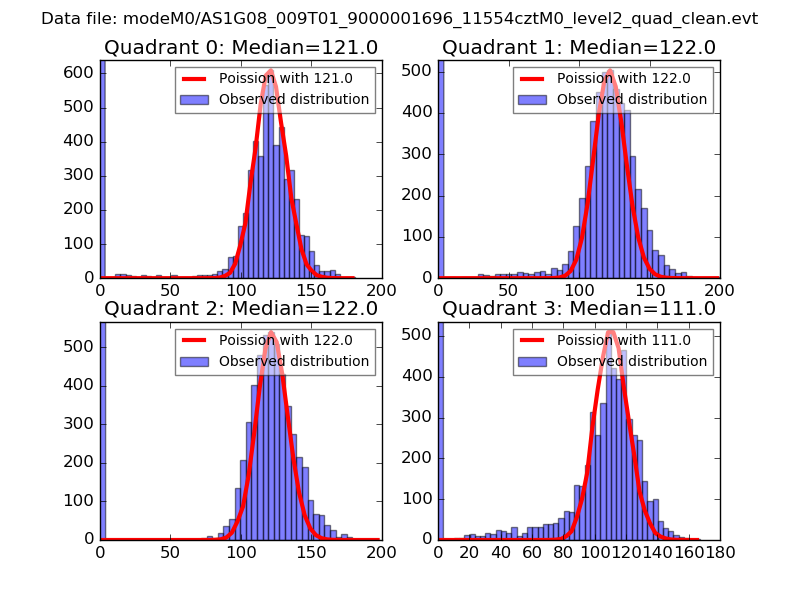 |
 |
| Quadrant-wise count rates Data is divided into 100 sec bins |
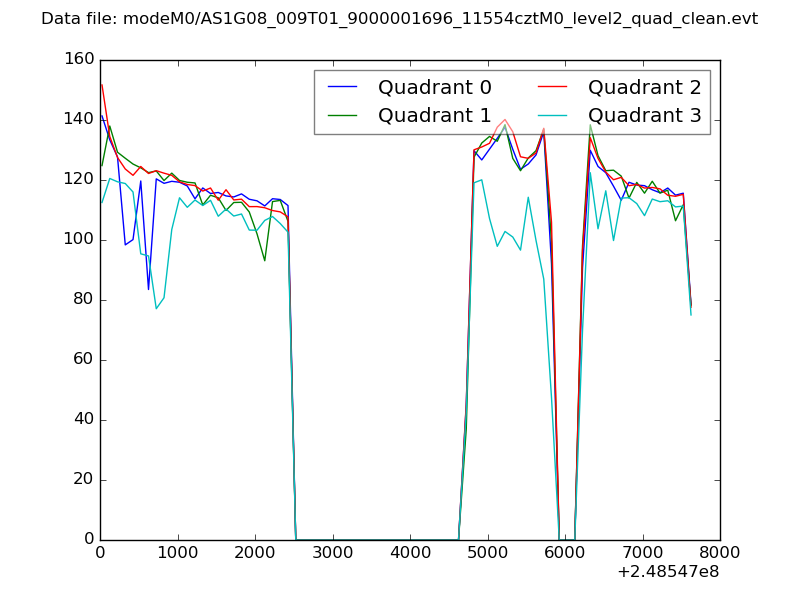 |
|
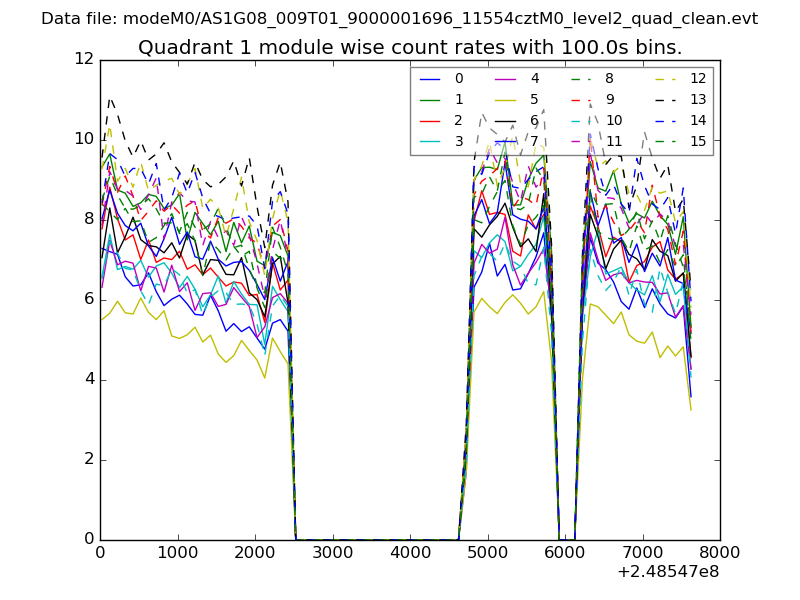
| Module-wise count rates for Quadrant A Data is divided into 100 sec bins |
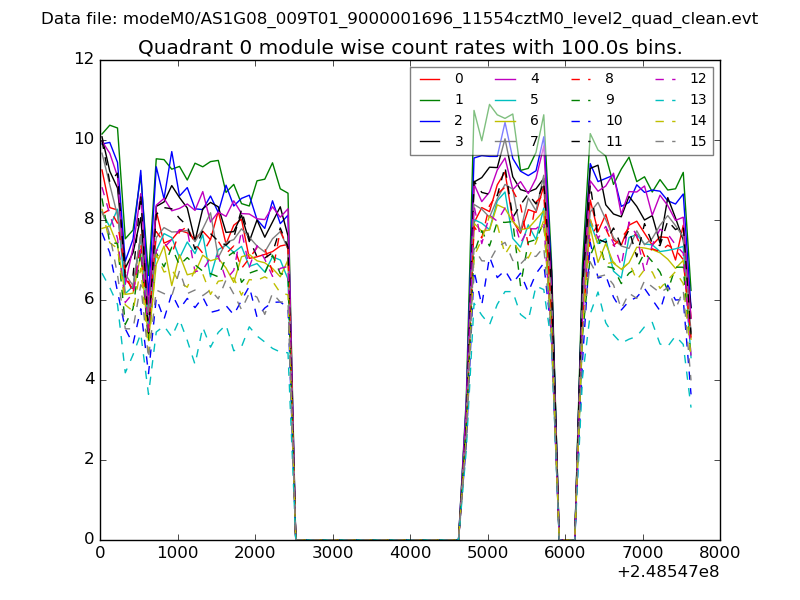 |
 |
| Module-wise count rates for Quadrant B Data is divided into 100 sec bins |
 |
 |
| Module-wise count rates for Quadrant C Data is divided into 100 sec bins |
 |
 |
| Module-wise count rates for Quadrant D Data is divided into 100 sec bins |
 |
 |
| Parameter | Plot |
|---|---|
| CZT HV Monitor | 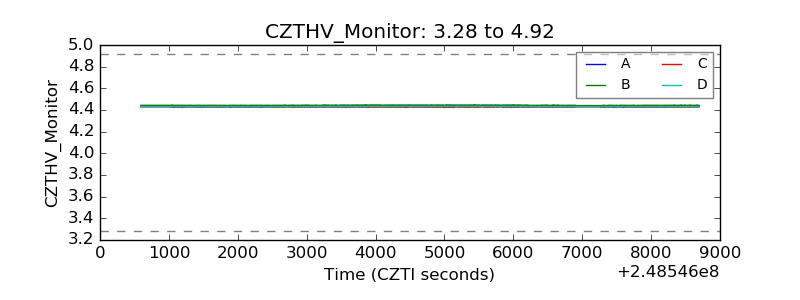 |
| D_VDD | 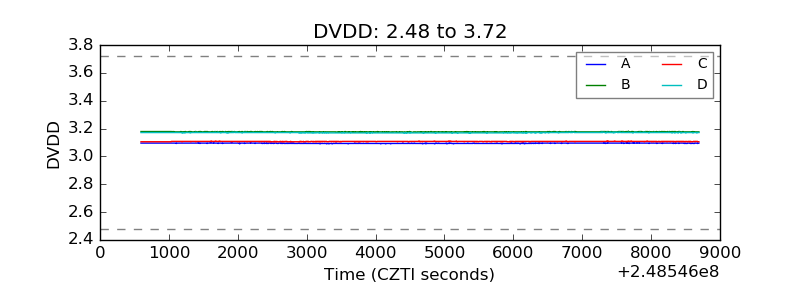 |
| Temperature 1 | 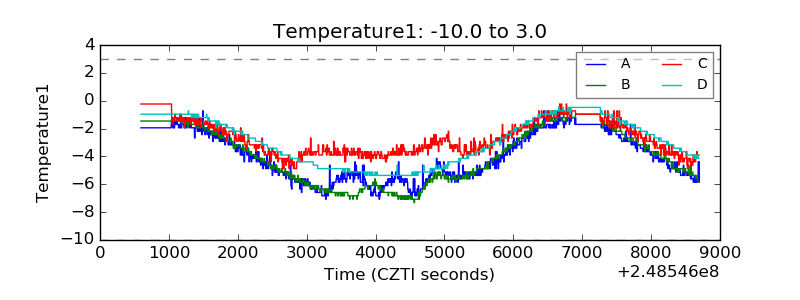 |
| Veto HV Monitor | 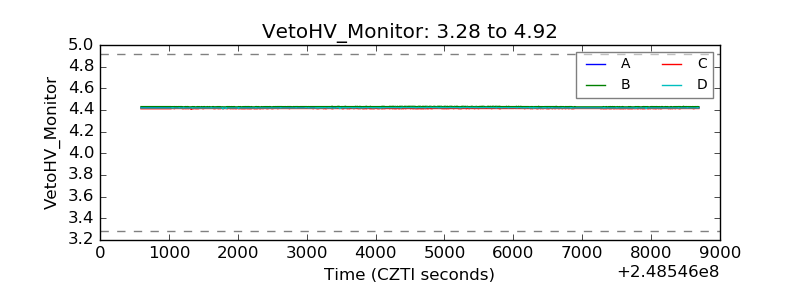 |
| Veto LLD | 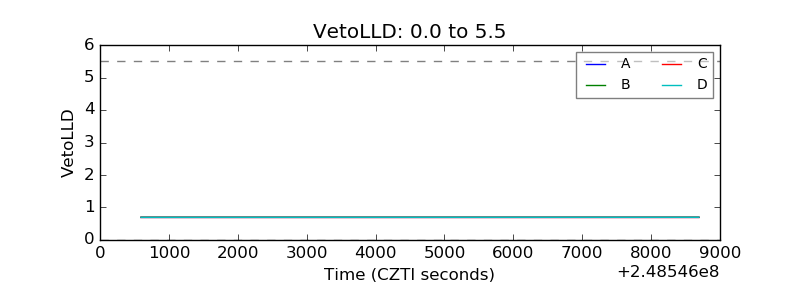 |
| Alpha Counter | 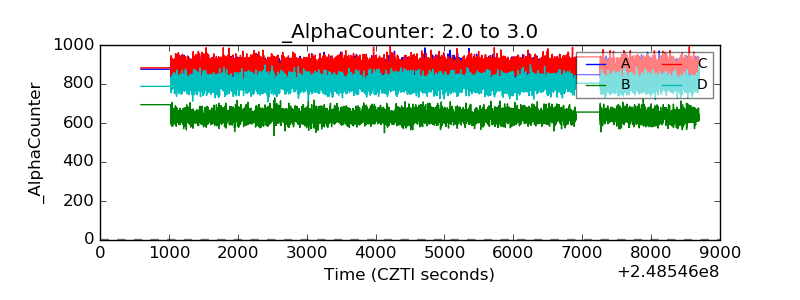 |
| _CPM_Rate | 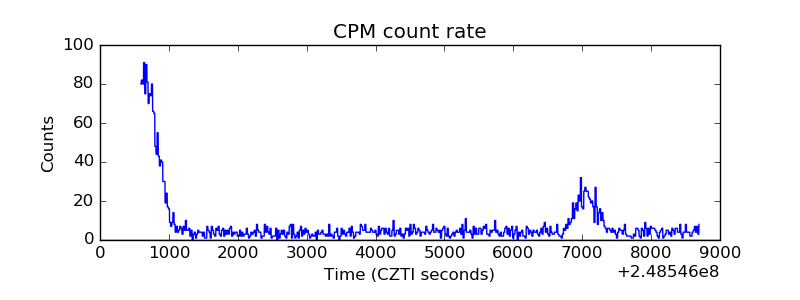 |
| CZT Counter | 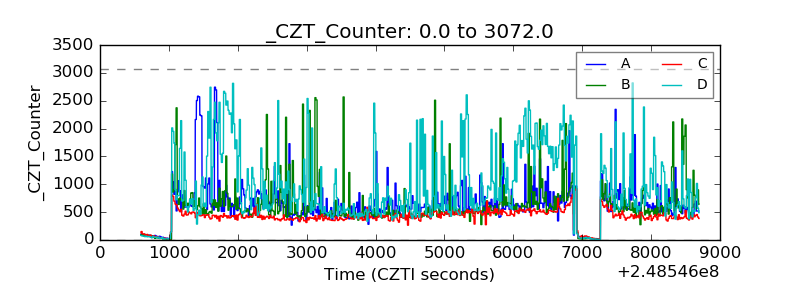 |
| +2.5 Volts monitor |  |
| +5 Volts monitor |  |
| _ROLL_ROT |  |
| _Roll_DEC | 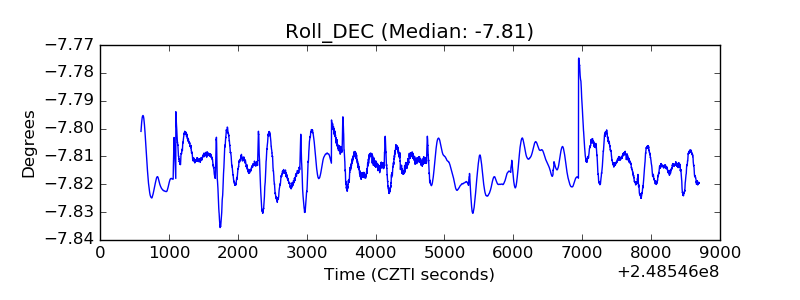 |
| _Roll_RA | 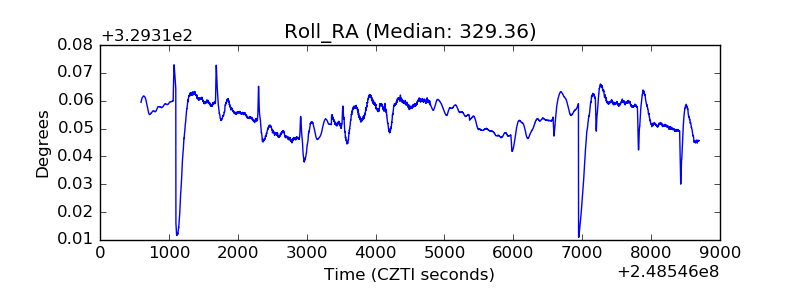 |
| Veto Counter | 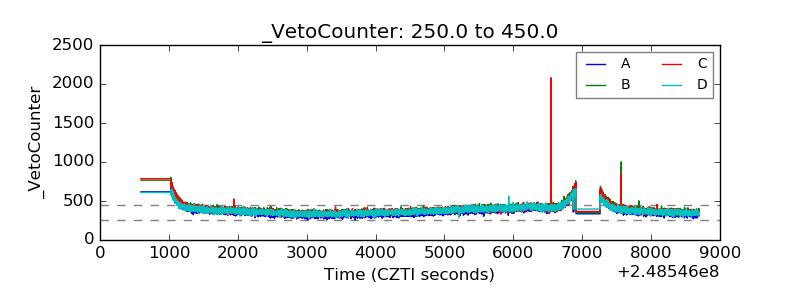 |