| Param | Original file | Final file |
|---|---|---|
| Filename | modeM0/AS1G08_009T01_9000001696_11555cztM0_level2.evt | modeM0/AS1G08_009T01_9000001696_11555cztM0_level2_quad_clean.evt |
| Size (bytes) | 739,952,640 | 111,643,200 |
| Size | 705.7 MB | 106.5 MB |
| Events in quadrant A | 5,519,773 | 706,184 |
| Events in quadrant B | 5,787,832 | 714,128 |
| Events in quadrant C | 3,713,979 | 727,460 |
| Events in quadrant D | 6,834,111 | 663,542 |
| Mode SS | |||
|---|---|---|---|
| Quadrant | BADHDUFLAG | Total packets | Discarded packets |
| A | 0 | 168 | 0 |
| B | 0 | 168 | 0 |
| C | 0 | 168 | 0 |
| D | 0 | 168 | 0 |
| Mode M9 | |||
|---|---|---|---|
| Quadrant | BADHDUFLAG | Total packets | Discarded packets |
| A | 0 | 5 | 0 |
| B | 0 | 5 | 0 |
| C | 0 | 5 | 0 |
| D | 0 | 5 | 0 |
| Mode M0 | |||
|---|---|---|---|
| Quadrant | BADHDUFLAG | Total packets | Discarded packets |
| A | 0 | 22033 | 4 |
| B | 0 | 22753 | 3 |
| C | 0 | 16888 | 3 |
| D | 0 | 25903 | 3 |
| Quadrant | Total seconds | Saturated seconds | Saturation percentage |
|---|---|---|---|
| A | 8190 | 412 | 5.030525% |
| B | 8190 | 513 | 6.263736% |
| C | 8190 | 41 | 0.500611% |
| D | 8190 | 660 | 8.058608% |
Noise dominated data is calculated using 1-second bins in cleaned event files. If a bin has >2000 counts, and if more than 50% of those come from <1% of pixels, then it is considered to be noise-dominated and hence unusable.
| Quadrant | # 1 sec bins | Bins with >0 counts | Bins with >2000 counts | High rate bins dominated by noise | Noise dominated (total time) | Noise dominated (detector-on time) | Marked lightcurve |
|---|---|---|---|---|---|---|---|
| A | 8741 | 8194 | 120 | 120 | 1.37% | 1.46% | 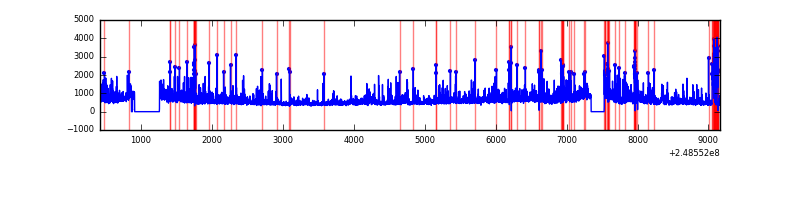 |
| B | 8741 | 8194 | 219 | 219 | 2.51% | 2.67% | 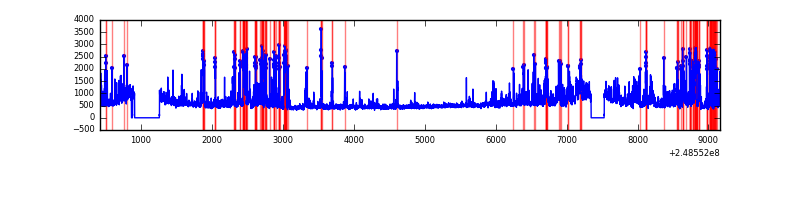 |
| C | 8741 | 8194 | 0 | 0 | 0.00% | 0.00% | 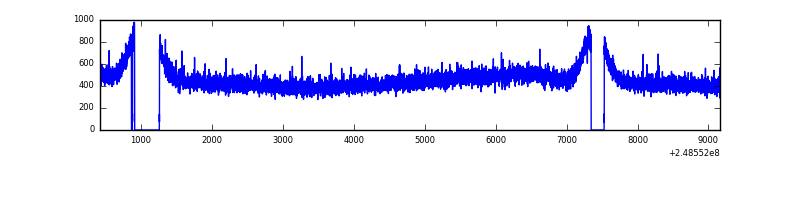 |
| D | 8741 | 8194 | 405 | 405 | 4.63% | 4.94% | 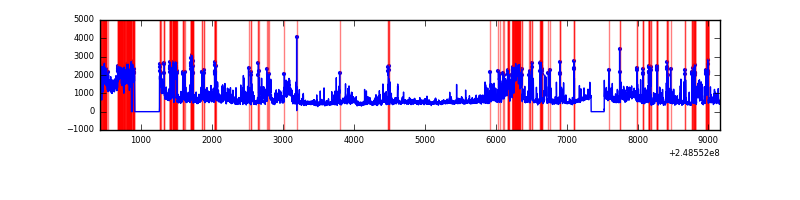 |
Top three noisy pixels from each quadrant. If the there are fewer than three noisy pixels in the level2.evt file, extra rows are filled as -1
| Pixel properties | Quadrant properties | ||||||
|---|---|---|---|---|---|---|---|
| Quadrant | DetID | PixID | Counts | Sigma | Mean | Median | Sigma |
| A | 8 | 5 | 1279392 | 6472.93 | 966 | 942 | 197.5 |
| A | 1 | 162 | 133391 | 670.6 | 966 | 942 | 197.5 |
| A | 9 | 143 | 119312 | 599.32 | 966 | 942 | 197.5 |
| B | 4 | 239 | 1067316 | 5699.81 | 971 | 946 | 187.1 |
| B | 15 | 204 | 528061 | 2817.46 | 971 | 946 | 187.1 |
| B | 3 | 64 | 162675 | 864.45 | 971 | 946 | 187.1 |
| C | 13 | 61 | 7183 | 27.94 | 952 | 957 | 222.8 |
| C | 3 | 202 | 2242 | 5.77 | 952 | 957 | 222.8 |
| C | -1 | -1 | -1 | -1.0 | 952 | 957 | 222.8 |
| D | 13 | 137 | 2125423 | 9444.46 | 921 | 891 | 224.9 |
| D | 1 | 52 | 760876 | 3378.46 | 921 | 891 | 224.9 |
| D | 2 | 120 | 174292 | 770.84 | 921 | 891 | 224.9 |
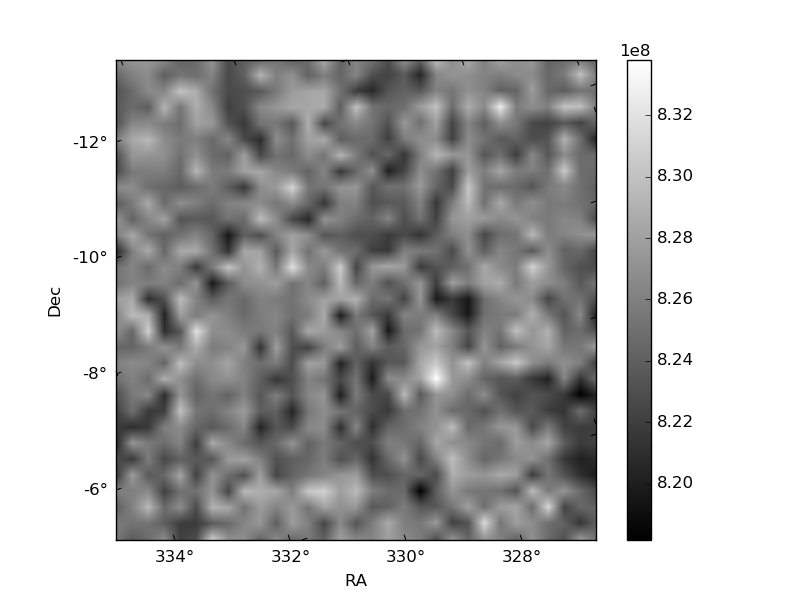
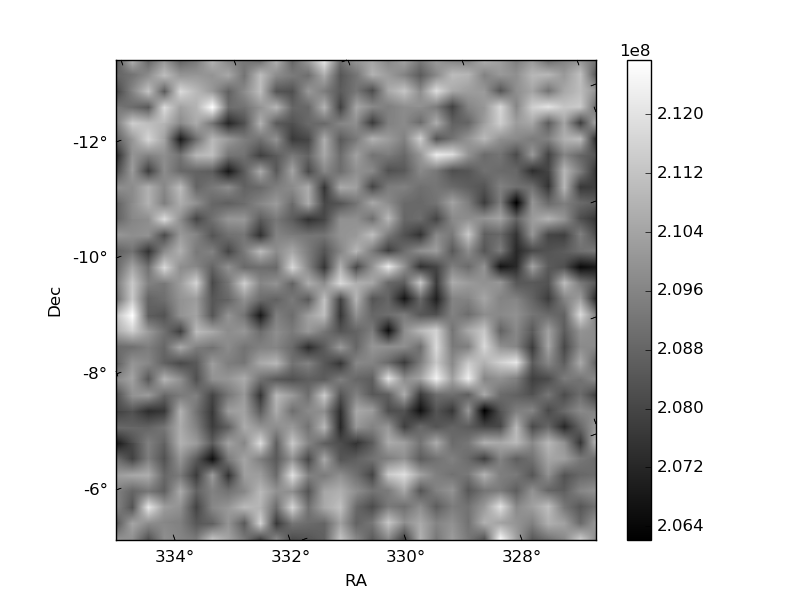
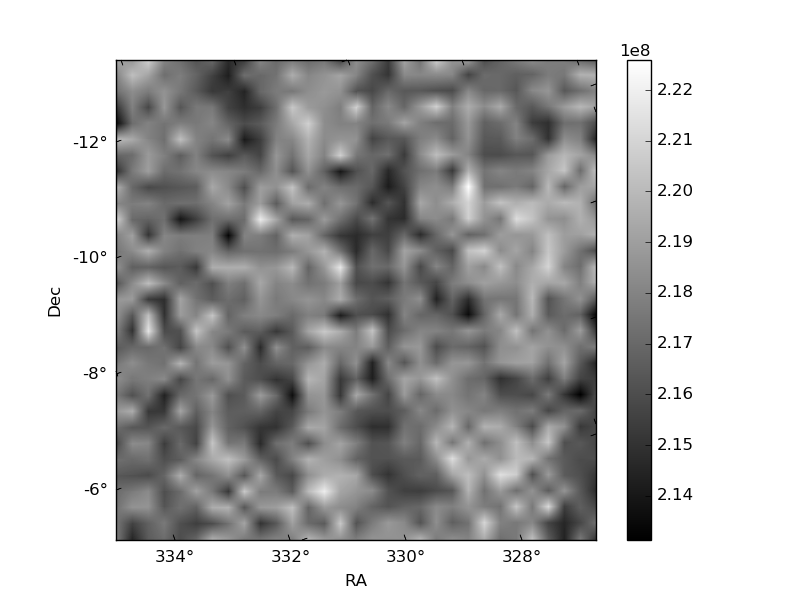
Histogram calculated using DETX and DETY for each event in the final _common_clean file
| Quadrant A | 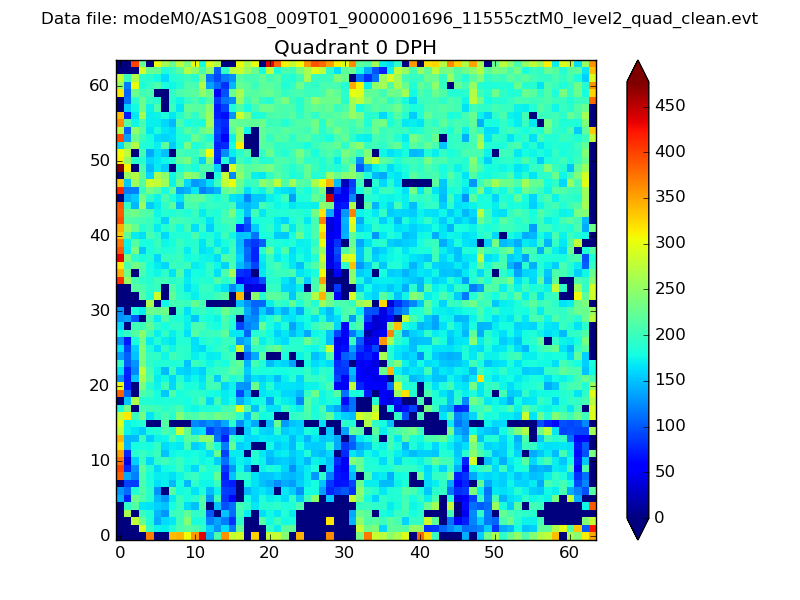 |
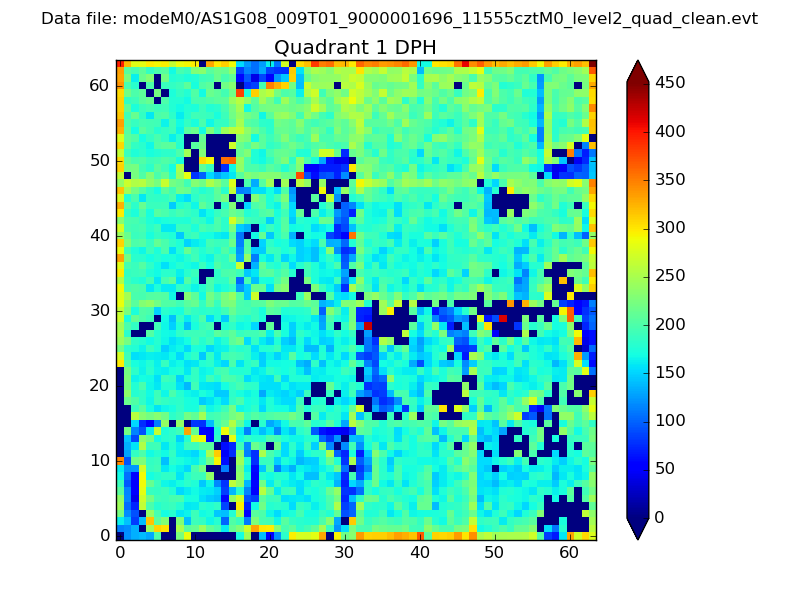 |
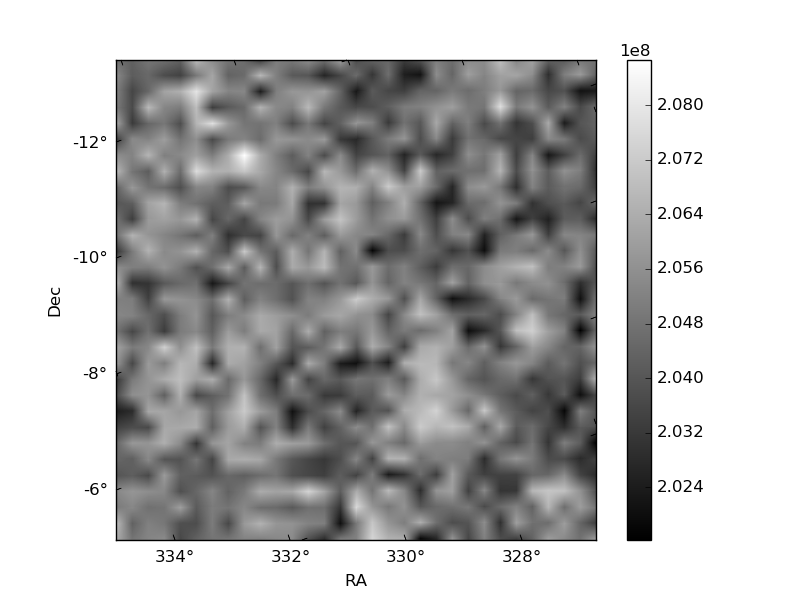
Quadrant B |
|---|---|---|---|
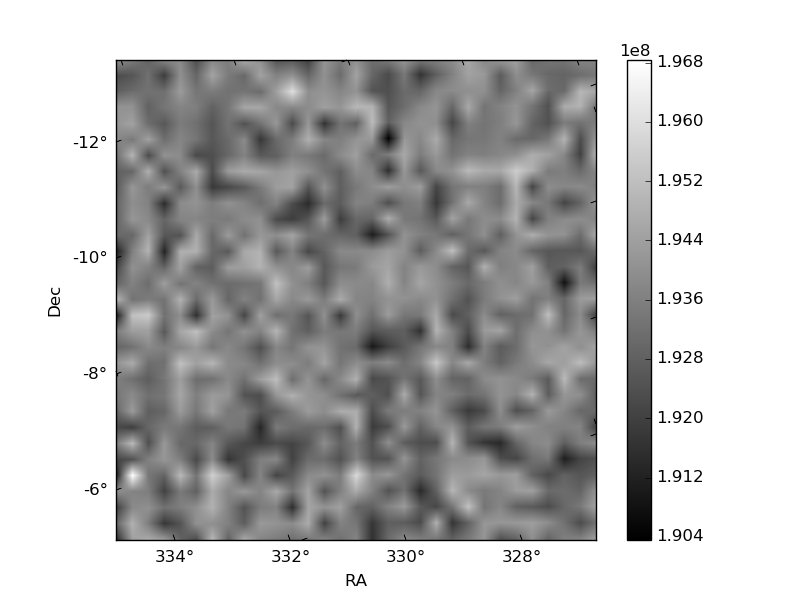
| Quadrant D | 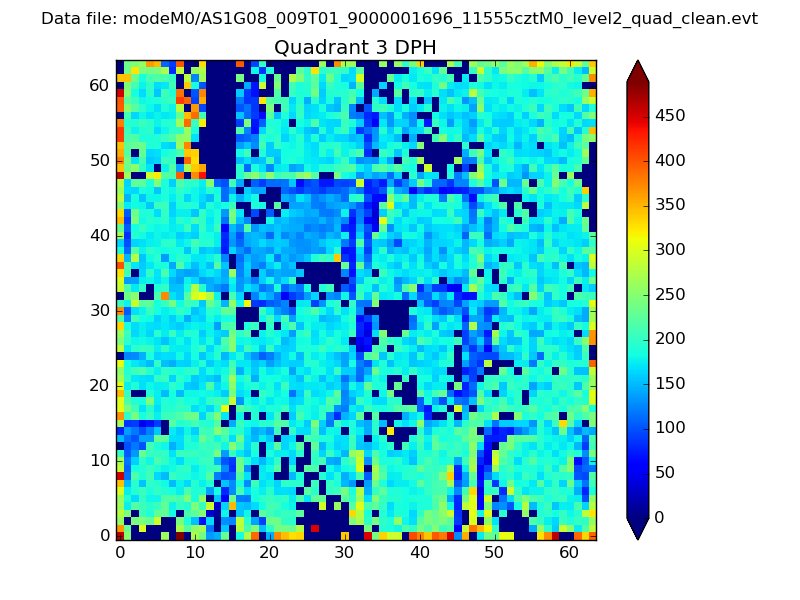 |
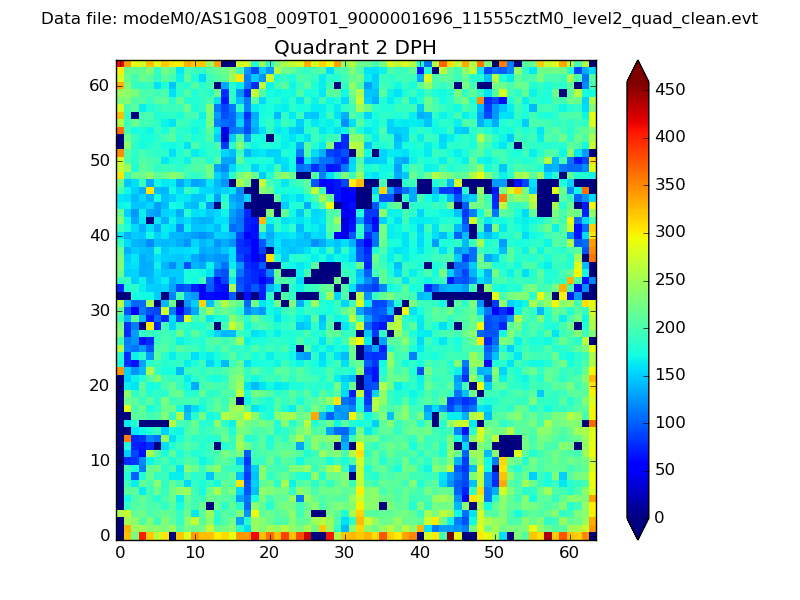 |
Quadrant C |
| Plot type | Count rate plots | Images |
|---|---|---|
| Comparison with Poisson distribution Blue bars denote a histogram of data divided into 1 sec bins. Red curve is a Poisson curve with rate = median count rate of data. |
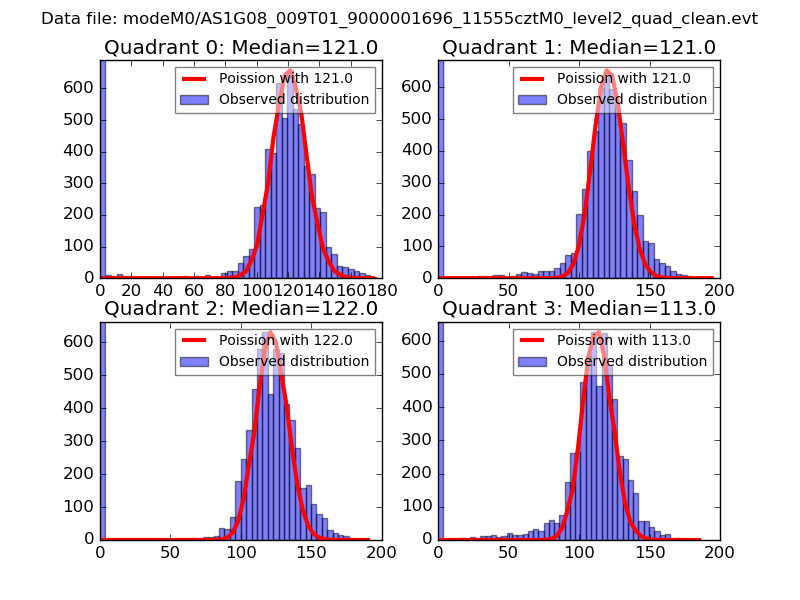 |
 |
| Quadrant-wise count rates Data is divided into 100 sec bins |
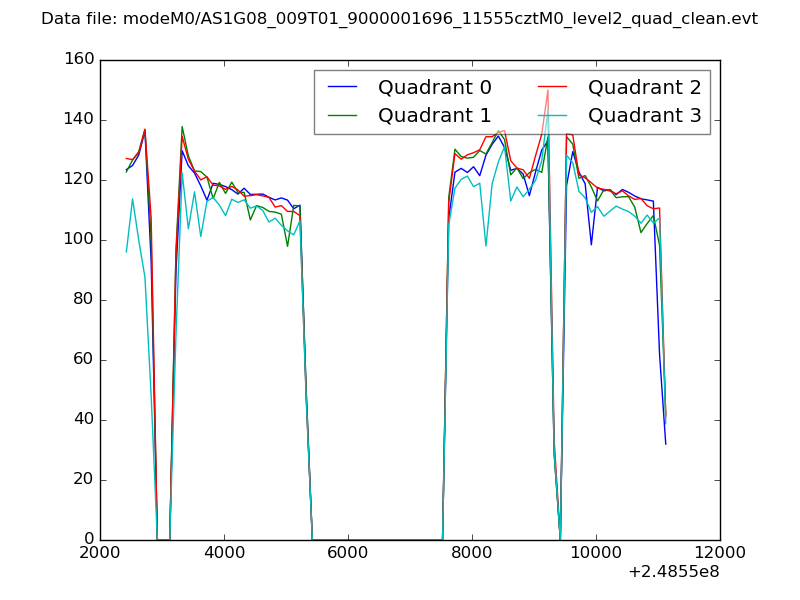 |
|
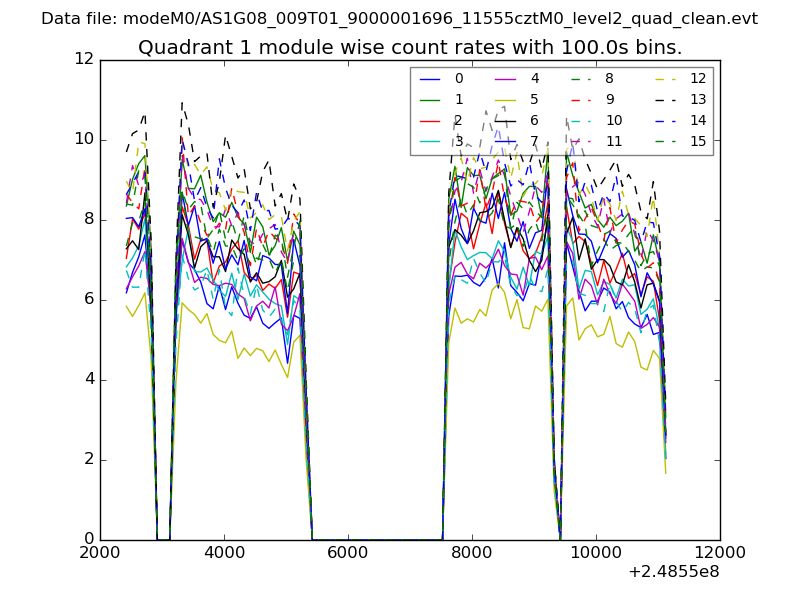
| Module-wise count rates for Quadrant A Data is divided into 100 sec bins |
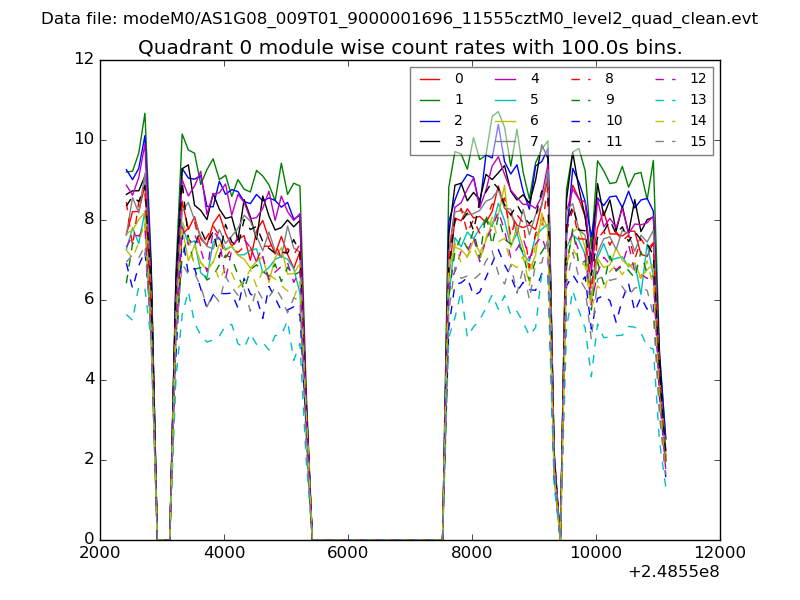 |
 |
| Module-wise count rates for Quadrant B Data is divided into 100 sec bins |
 |
 |
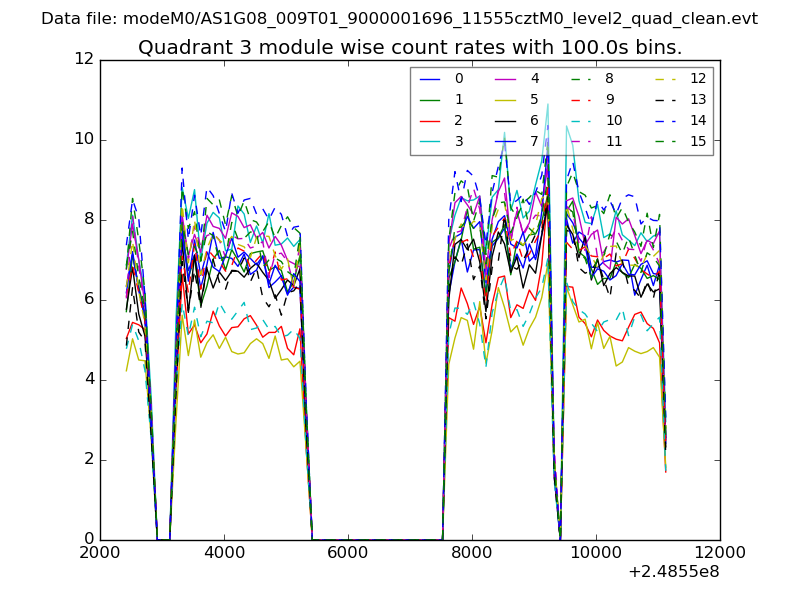
| Module-wise count rates for Quadrant C Data is divided into 100 sec bins |
 |
 |
| Module-wise count rates for Quadrant D Data is divided into 100 sec bins |
 |
 |
| Parameter | Plot |
|---|---|
| CZT HV Monitor | 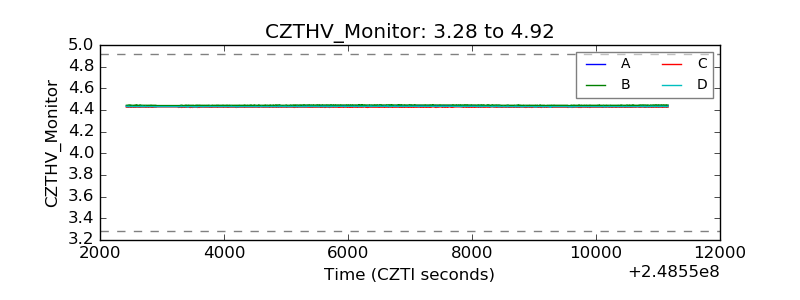 |
| D_VDD | 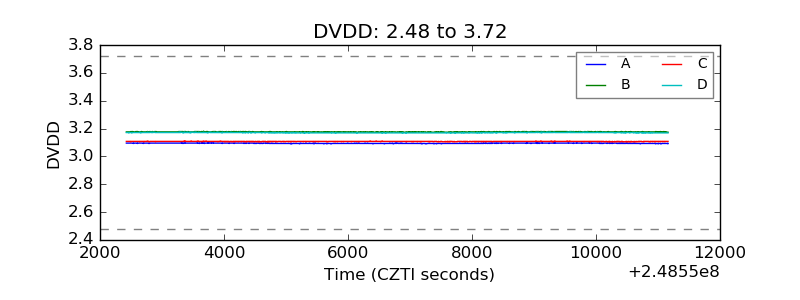 |
| Temperature 1 | 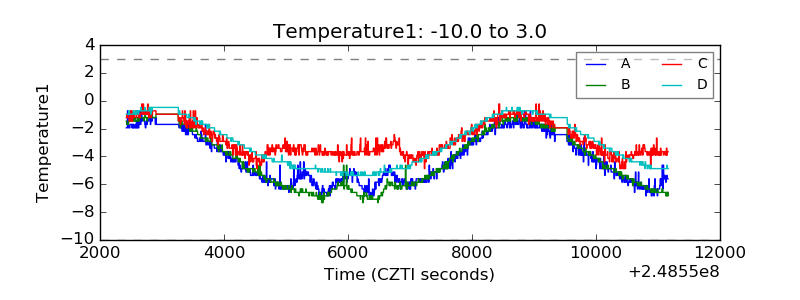 |
| Veto HV Monitor | 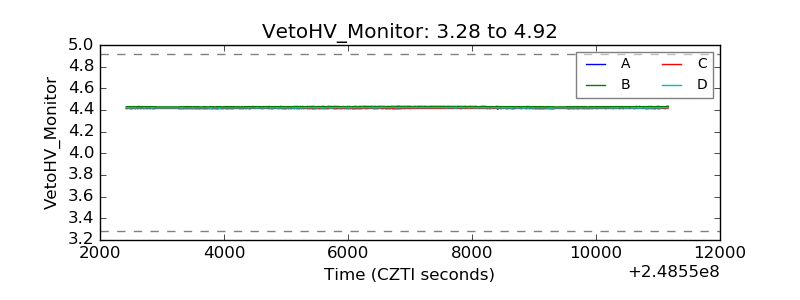 |
| Veto LLD | 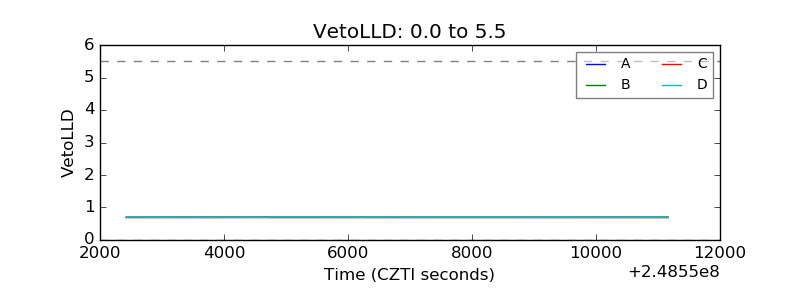 |
| Alpha Counter | 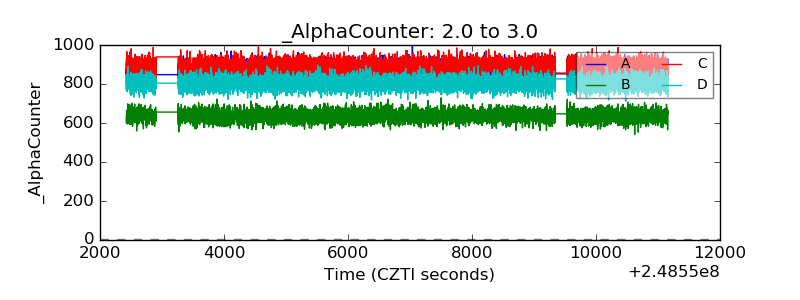 |
| _CPM_Rate | 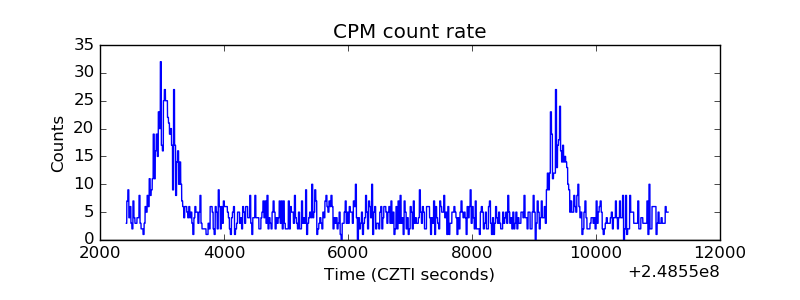 |
| CZT Counter | 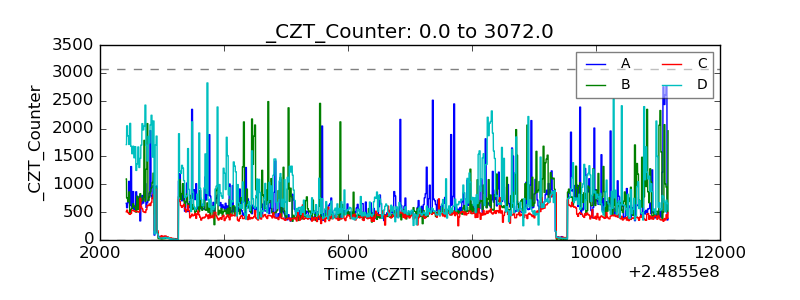 |
| +2.5 Volts monitor |  |
| +5 Volts monitor |  |
| _ROLL_ROT | 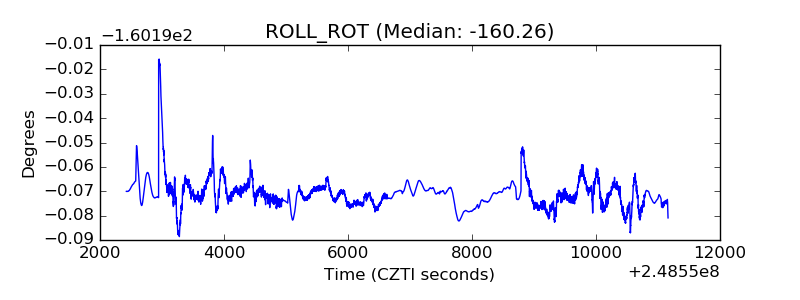 |
| _Roll_DEC | 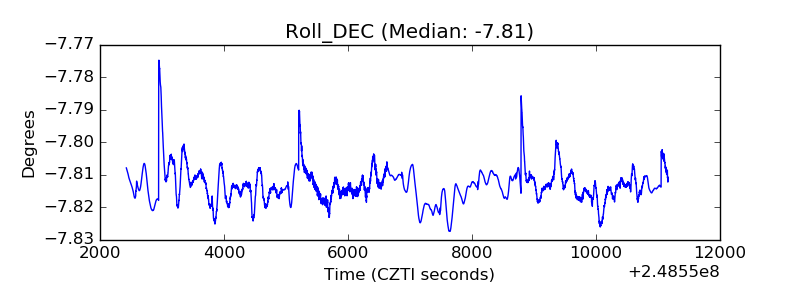 |
| _Roll_RA | 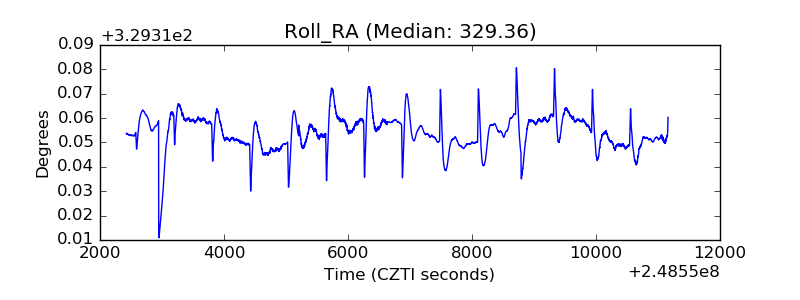 |
| Veto Counter | 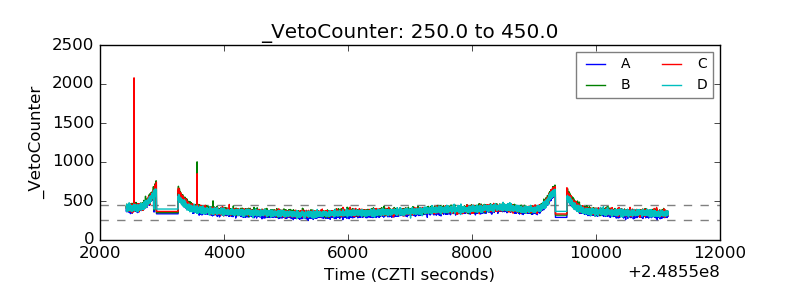 |