| Param | Original file | Final file |
|---|---|---|
| Filename | modeM0/AS1G08_009T01_9000001696_11558cztM0_level2.evt | modeM0/AS1G08_009T01_9000001696_11558cztM0_level2_quad_clean.evt |
| Size (bytes) | 1,093,544,640 | 149,281,920 |
| Size | 1.0 GB | 142.4 MB |
| Events in quadrant A | 9,692,358 | 890,040 |
| Events in quadrant B | 8,440,608 | 910,406 |
| Events in quadrant C | 5,907,783 | 929,347 |
| Events in quadrant D | 8,180,594 | 873,297 |
| Mode SS | |||
|---|---|---|---|
| Quadrant | BADHDUFLAG | Total packets | Discarded packets |
| A | 0 | 272 | 0 |
| B | 0 | 272 | 0 |
| C | 0 | 272 | 0 |
| D | 0 | 272 | 0 |
| Mode M9 | |||
|---|---|---|---|
| Quadrant | BADHDUFLAG | Total packets | Discarded packets |
| A | 0 | 16 | 0 |
| B | 0 | 16 | 0 |
| C | 0 | 16 | 0 |
| D | 0 | 16 | 0 |
| Mode M0 | |||
|---|---|---|---|
| Quadrant | BADHDUFLAG | Total packets | Discarded packets |
| A | 0 | 37694 | 4 |
| B | 0 | 33879 | 3 |
| C | 0 | 26990 | 3 |
| D | 0 | 33372 | 3 |
| Quadrant | Total seconds | Saturated seconds | Saturation percentage |
|---|---|---|---|
| A | 13278 | 814 | 6.130441% |
| B | 13278 | 503 | 3.788221% |
| C | 13278 | 66 | 0.497063% |
| D | 13278 | 401 | 3.020033% |
Noise dominated data is calculated using 1-second bins in cleaned event files. If a bin has >2000 counts, and if more than 50% of those come from <1% of pixels, then it is considered to be noise-dominated and hence unusable.
| Quadrant | # 1 sec bins | Bins with >0 counts | Bins with >2000 counts | High rate bins dominated by noise | Noise dominated (total time) | Noise dominated (detector-on time) | Marked lightcurve |
|---|---|---|---|---|---|---|---|
| A | 14935 | 13283 | 447 | 447 | 2.99% | 3.37% | 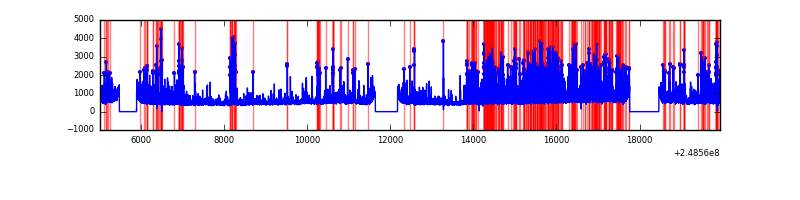 |
| B | 14935 | 13283 | 225 | 225 | 1.51% | 1.69% | 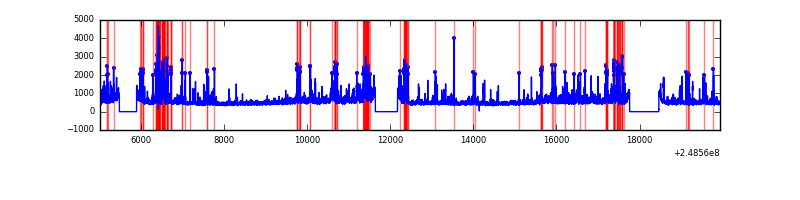 |
| C | 14935 | 13283 | 0 | 0 | 0.00% | 0.00% | 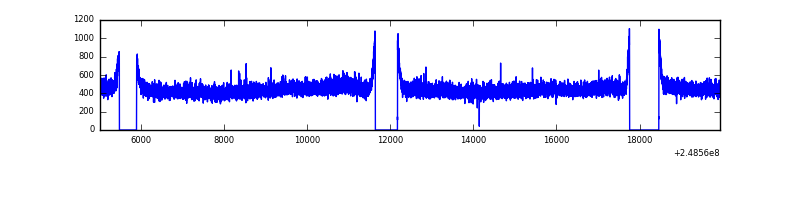 |
| D | 14935 | 13283 | 242 | 242 | 1.62% | 1.82% | 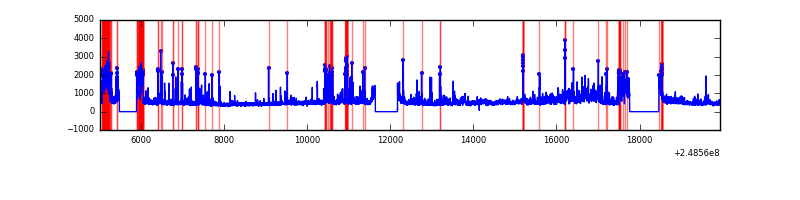 |
Top three noisy pixels from each quadrant. If the there are fewer than three noisy pixels in the level2.evt file, extra rows are filled as -1
| Pixel properties | Quadrant properties | ||||||
|---|---|---|---|---|---|---|---|
| Quadrant | DetID | PixID | Counts | Sigma | Mean | Median | Sigma |
| A | 8 | 5 | 3134418 | 10179.42 | 1519 | 1485 | 307.8 |
| A | 1 | 162 | 245092 | 791.52 | 1519 | 1485 | 307.8 |
| A | 1 | 178 | 148633 | 478.11 | 1519 | 1485 | 307.8 |
| B | 4 | 239 | 1398500 | 4722.41 | 1547 | 1507 | 295.8 |
| B | 15 | 204 | 671278 | 2264.1 | 1547 | 1507 | 295.8 |
| B | 11 | 51 | 227751 | 764.8 | 1547 | 1507 | 295.8 |
| C | 13 | 61 | 10960 | 26.69 | 1514 | 1518 | 353.7 |
| C | 12 | 4 | 5567 | 11.45 | 1514 | 1518 | 353.7 |
| C | 3 | 202 | 3712 | 6.2 | 1514 | 1518 | 353.7 |
| D | 1 | 52 | 1367457 | 3773.31 | 1495 | 1452 | 362.0 |
| D | 13 | 137 | 368958 | 1015.16 | 1495 | 1452 | 362.0 |
| D | 2 | 120 | 152186 | 416.37 | 1495 | 1452 | 362.0 |
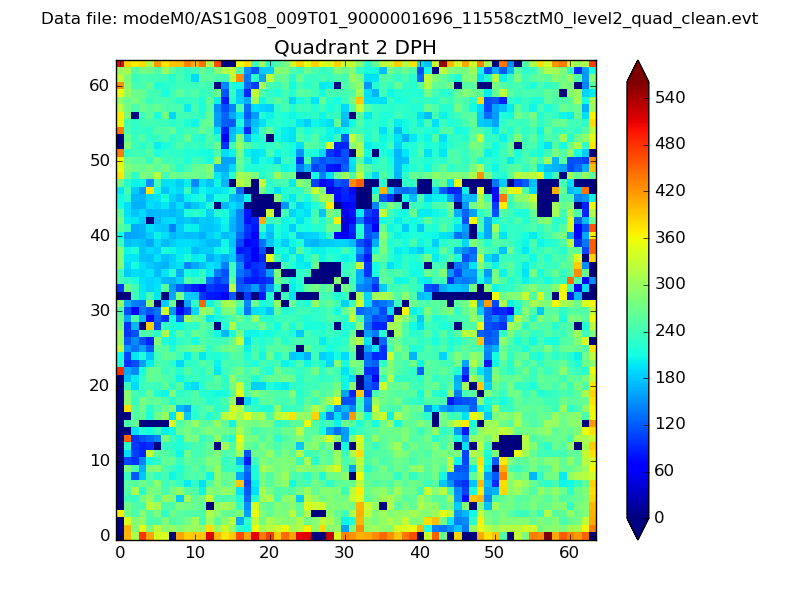
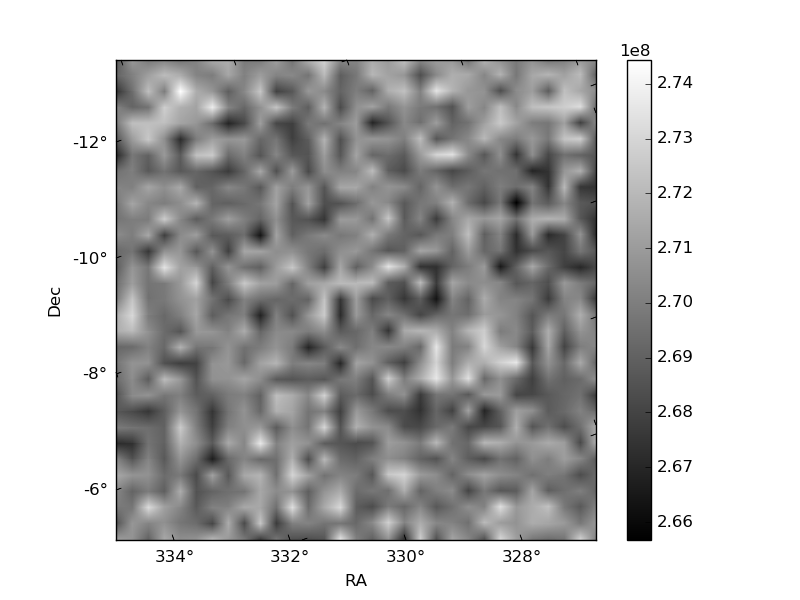
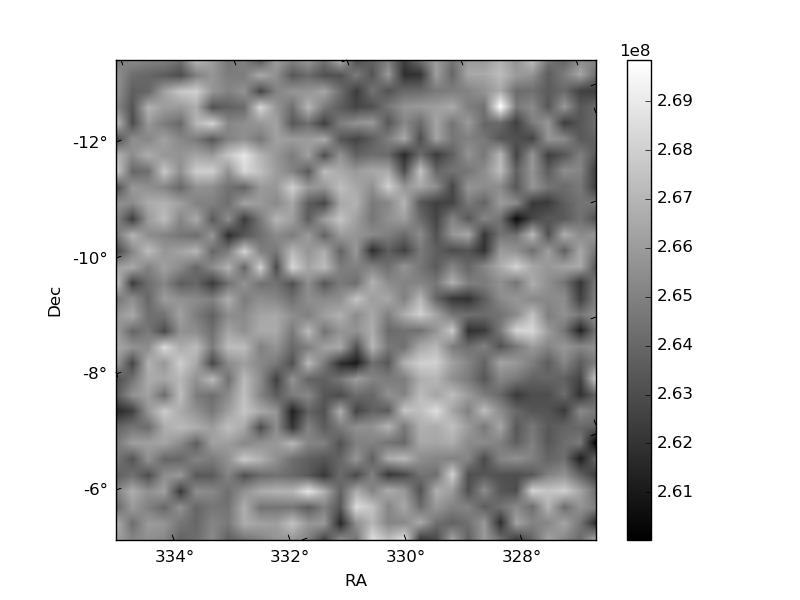
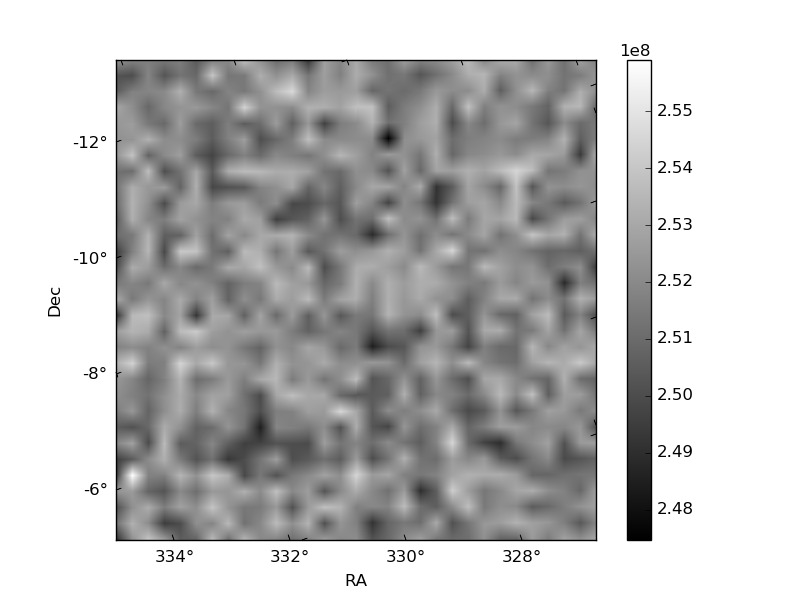
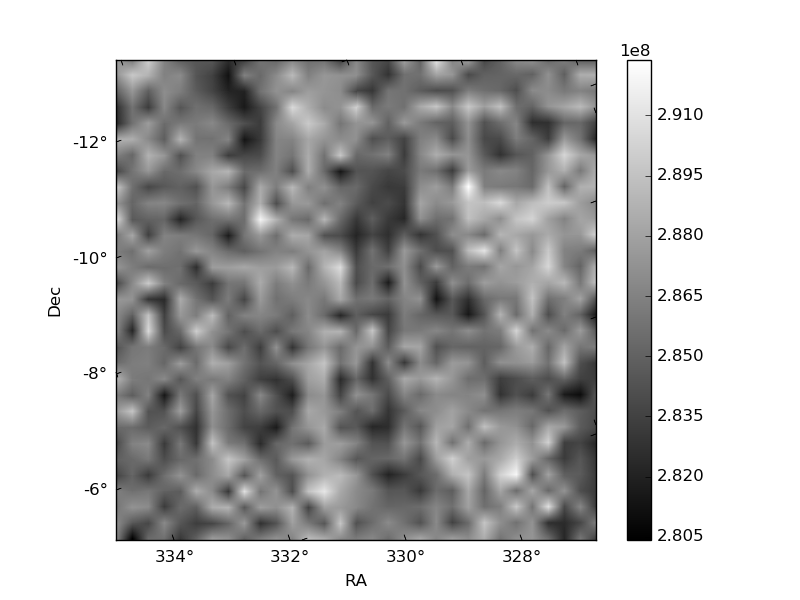
Histogram calculated using DETX and DETY for each event in the final _common_clean file
| Quadrant A | 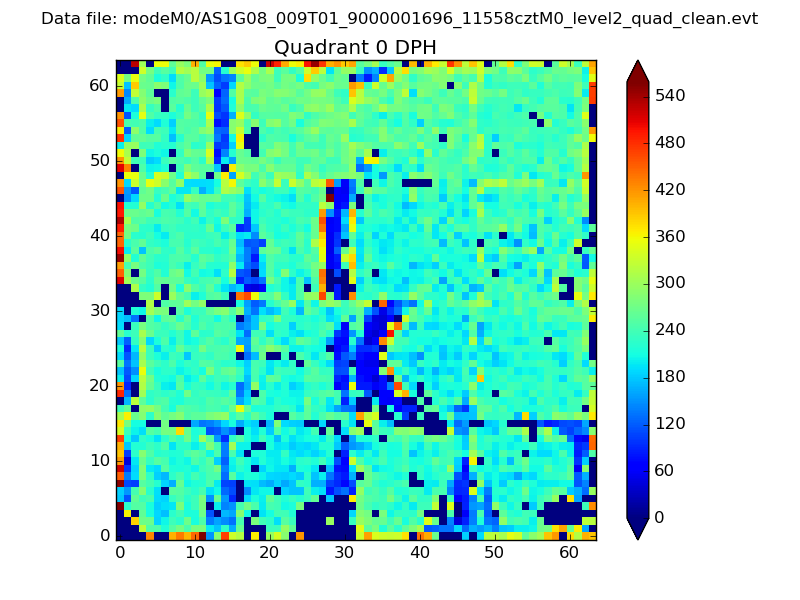 |
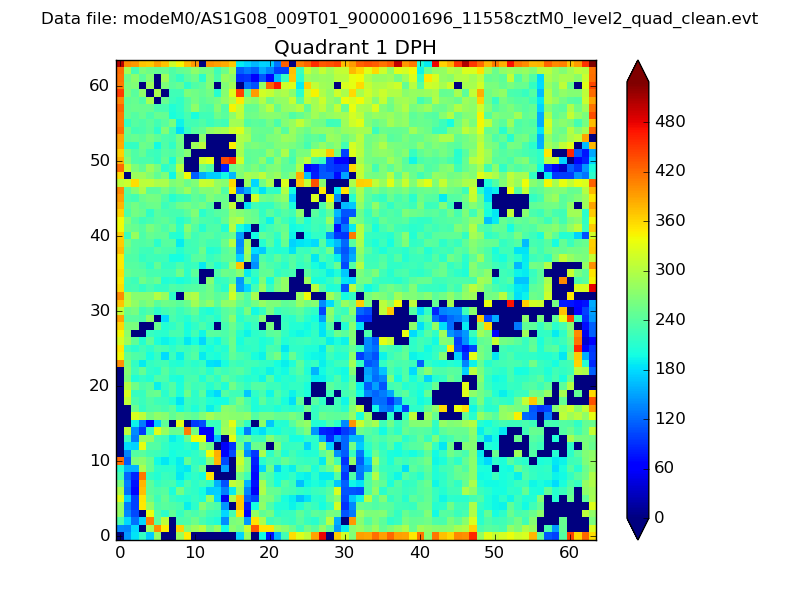 |
Quadrant B |
|---|---|---|---|
| Quadrant D | 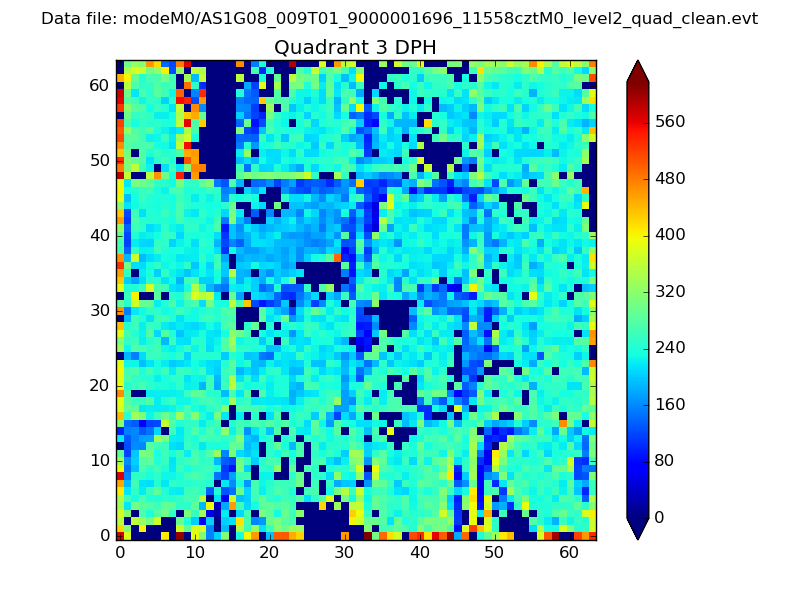 |
 |
Quadrant C |
| Plot type | Count rate plots | Images |
|---|---|---|
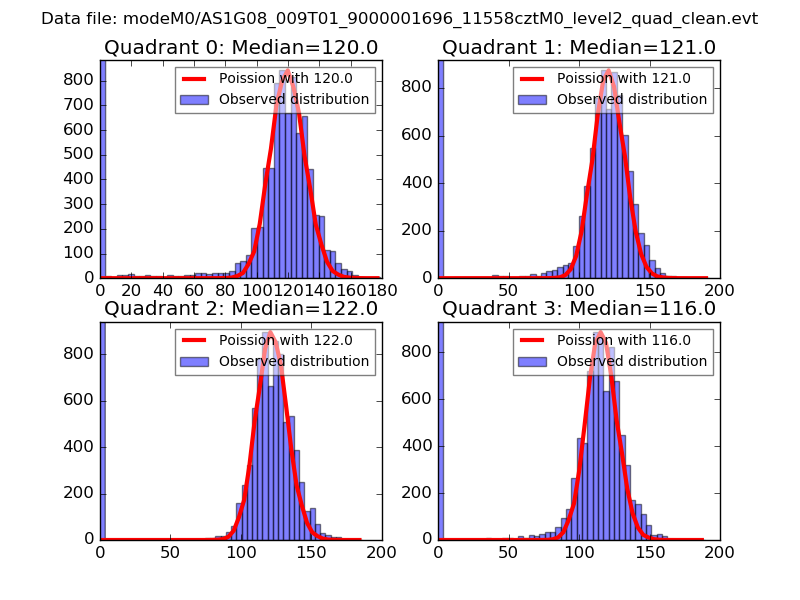
| Comparison with Poisson distribution Blue bars denote a histogram of data divided into 1 sec bins. Red curve is a Poisson curve with rate = median count rate of data. |
 |
 |
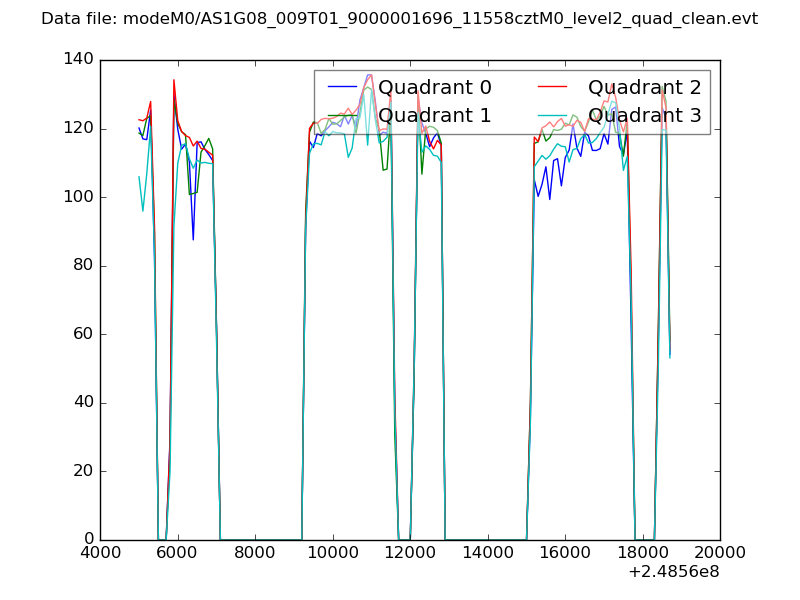
| Quadrant-wise count rates Data is divided into 100 sec bins |
 |
|
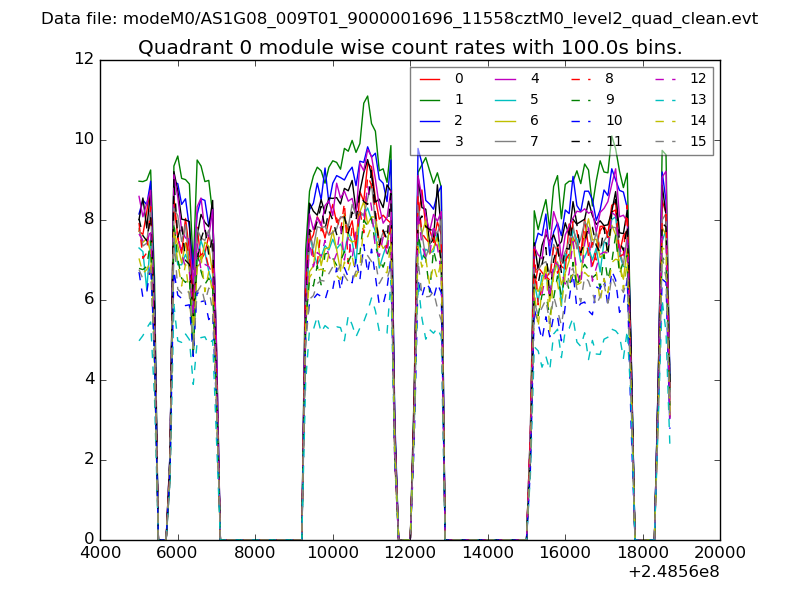
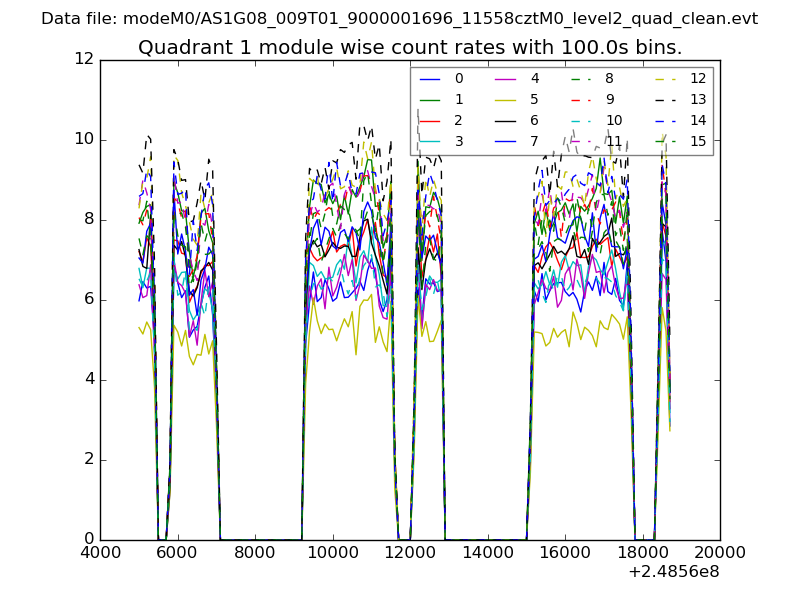
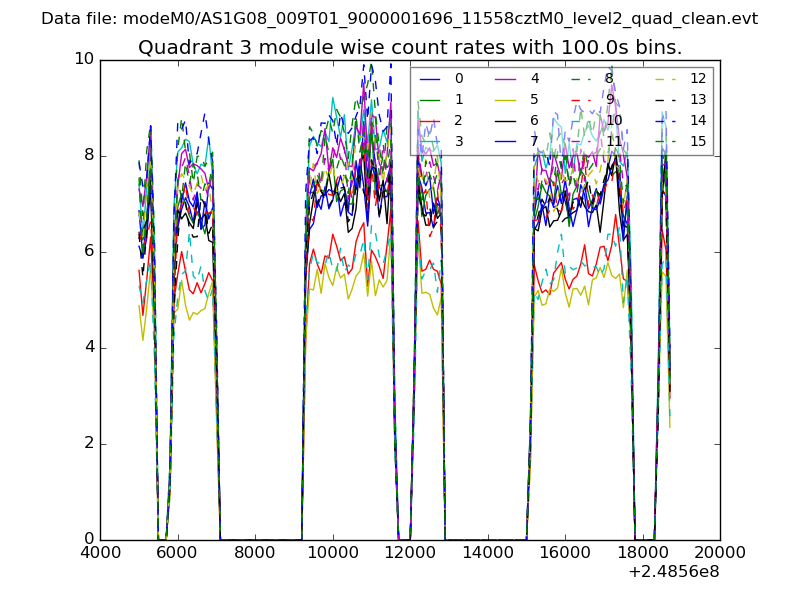
| Module-wise count rates for Quadrant A Data is divided into 100 sec bins |
 |
 |
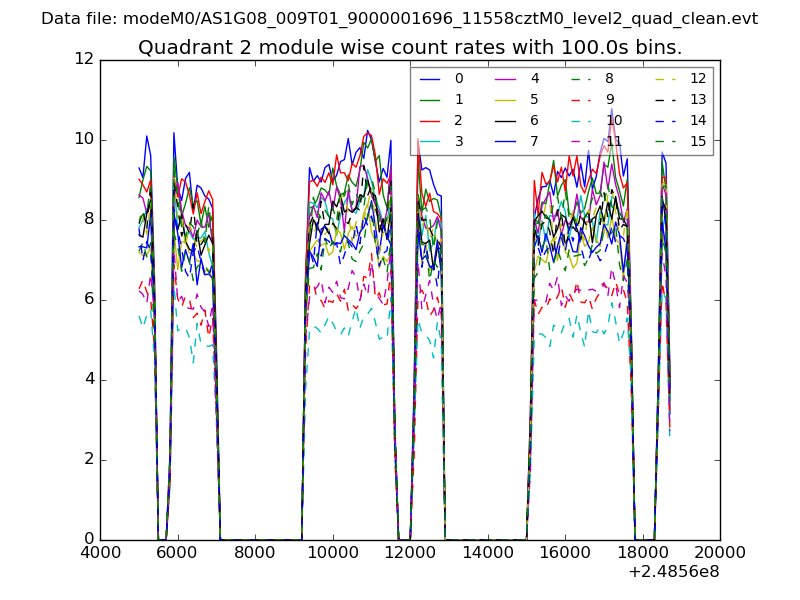
| Module-wise count rates for Quadrant B Data is divided into 100 sec bins |
 |
 |
| Module-wise count rates for Quadrant C Data is divided into 100 sec bins |
 |
 |
| Module-wise count rates for Quadrant D Data is divided into 100 sec bins |
 |
 |
| Parameter | Plot |
|---|---|
| CZT HV Monitor | 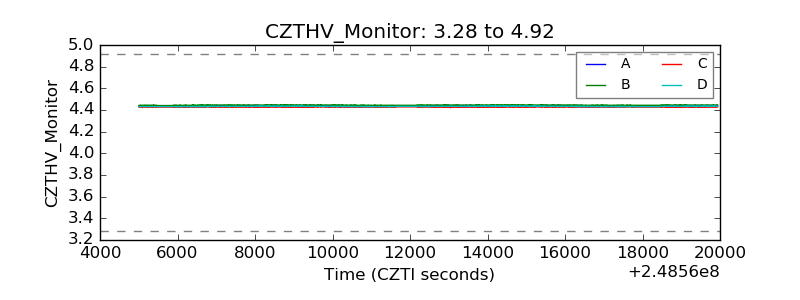 |
| D_VDD | 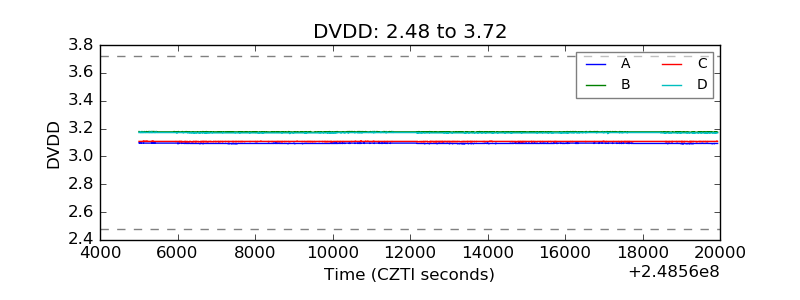 |
| Temperature 1 | 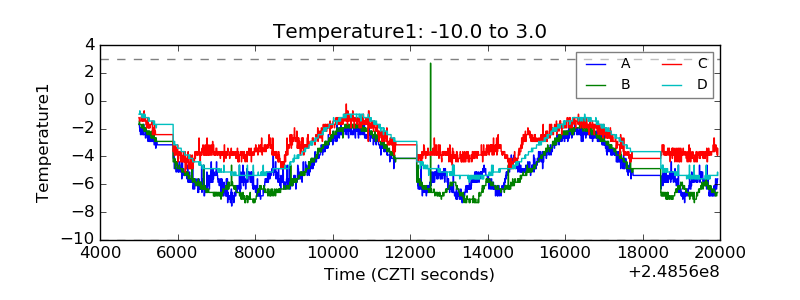 |
| Veto HV Monitor | 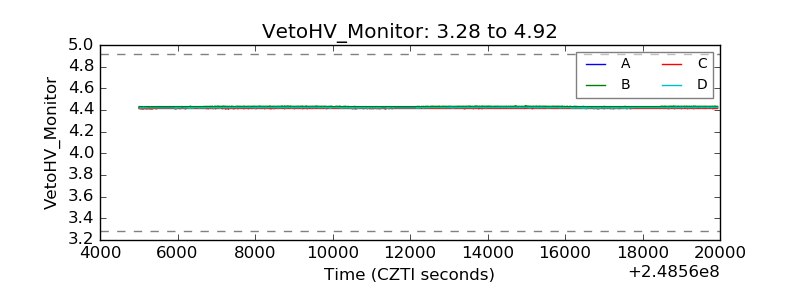 |
| Veto LLD | 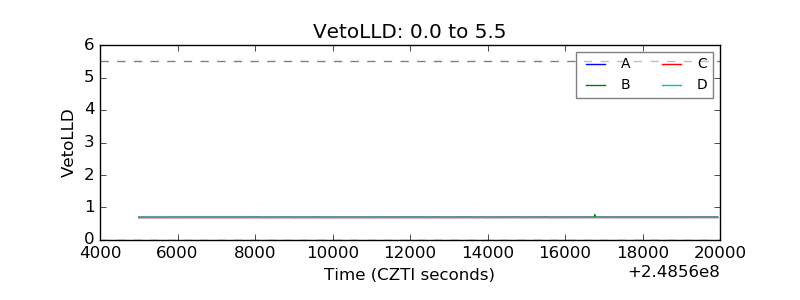 |
| Alpha Counter | 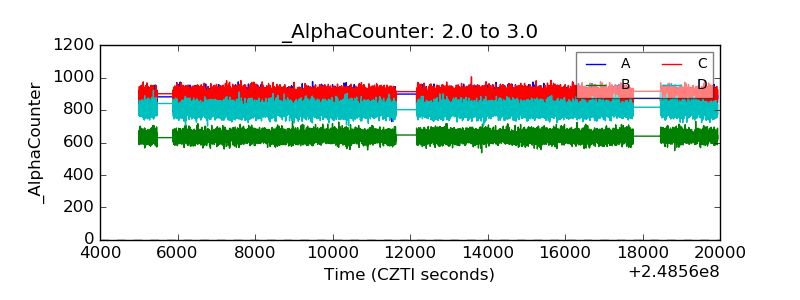 |
| _CPM_Rate | 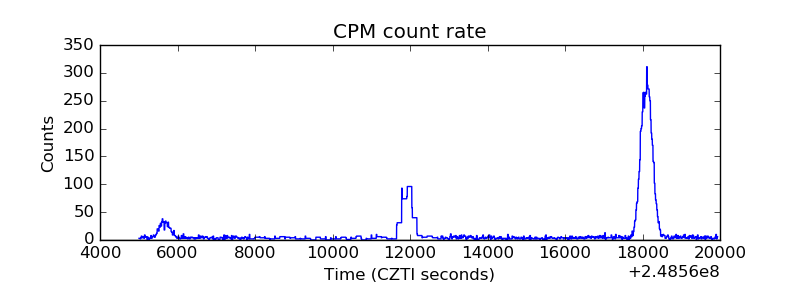 |
| CZT Counter | 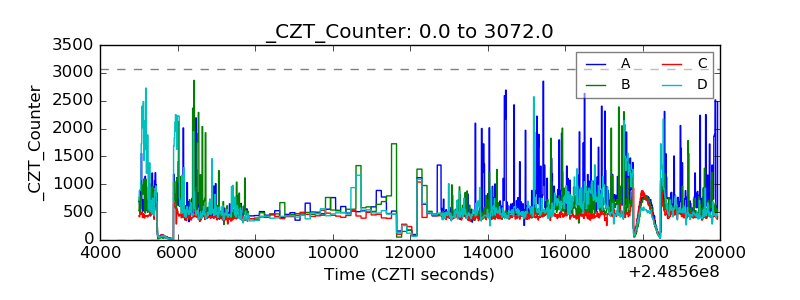 |
| +2.5 Volts monitor |  |
| +5 Volts monitor |  |
| _ROLL_ROT | 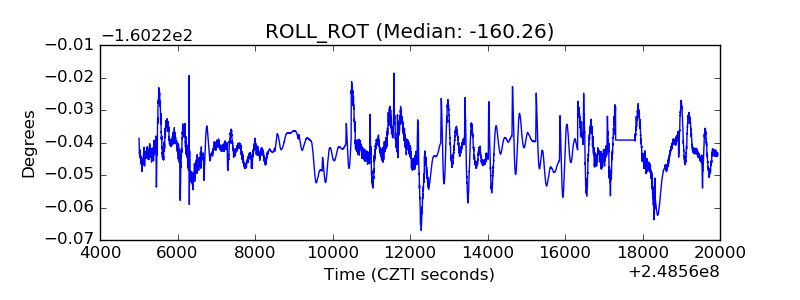 |
| _Roll_DEC | 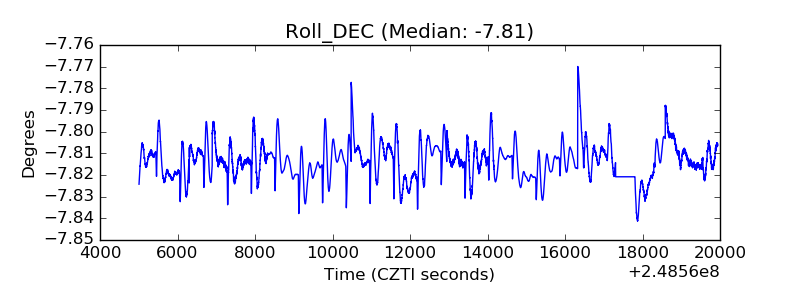 |
| _Roll_RA | 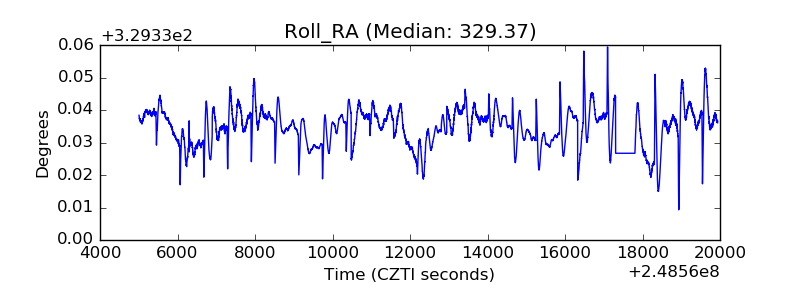 |
| Veto Counter | 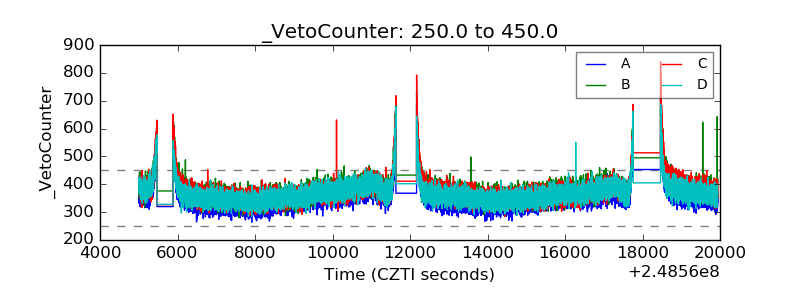 |