| Param | Original file | Final file |
|---|---|---|
| Filename | modeM0/AS1G08_009T01_9000001696_11559cztM0_level2.evt | modeM0/AS1G08_009T01_9000001696_11559cztM0_level2_quad_clean.evt |
| Size (bytes) | 569,208,960 | 67,187,520 |
| Size | 542.8 MB | 64.1 MB |
| Events in quadrant A | 5,201,386 | 383,168 |
| Events in quadrant B | 4,175,389 | 390,026 |
| Events in quadrant C | 3,203,129 | 397,041 |
| Events in quadrant D | 4,184,487 | 376,442 |
| Mode SS | |||
|---|---|---|---|
| Quadrant | BADHDUFLAG | Total packets | Discarded packets |
| A | 0 | 146 | 0 |
| B | 0 | 146 | 0 |
| C | 0 | 146 | 0 |
| D | 0 | 146 | 0 |
| Mode M9 | |||
|---|---|---|---|
| Quadrant | BADHDUFLAG | Total packets | Discarded packets |
| A | 0 | 15 | 0 |
| B | 0 | 15 | 0 |
| C | 0 | 15 | 0 |
| D | 0 | 15 | 0 |
| Mode M0 | |||
|---|---|---|---|
| Quadrant | BADHDUFLAG | Total packets | Discarded packets |
| A | 0 | 20072 | 3 |
| B | 0 | 16866 | 2 |
| C | 0 | 14341 | 2 |
| D | 0 | 17144 | 2 |
| Quadrant | Total seconds | Saturated seconds | Saturation percentage |
|---|---|---|---|
| A | 6988 | 418 | 5.981683% |
| B | 6988 | 281 | 4.021179% |
| C | 6988 | 59 | 0.844305% |
| D | 6988 | 123 | 1.760160% |
Noise dominated data is calculated using 1-second bins in cleaned event files. If a bin has >2000 counts, and if more than 50% of those come from <1% of pixels, then it is considered to be noise-dominated and hence unusable.
| Quadrant | # 1 sec bins | Bins with >0 counts | Bins with >2000 counts | High rate bins dominated by noise | Noise dominated (total time) | Noise dominated (detector-on time) | Marked lightcurve |
|---|---|---|---|---|---|---|---|
| A | 8554 | 6991 | 190 | 190 | 2.22% | 2.72% | 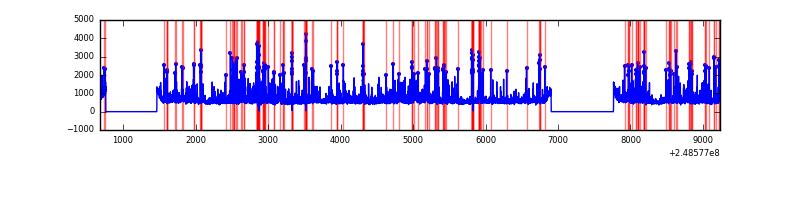 |
| B | 8554 | 6991 | 101 | 101 | 1.18% | 1.44% | 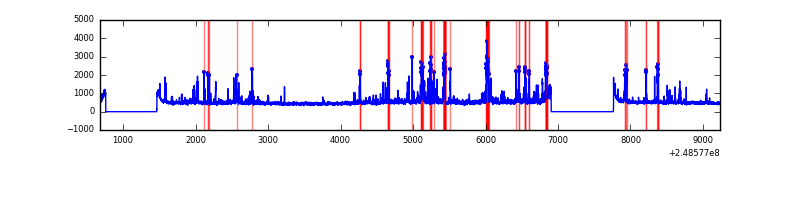 |
| C | 8554 | 6991 | 1 | 1 | 0.01% | 0.01% | 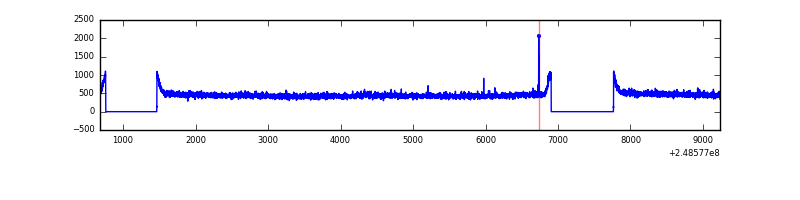 |
| D | 8554 | 6991 | 31 | 31 | 0.36% | 0.44% | 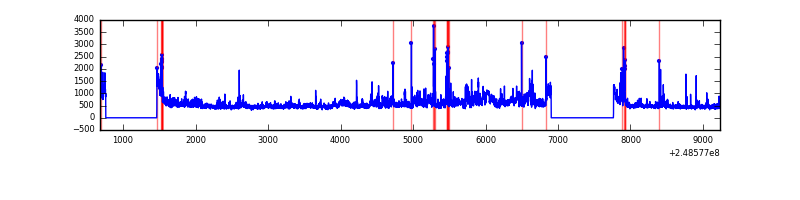 |
Top three noisy pixels from each quadrant. If the there are fewer than three noisy pixels in the level2.evt file, extra rows are filled as -1
| Pixel properties | Quadrant properties | ||||||
|---|---|---|---|---|---|---|---|
| Quadrant | DetID | PixID | Counts | Sigma | Mean | Median | Sigma |
| A | 8 | 5 | 1547937 | 9206.69 | 817 | 797 | 168.0 |
| A | 1 | 162 | 151480 | 896.68 | 817 | 797 | 168.0 |
| A | 1 | 178 | 98079 | 578.9 | 817 | 797 | 168.0 |
| B | 4 | 239 | 672289 | 4211.05 | 832 | 812 | 159.5 |
| B | 11 | 51 | 122044 | 760.28 | 832 | 812 | 159.5 |
| B | 15 | 204 | 98470 | 612.44 | 832 | 812 | 159.5 |
| C | 9 | 54 | 17312 | 86.03 | 816 | 820 | 191.7 |
| C | 13 | 61 | 6015 | 27.1 | 816 | 820 | 191.7 |
| C | 12 | 4 | 2135 | 6.86 | 816 | 820 | 191.7 |
| D | 1 | 52 | 732381 | 3745.99 | 806 | 783 | 195.3 |
| D | 13 | 137 | 155121 | 790.25 | 806 | 783 | 195.3 |
| D | 8 | 195 | 57875 | 292.33 | 806 | 783 | 195.3 |
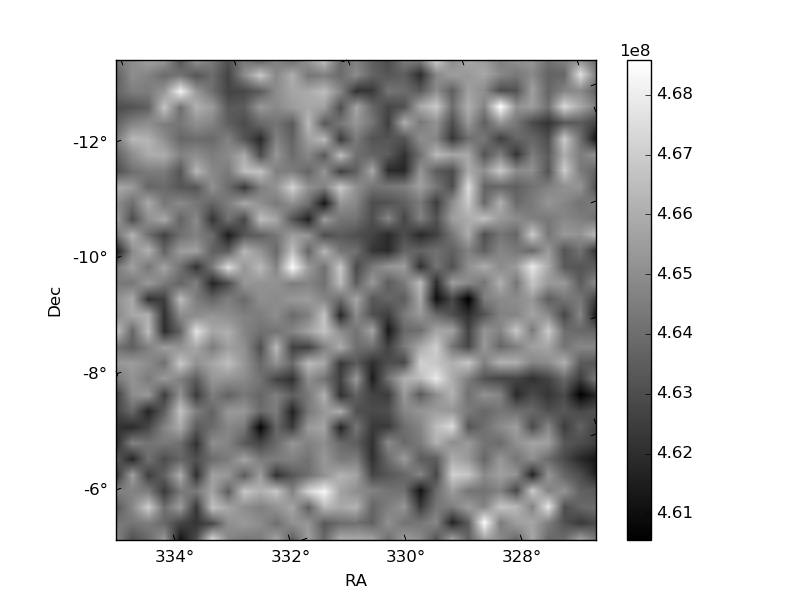
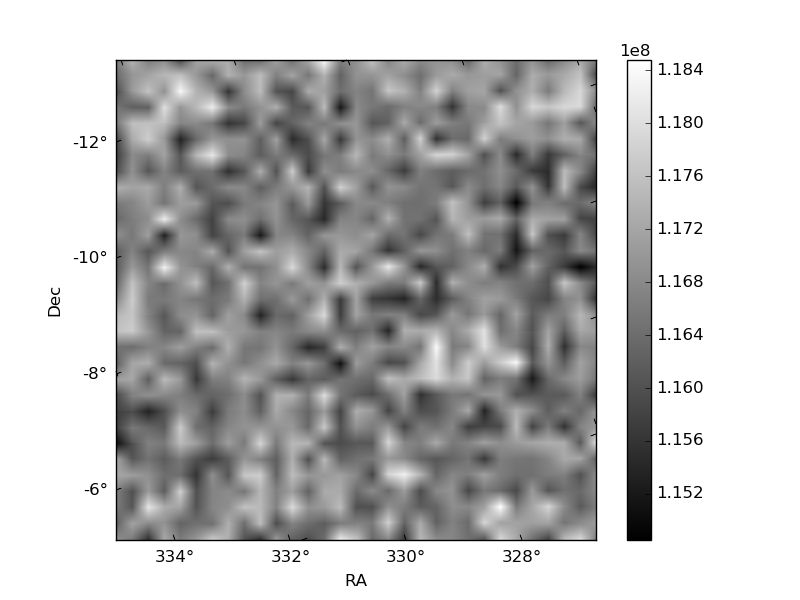
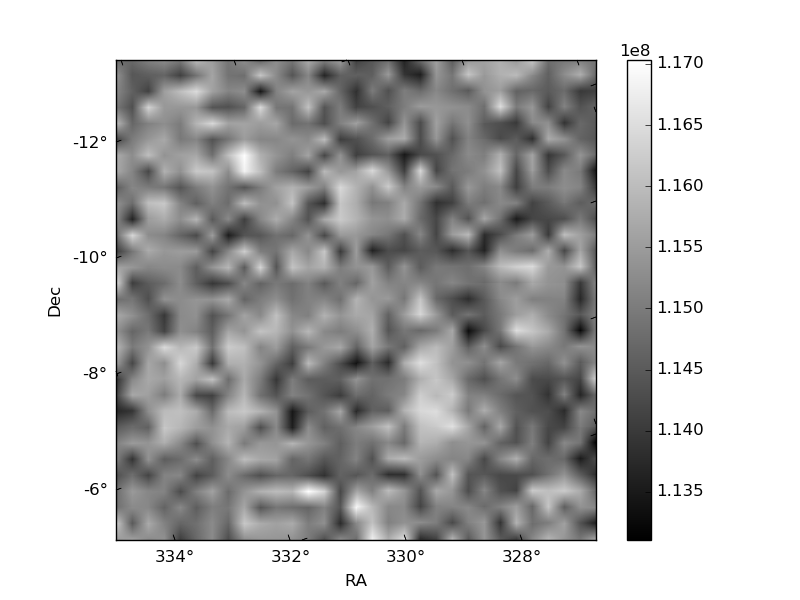
Histogram calculated using DETX and DETY for each event in the final _common_clean file
| Quadrant A | 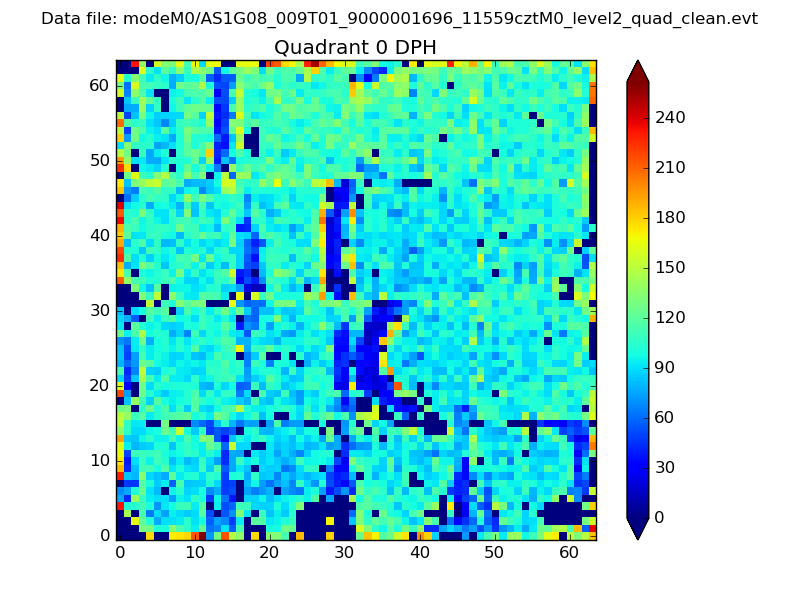 |
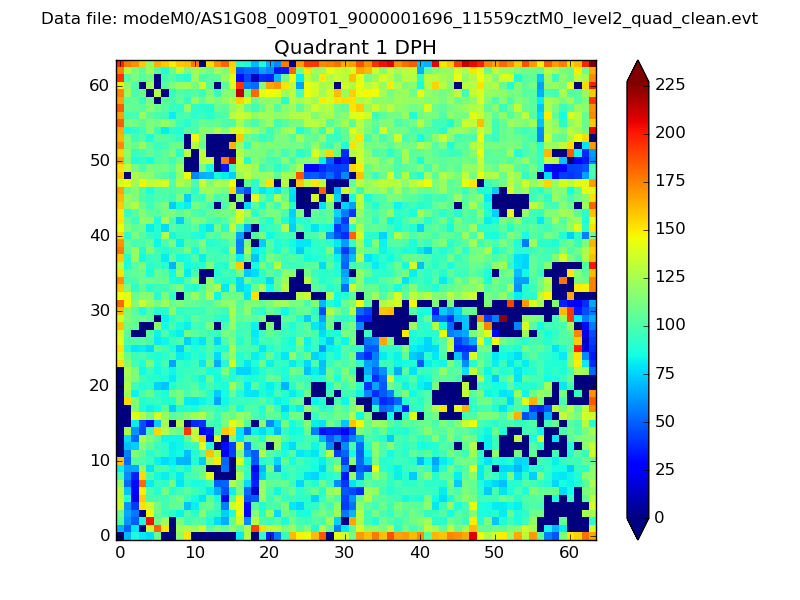 |
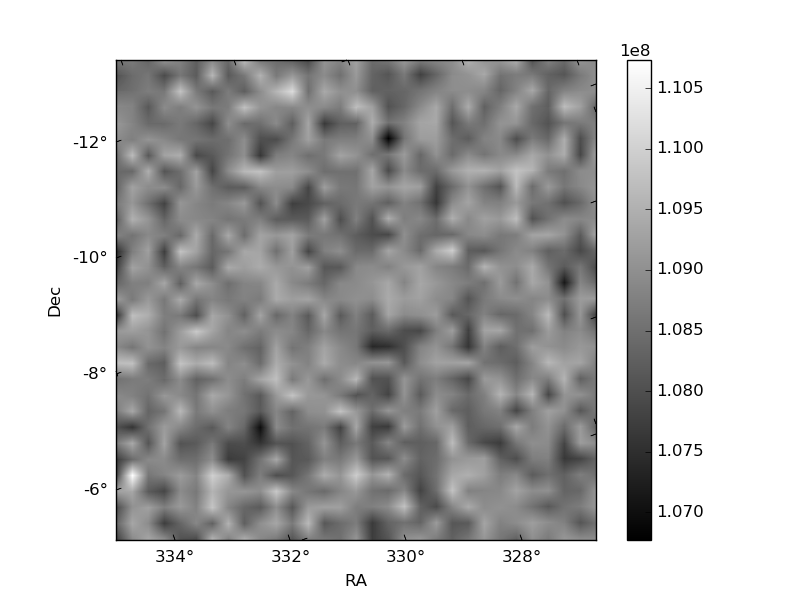
Quadrant B |
|---|---|---|---|
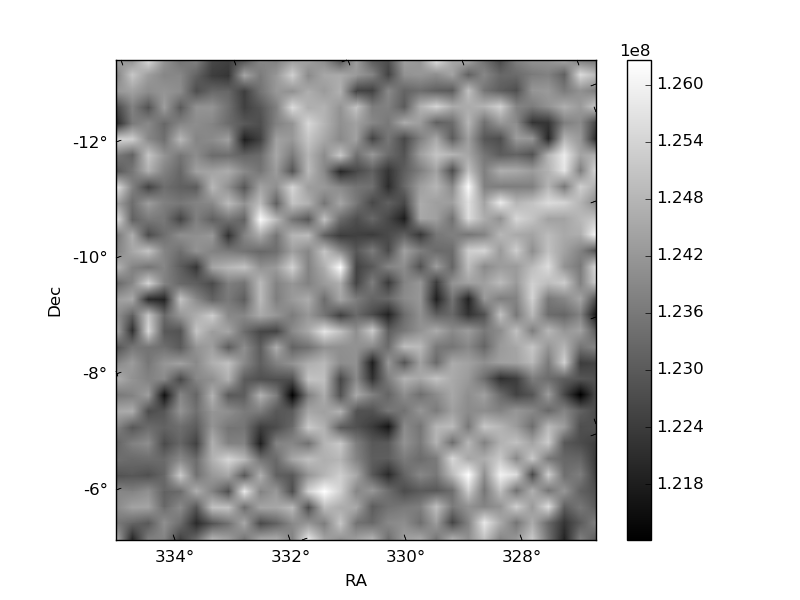
| Quadrant D | 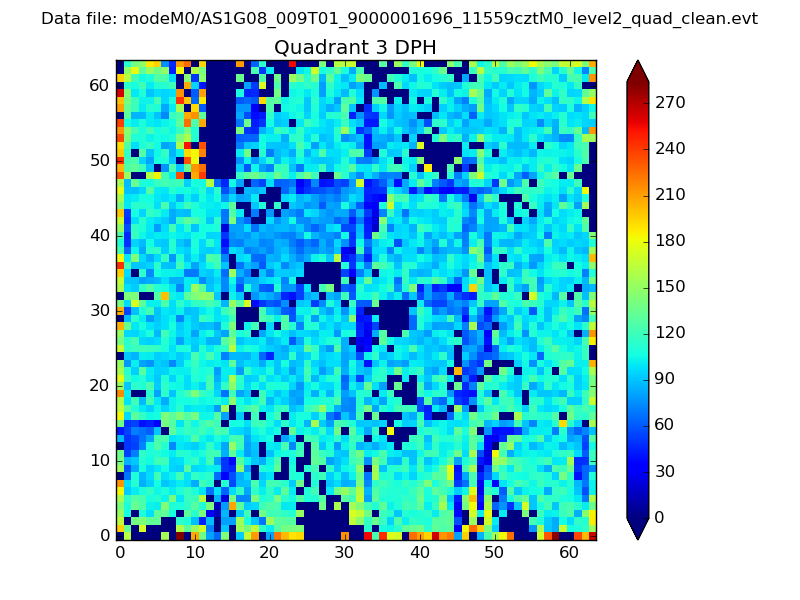 |
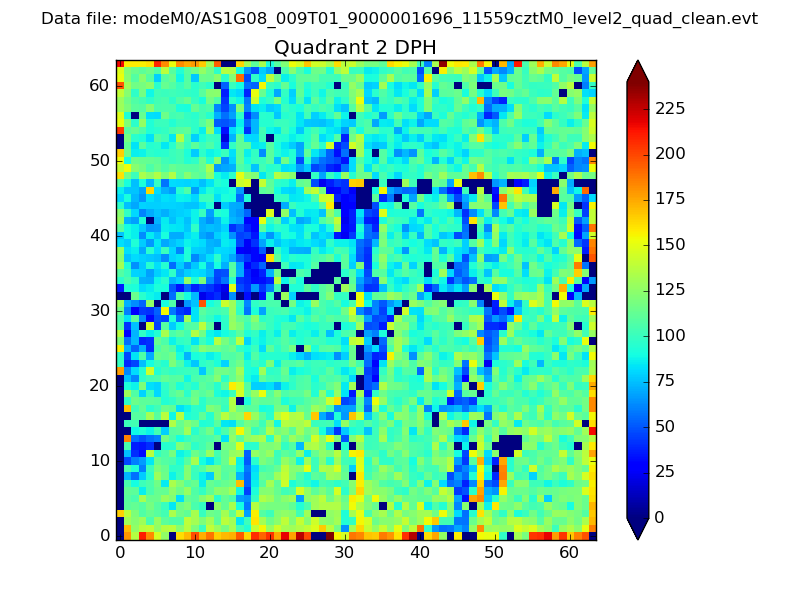 |
Quadrant C |
| Plot type | Count rate plots | Images |
|---|---|---|
| Comparison with Poisson distribution Blue bars denote a histogram of data divided into 1 sec bins. Red curve is a Poisson curve with rate = median count rate of data. |
 |
 |
| Quadrant-wise count rates Data is divided into 100 sec bins |
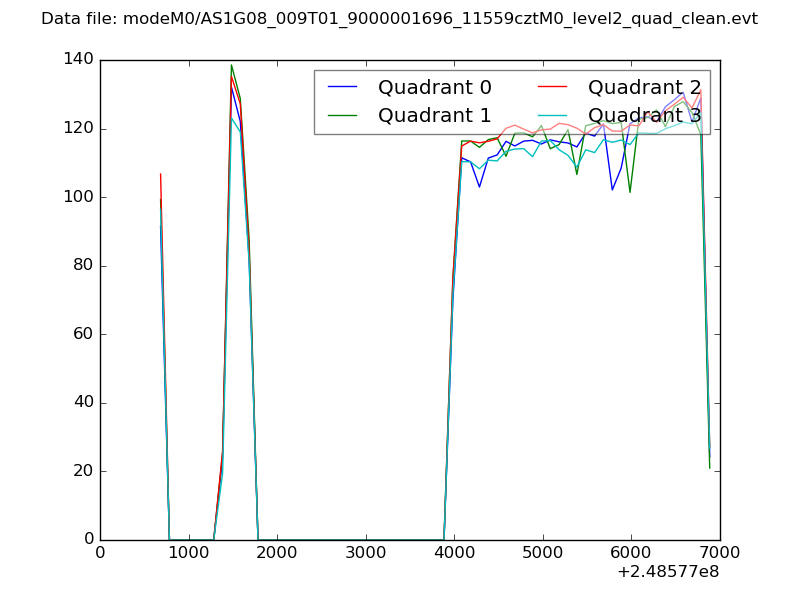 |
|
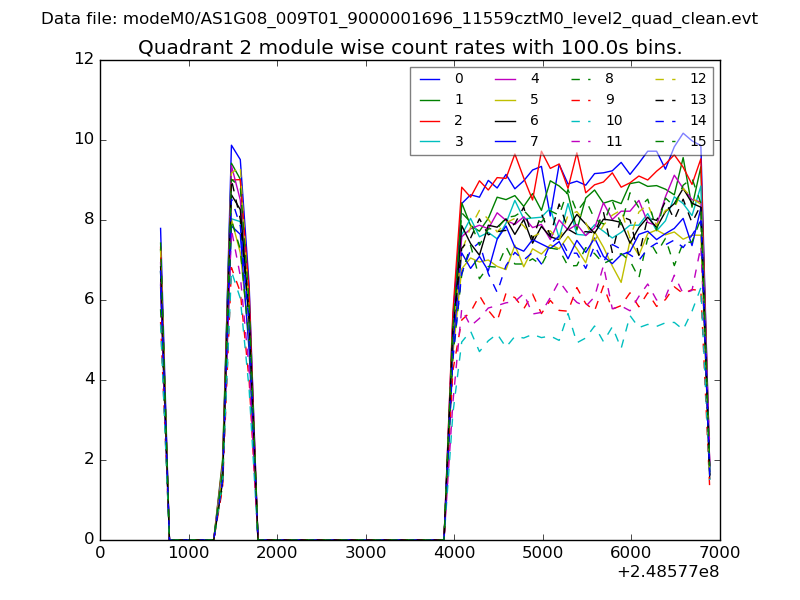
| Module-wise count rates for Quadrant A Data is divided into 100 sec bins |
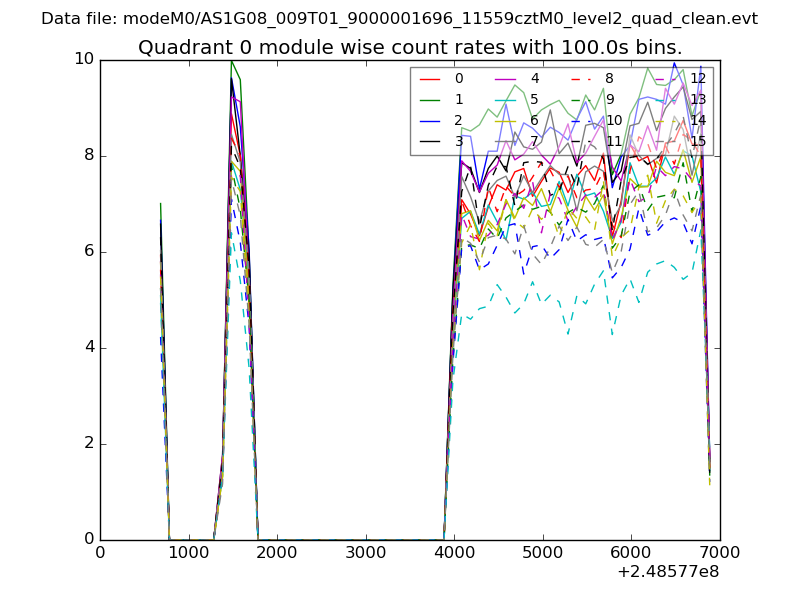 |
 |
| Module-wise count rates for Quadrant B Data is divided into 100 sec bins |
 |
 |
| Module-wise count rates for Quadrant C Data is divided into 100 sec bins |
 |
 |
| Module-wise count rates for Quadrant D Data is divided into 100 sec bins |
 |
 |
| Parameter | Plot |
|---|---|
| CZT HV Monitor | 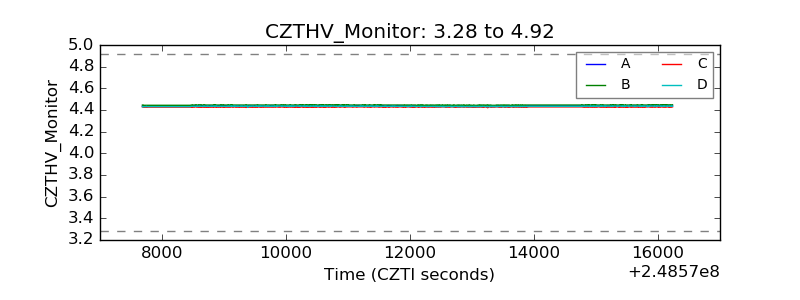 |
| D_VDD |  |
| Temperature 1 | 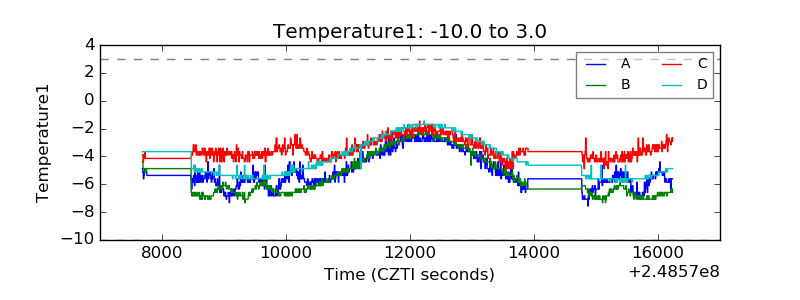 |
| Veto HV Monitor | 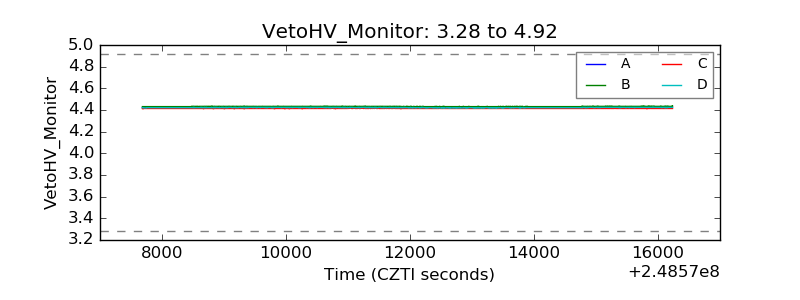 |
| Veto LLD | 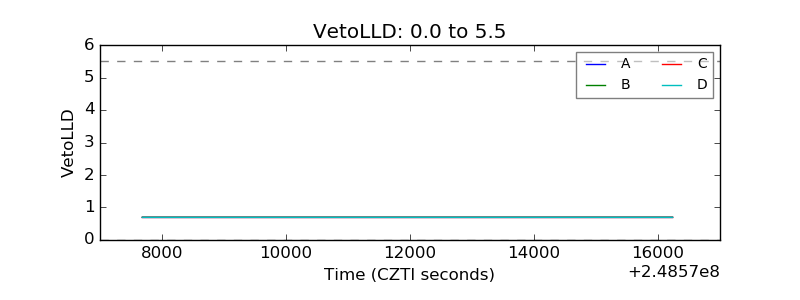 |
| Alpha Counter | 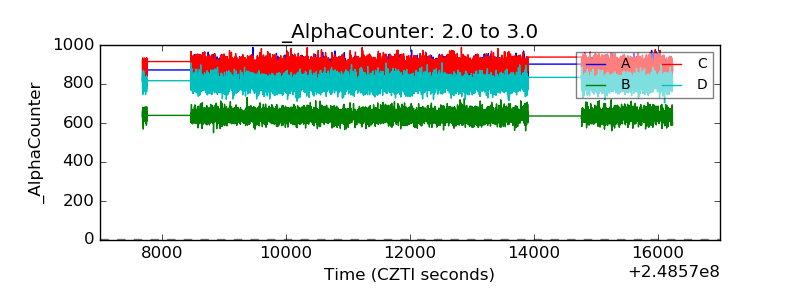 |
| _CPM_Rate | 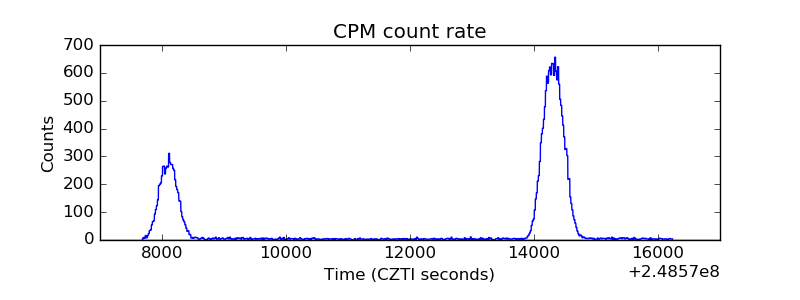 |
| CZT Counter | 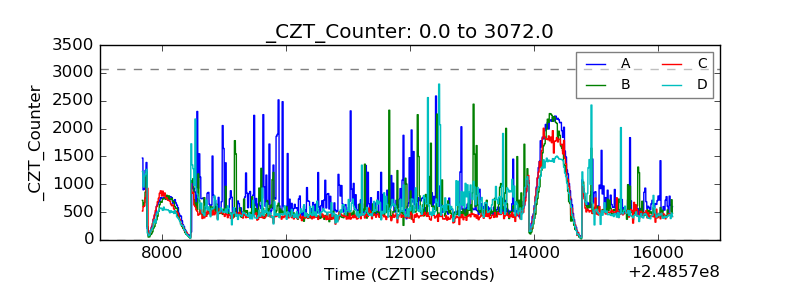 |
| +2.5 Volts monitor |  |
| +5 Volts monitor |  |
| _ROLL_ROT |  |
| _Roll_DEC |  |
| _Roll_RA | 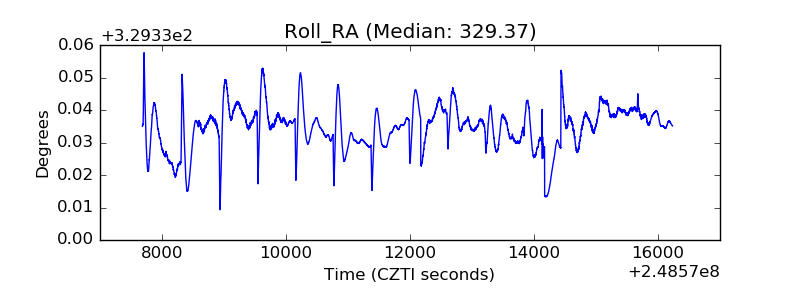 |
| Veto Counter | 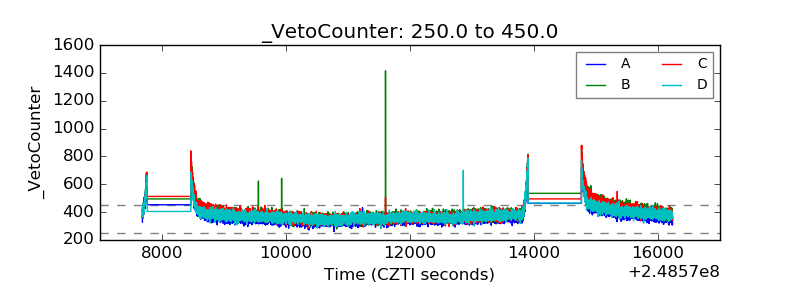 |