| Param | Original file | Final file |
|---|---|---|
| Filename | modeM0/AS1G08_009T01_9000001696_11560cztM0_level2.evt | modeM0/AS1G08_009T01_9000001696_11560cztM0_level2_quad_clean.evt |
| Size (bytes) | 568,540,800 | 65,010,240 |
| Size | 542.2 MB | 62.0 MB |
| Events in quadrant A | 5,061,903 | 374,265 |
| Events in quadrant B | 4,221,879 | 379,868 |
| Events in quadrant C | 3,076,255 | 386,586 |
| Events in quadrant D | 4,408,443 | 364,216 |
| Mode SS | |||
|---|---|---|---|
| Quadrant | BADHDUFLAG | Total packets | Discarded packets |
| A | 0 | 136 | 0 |
| B | 0 | 136 | 0 |
| C | 0 | 136 | 0 |
| D | 0 | 136 | 0 |
| Mode M9 | |||
|---|---|---|---|
| Quadrant | BADHDUFLAG | Total packets | Discarded packets |
| A | 0 | 15 | 0 |
| B | 0 | 15 | 0 |
| C | 0 | 15 | 0 |
| D | 0 | 16 | 0 |
| Mode M0 | |||
|---|---|---|---|
| Quadrant | BADHDUFLAG | Total packets | Discarded packets |
| A | 0 | 19545 | 3 |
| B | 0 | 16757 | 2 |
| C | 0 | 13601 | 2 |
| D | 0 | 17542 | 2 |
| Quadrant | Total seconds | Saturated seconds | Saturation percentage |
|---|---|---|---|
| A | 6637 | 389 | 5.861082% |
| B | 6637 | 242 | 3.646226% |
| C | 6637 | 40 | 0.602682% |
| D | 6637 | 207 | 3.118879% |
Noise dominated data is calculated using 1-second bins in cleaned event files. If a bin has >2000 counts, and if more than 50% of those come from <1% of pixels, then it is considered to be noise-dominated and hence unusable.
| Quadrant | # 1 sec bins | Bins with >0 counts | Bins with >2000 counts | High rate bins dominated by noise | Noise dominated (total time) | Noise dominated (detector-on time) | Marked lightcurve |
|---|---|---|---|---|---|---|---|
| A | 7658 | 6639 | 198 | 198 | 2.59% | 2.98% |  |
| B | 7658 | 6639 | 116 | 116 | 1.51% | 1.75% | 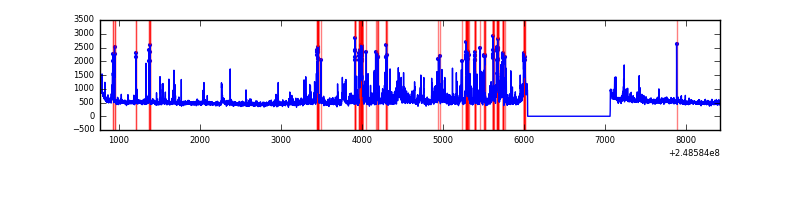 |
| C | 7658 | 6639 | 0 | 0 | 0.00% | 0.00% | 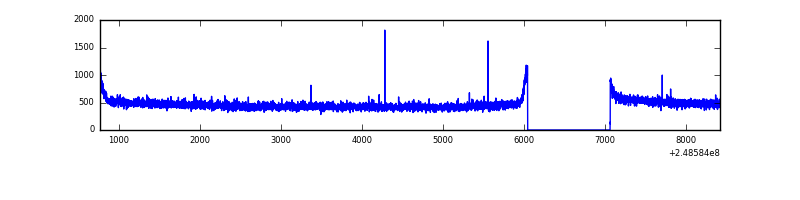 |
| D | 7658 | 6639 | 151 | 151 | 1.97% | 2.27% | 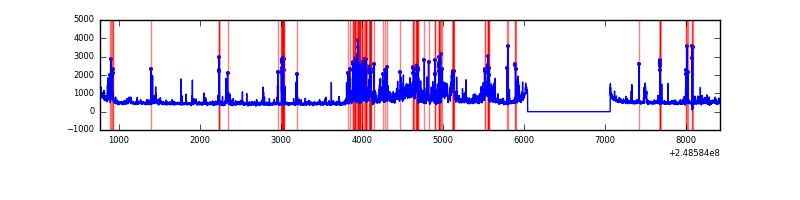 |
Top three noisy pixels from each quadrant. If the there are fewer than three noisy pixels in the level2.evt file, extra rows are filled as -1
| Pixel properties | Quadrant properties | ||||||
|---|---|---|---|---|---|---|---|
| Quadrant | DetID | PixID | Counts | Sigma | Mean | Median | Sigma |
| A | 8 | 5 | 1535899 | 9505.55 | 792 | 775 | 161.5 |
| A | 1 | 162 | 135849 | 836.38 | 792 | 775 | 161.5 |
| A | 1 | 178 | 86254 | 529.29 | 792 | 775 | 161.5 |
| B | 4 | 239 | 657824 | 4252.75 | 807 | 787 | 154.5 |
| B | 15 | 204 | 233214 | 1504.41 | 807 | 787 | 154.5 |
| B | 11 | 51 | 109025 | 700.58 | 807 | 787 | 154.5 |
| C | 13 | 61 | 5745 | 27.06 | 788 | 794 | 183.0 |
| C | 14 | 234 | 5249 | 24.35 | 788 | 794 | 183.0 |
| C | 3 | 202 | 1872 | 5.89 | 788 | 794 | 183.0 |
| D | 1 | 52 | 777630 | 4168.76 | 774 | 752 | 186.4 |
| D | 13 | 137 | 482780 | 2586.58 | 774 | 752 | 186.4 |
| D | 10 | 199 | 40126 | 211.28 | 774 | 752 | 186.4 |
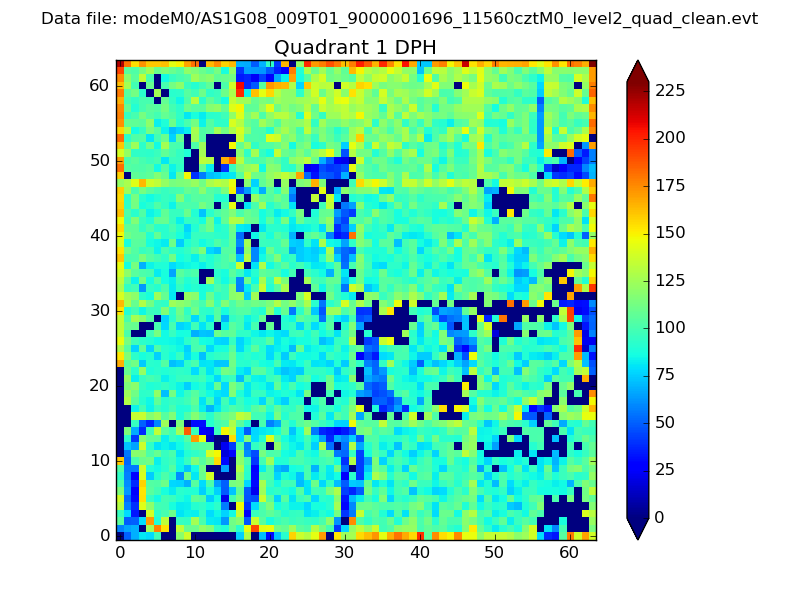
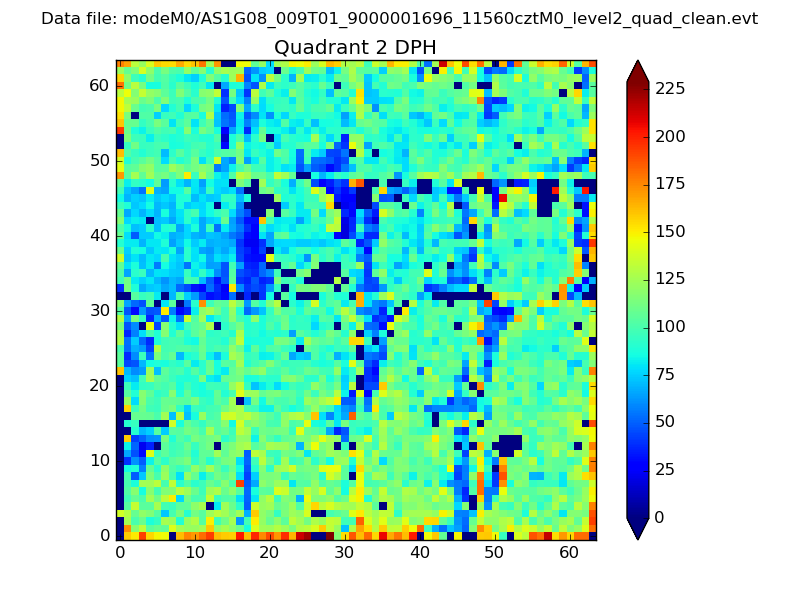
Histogram calculated using DETX and DETY for each event in the final _common_clean file
| Quadrant A | 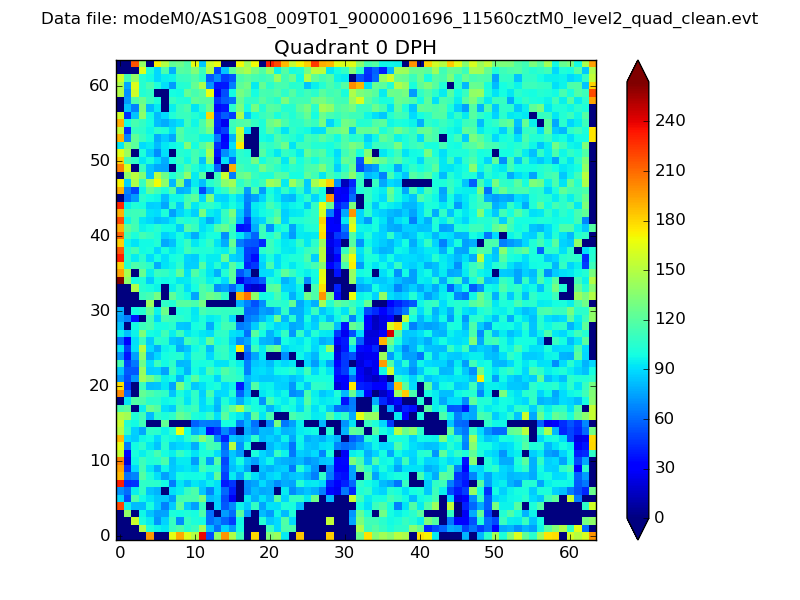 |
 |
Quadrant B |
|---|---|---|---|
| Quadrant D | 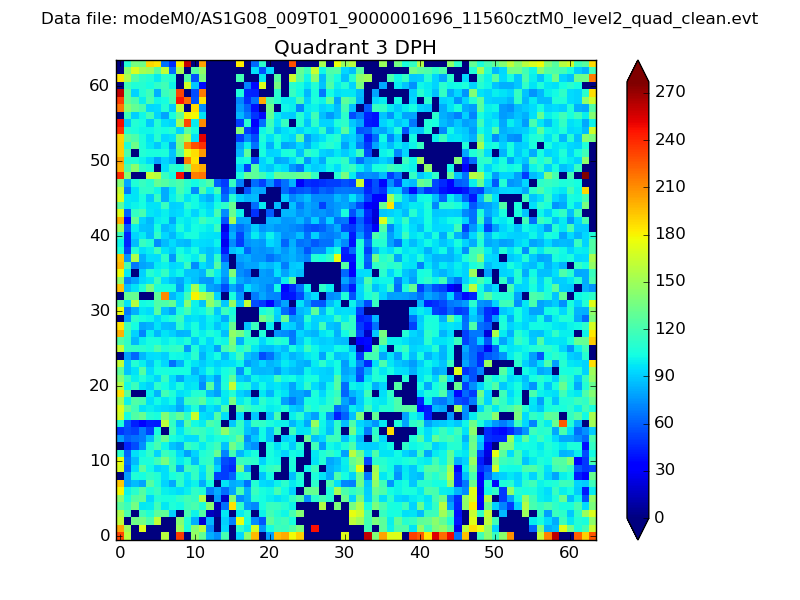 |
 |
Quadrant C |
| Plot type | Count rate plots | Images |
|---|---|---|
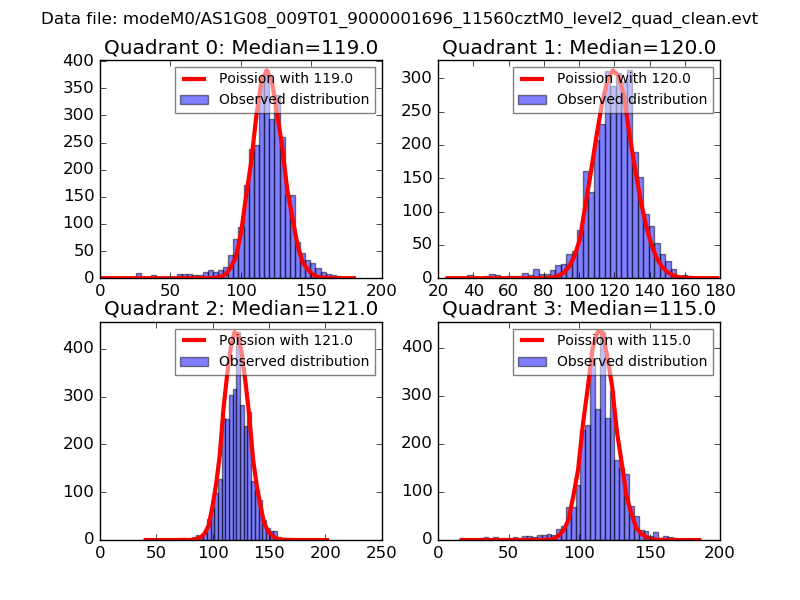
| Comparison with Poisson distribution Blue bars denote a histogram of data divided into 1 sec bins. Red curve is a Poisson curve with rate = median count rate of data. |
 |
 |
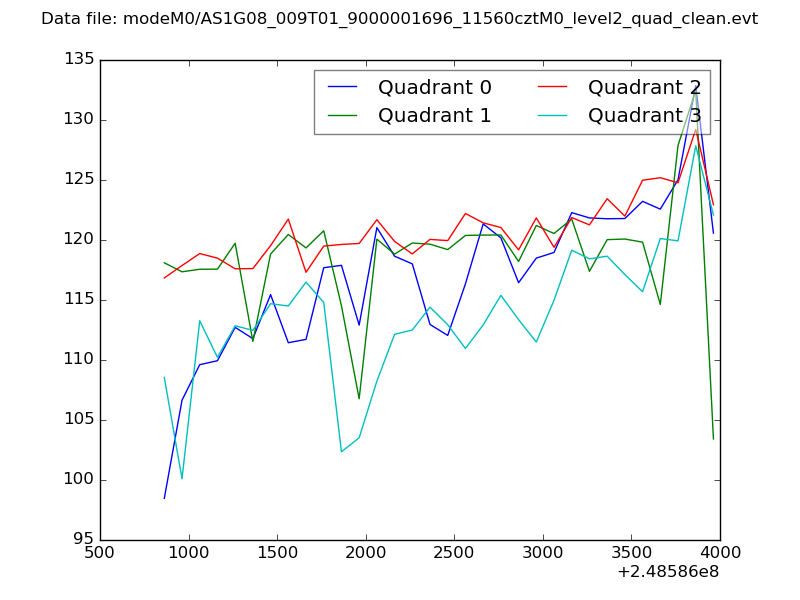
| Quadrant-wise count rates Data is divided into 100 sec bins |
 |
|
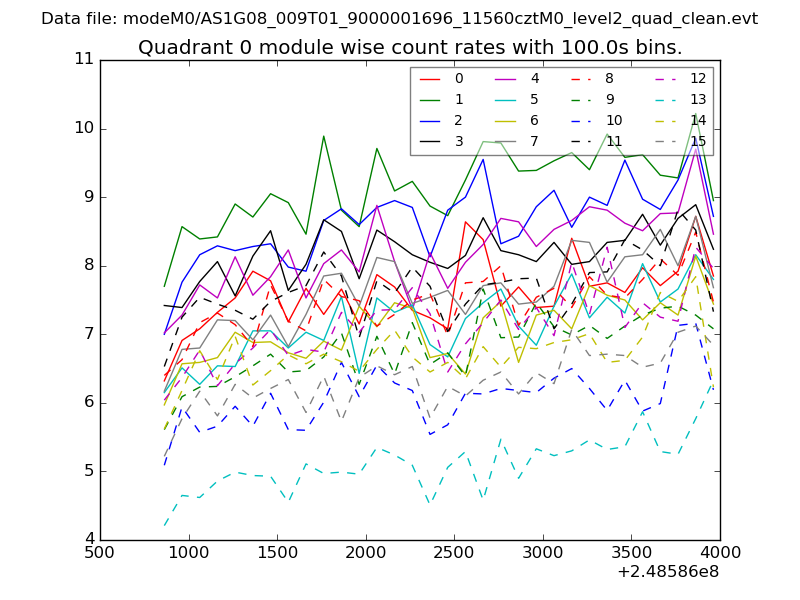
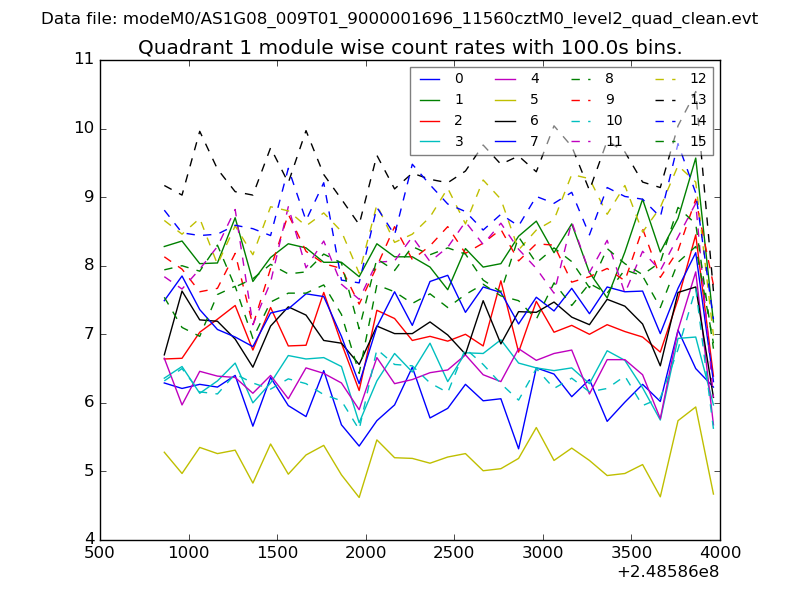
| Module-wise count rates for Quadrant A Data is divided into 100 sec bins |
 |
 |
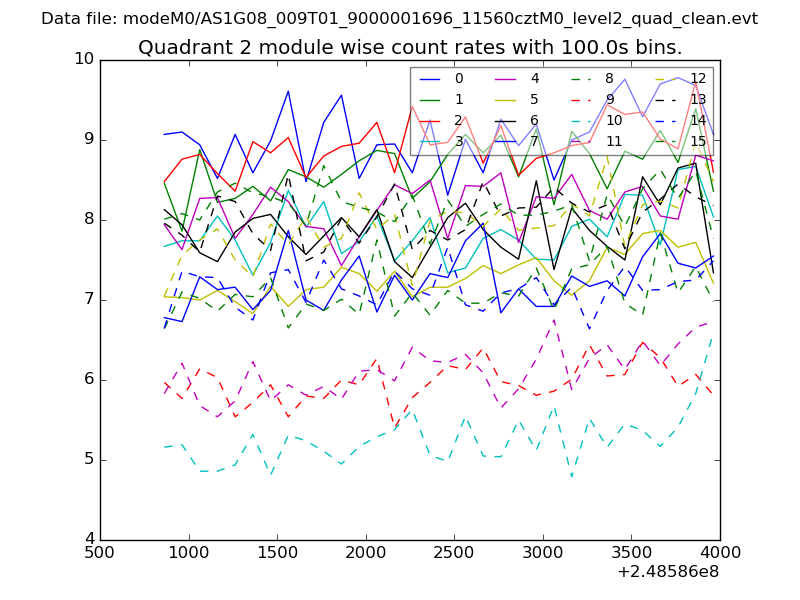
| Module-wise count rates for Quadrant B Data is divided into 100 sec bins |
 |
 |
| Module-wise count rates for Quadrant C Data is divided into 100 sec bins |
 |
 |
| Module-wise count rates for Quadrant D Data is divided into 100 sec bins |
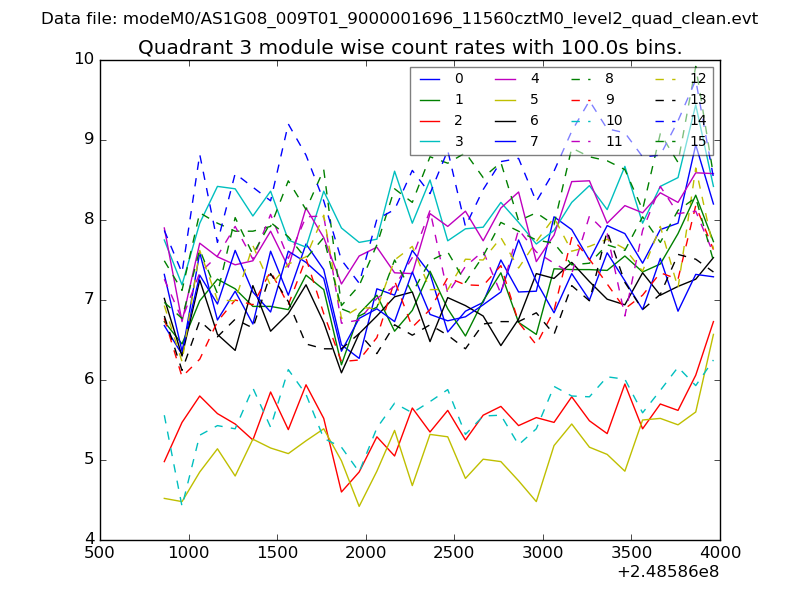 |
 |
| Parameter | Plot |
|---|---|
| CZT HV Monitor | 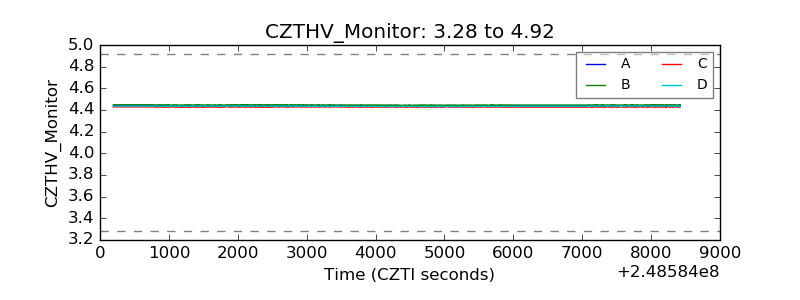 |
| D_VDD | 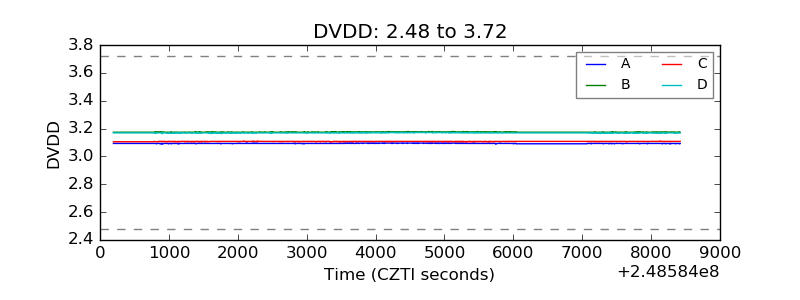 |
| Temperature 1 | 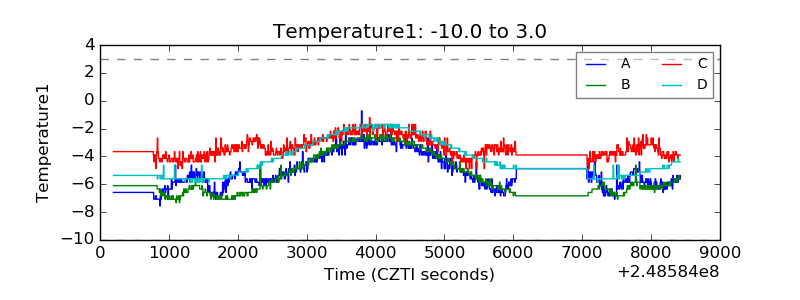 |
| Veto HV Monitor | 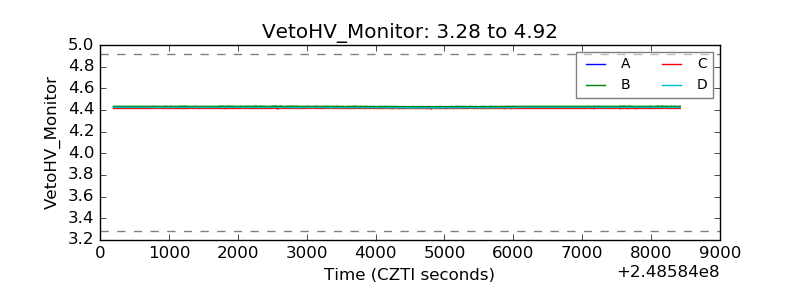 |
| Veto LLD | 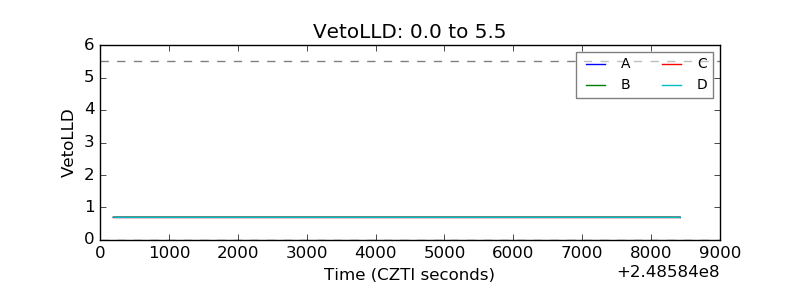 |
| Alpha Counter | 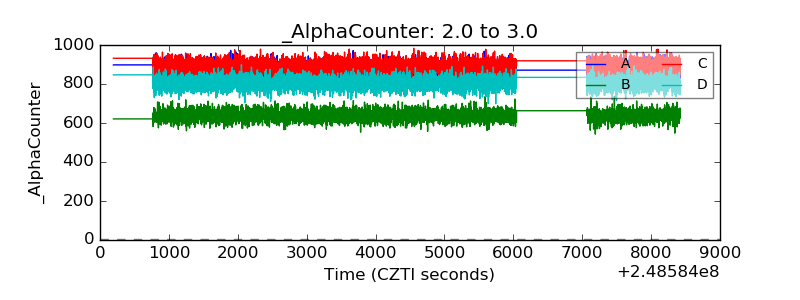 |
| _CPM_Rate | 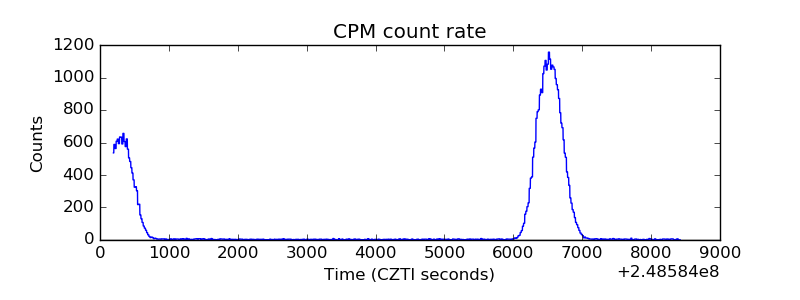 |
| CZT Counter | 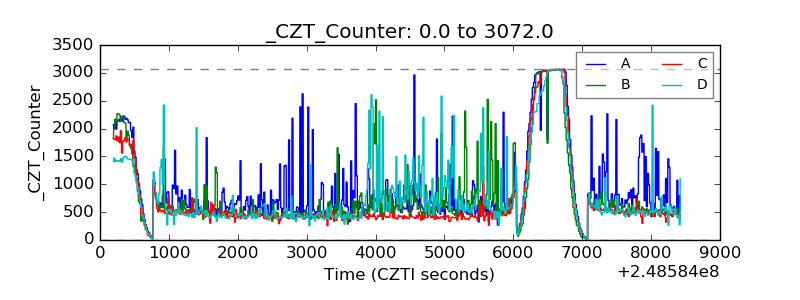 |
| +2.5 Volts monitor |  |
| +5 Volts monitor |  |
| _ROLL_ROT | 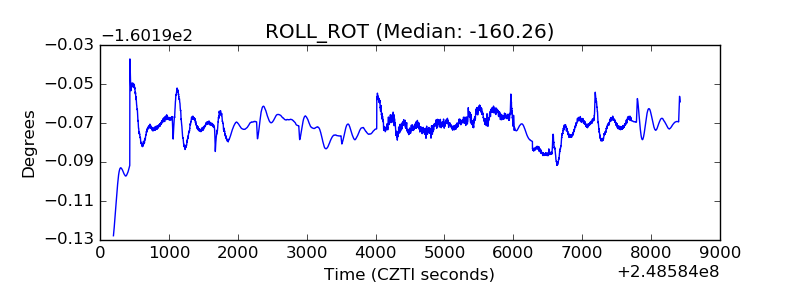 |
| _Roll_DEC | 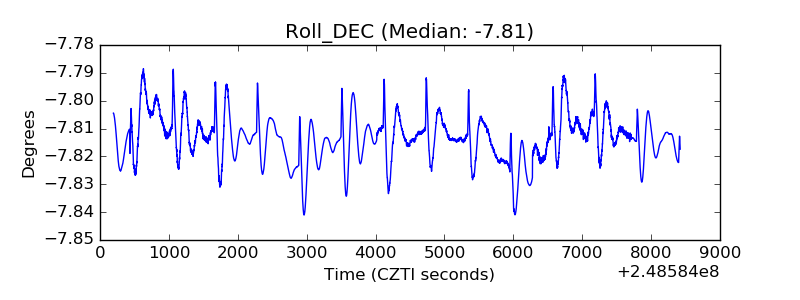 |
| _Roll_RA | 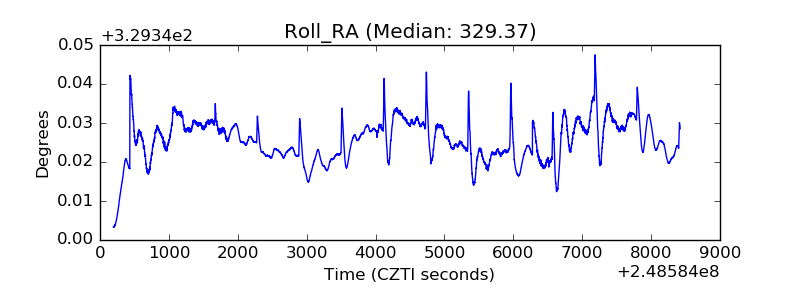 |
| Veto Counter | 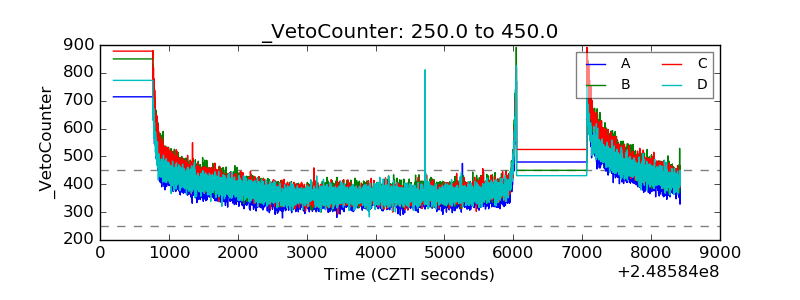 |