| Param | Original file | Final file |
|---|---|---|
| Filename | modeM0/AS1G08_009T01_9000001696_11562cztM0_level2.evt | modeM0/AS1G08_009T01_9000001696_11562cztM0_level2_quad_clean.evt |
| Size (bytes) | 585,279,360 | 73,172,160 |
| Size | 558.2 MB | 69.8 MB |
| Events in quadrant A | 5,363,522 | 424,645 |
| Events in quadrant B | 4,112,933 | 453,731 |
| Events in quadrant C | 3,134,575 | 455,588 |
| Events in quadrant D | 4,672,958 | 426,938 |
| Mode SS | |||
|---|---|---|---|
| Quadrant | BADHDUFLAG | Total packets | Discarded packets |
| A | 0 | 134 | 0 |
| B | 0 | 134 | 0 |
| C | 0 | 134 | 0 |
| D | 0 | 134 | 0 |
| Mode M9 | |||
|---|---|---|---|
| Quadrant | BADHDUFLAG | Total packets | Discarded packets |
| A | 0 | 17 | 0 |
| B | 0 | 17 | 0 |
| C | 0 | 17 | 0 |
| D | 0 | 18 | 0 |
| Mode M0 | |||
|---|---|---|---|
| Quadrant | BADHDUFLAG | Total packets | Discarded packets |
| A | 0 | 20386 | 3 |
| B | 0 | 16294 | 2 |
| C | 0 | 13596 | 2 |
| D | 0 | 18135 | 2 |
| Quadrant | Total seconds | Saturated seconds | Saturation percentage |
|---|---|---|---|
| A | 6509 | 565 | 8.680289% |
| B | 6509 | 223 | 3.426026% |
| C | 6509 | 57 | 0.875711% |
| D | 6509 | 282 | 4.332463% |
Noise dominated data is calculated using 1-second bins in cleaned event files. If a bin has >2000 counts, and if more than 50% of those come from <1% of pixels, then it is considered to be noise-dominated and hence unusable.
| Quadrant | # 1 sec bins | Bins with >0 counts | Bins with >2000 counts | High rate bins dominated by noise | Noise dominated (total time) | Noise dominated (detector-on time) | Marked lightcurve |
|---|---|---|---|---|---|---|---|
| A | 7645 | 6511 | 274 | 274 | 3.58% | 4.21% | 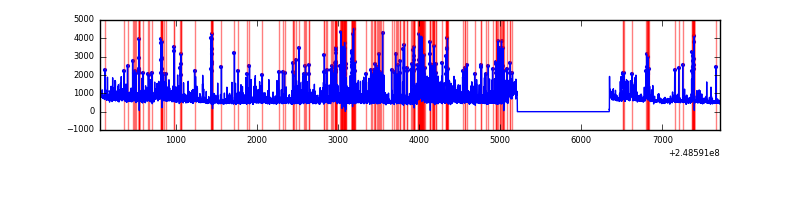 |
| B | 7645 | 6511 | 92 | 92 | 1.20% | 1.41% | 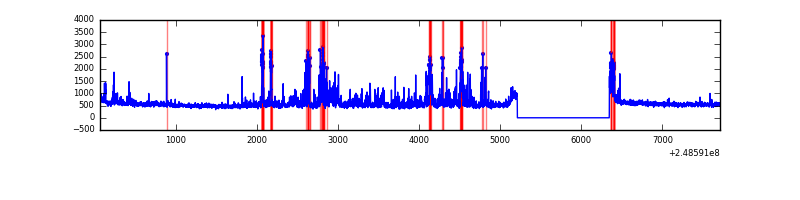 |
| C | 7645 | 6511 | 1 | 1 | 0.01% | 0.02% | 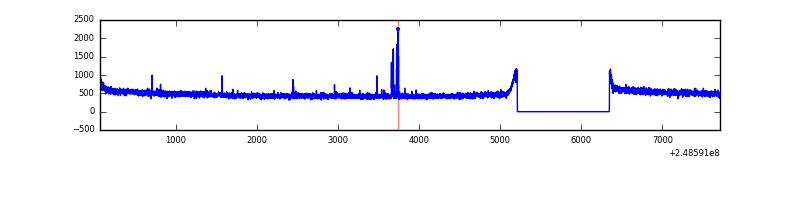 |
| D | 7645 | 6511 | 238 | 238 | 3.11% | 3.66% | 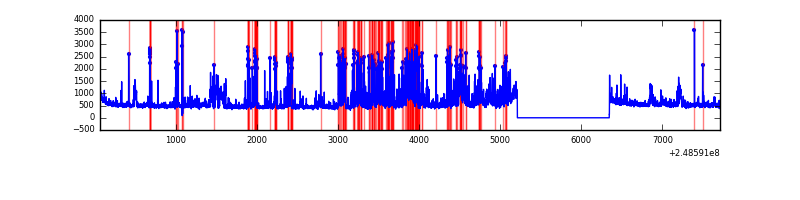 |
Top three noisy pixels from each quadrant. If the there are fewer than three noisy pixels in the level2.evt file, extra rows are filled as -1
| Pixel properties | Quadrant properties | ||||||
|---|---|---|---|---|---|---|---|
| Quadrant | DetID | PixID | Counts | Sigma | Mean | Median | Sigma |
| A | 8 | 5 | 1966817 | 12248.7 | 789 | 775 | 160.5 |
| A | 1 | 162 | 94215 | 582.14 | 789 | 775 | 160.5 |
| A | 1 | 178 | 65584 | 403.77 | 789 | 775 | 160.5 |
| B | 4 | 239 | 559558 | 3594.11 | 818 | 800 | 155.5 |
| B | 15 | 204 | 221755 | 1421.25 | 818 | 800 | 155.5 |
| B | 11 | 51 | 89481 | 570.42 | 818 | 800 | 155.5 |
| C | 9 | 54 | 30354 | 160.7 | 794 | 802 | 183.9 |
| C | 0 | 10 | 8764 | 43.3 | 794 | 802 | 183.9 |
| C | 13 | 61 | 5813 | 27.25 | 794 | 802 | 183.9 |
| D | 1 | 52 | 989578 | 5224.16 | 787 | 765 | 189.3 |
| D | 13 | 137 | 518615 | 2735.94 | 787 | 765 | 189.3 |
| D | 2 | 14 | 41095 | 213.07 | 787 | 765 | 189.3 |
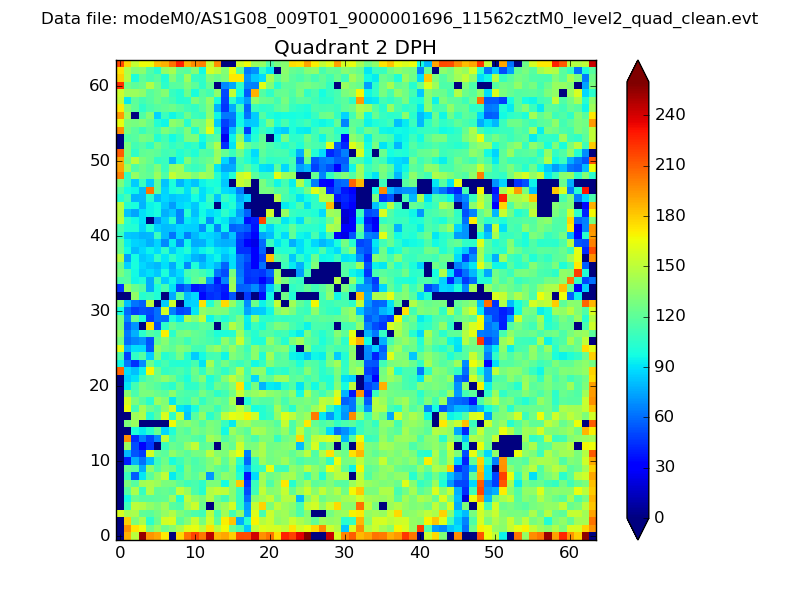
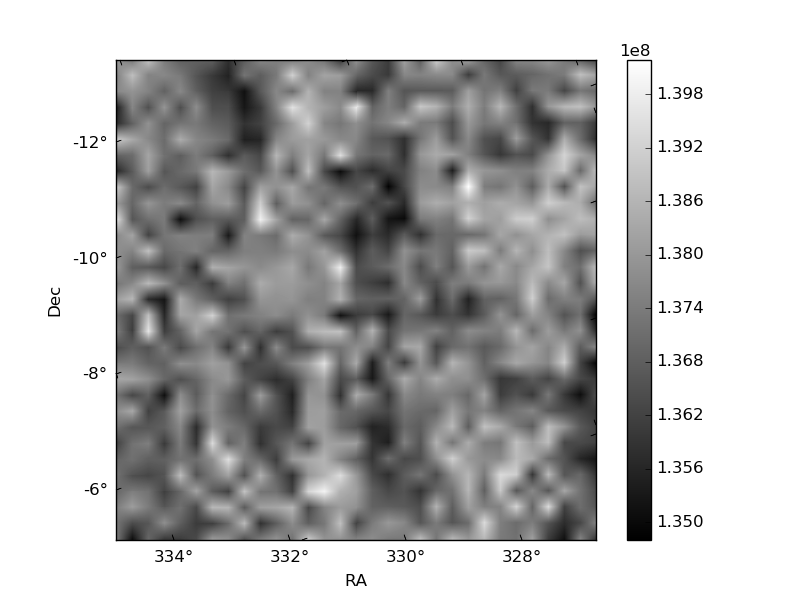
Histogram calculated using DETX and DETY for each event in the final _common_clean file
| Quadrant A | 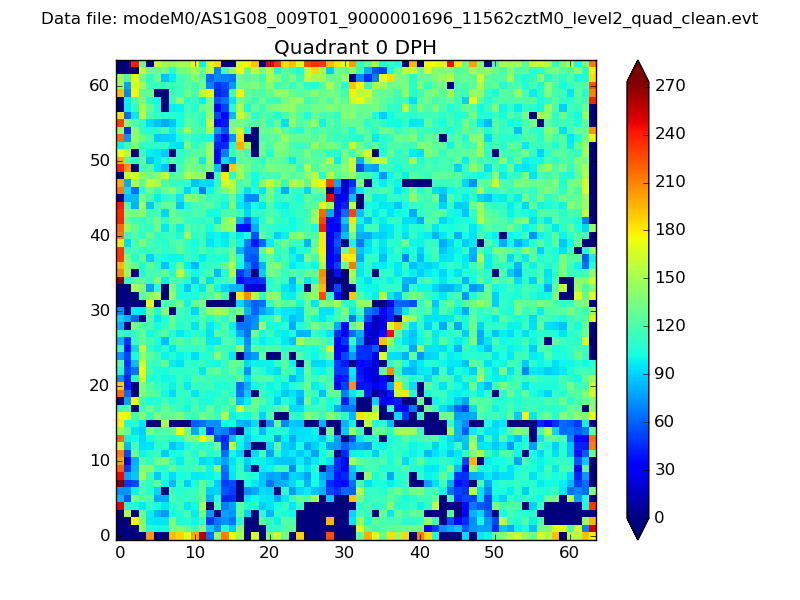 |
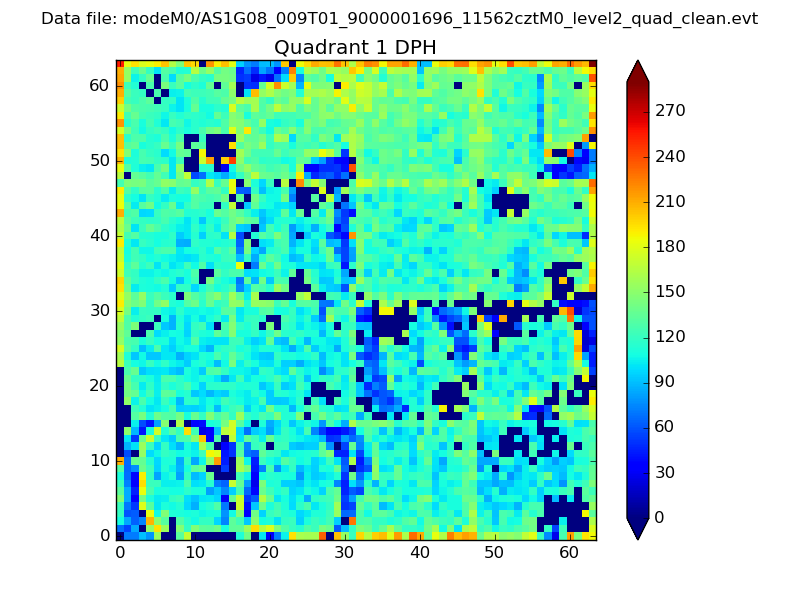 |
Quadrant B |
|---|---|---|---|
| Quadrant D | 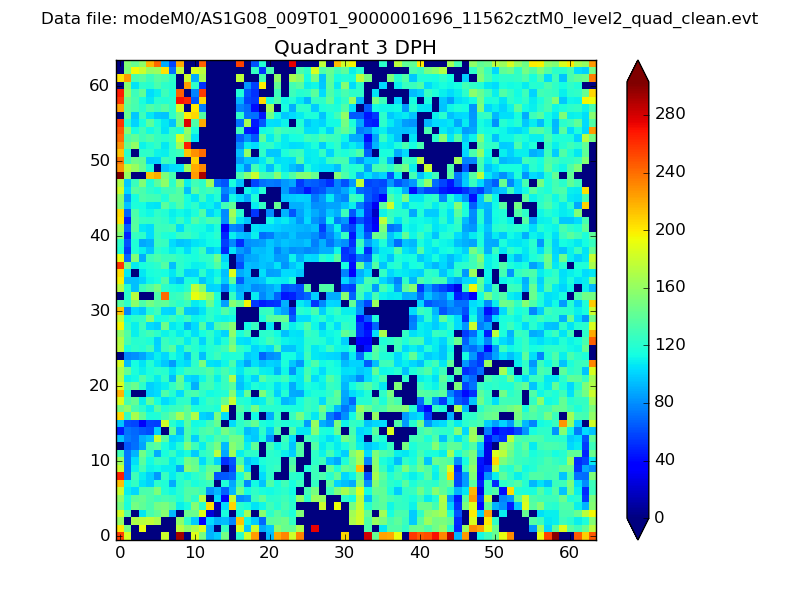 |
 |
Quadrant C |
| Plot type | Count rate plots | Images |
|---|---|---|
| Comparison with Poisson distribution Blue bars denote a histogram of data divided into 1 sec bins. Red curve is a Poisson curve with rate = median count rate of data. |
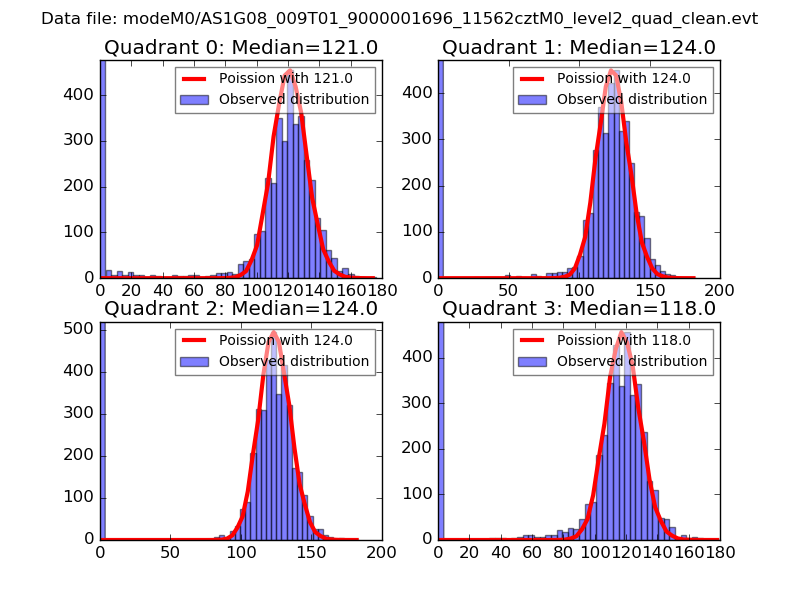 |
 |
| Quadrant-wise count rates Data is divided into 100 sec bins |
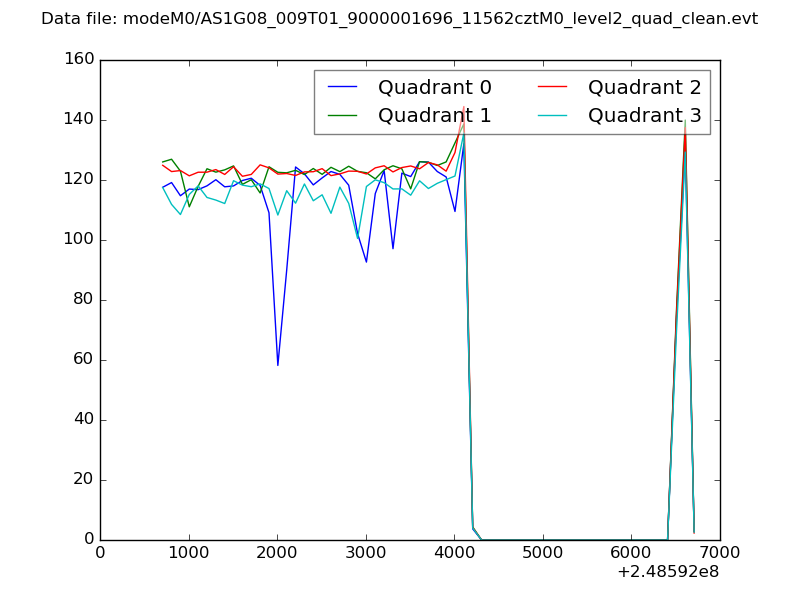 |
|
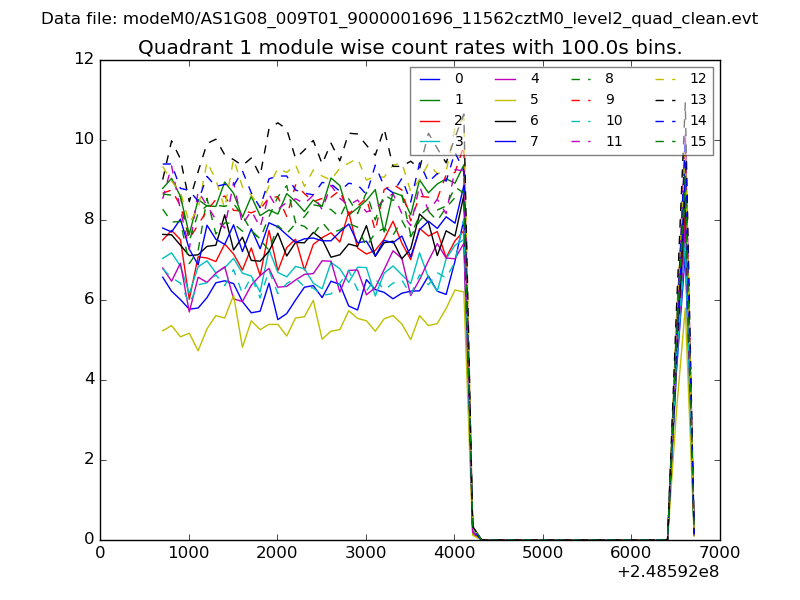
| Module-wise count rates for Quadrant A Data is divided into 100 sec bins |
 |
 |
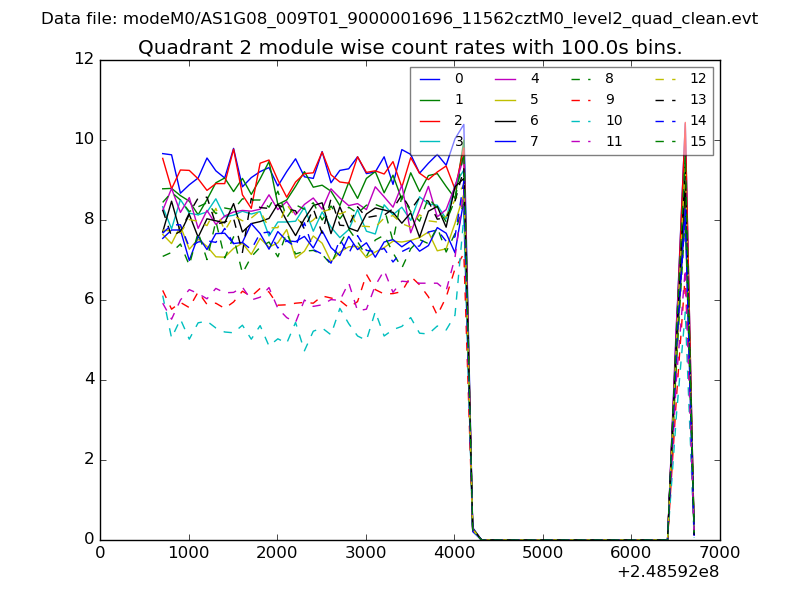
| Module-wise count rates for Quadrant B Data is divided into 100 sec bins |
 |
 |
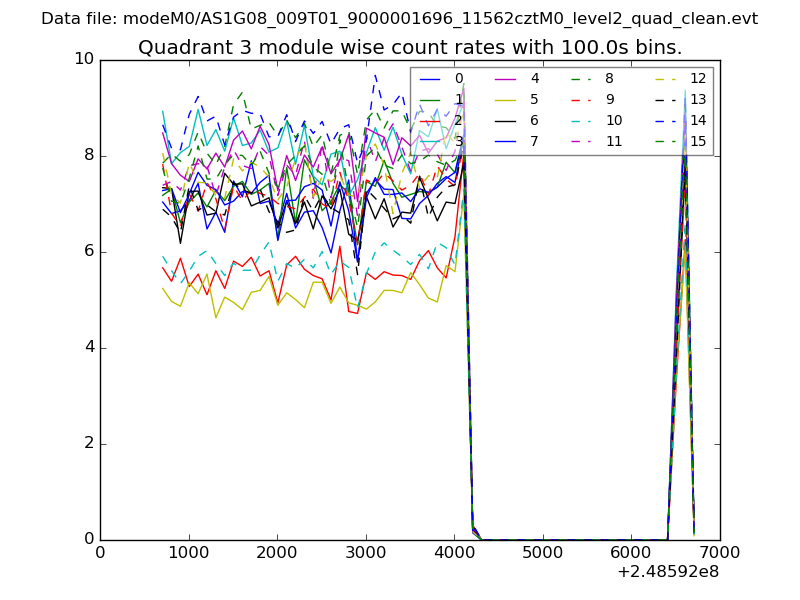
| Module-wise count rates for Quadrant C Data is divided into 100 sec bins |
 |
 |
| Module-wise count rates for Quadrant D Data is divided into 100 sec bins |
 |
 |
| Parameter | Plot |
|---|---|
| CZT HV Monitor | 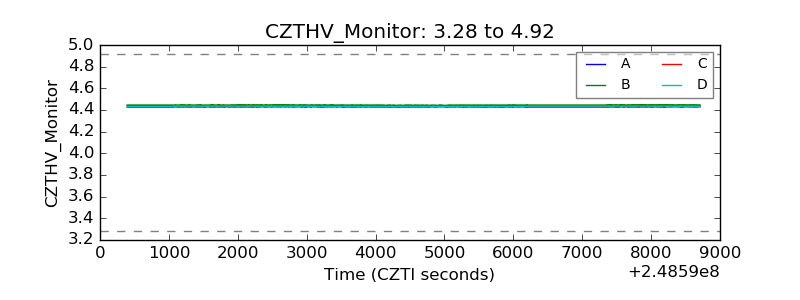 |
| D_VDD | 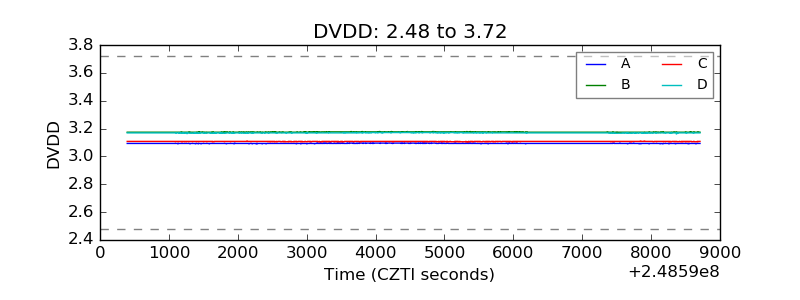 |
| Temperature 1 | 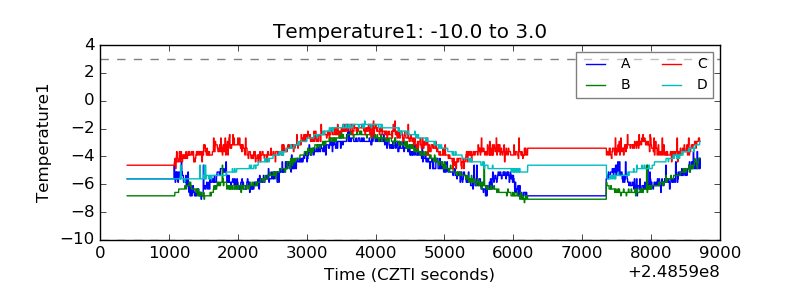 |
| Veto HV Monitor | 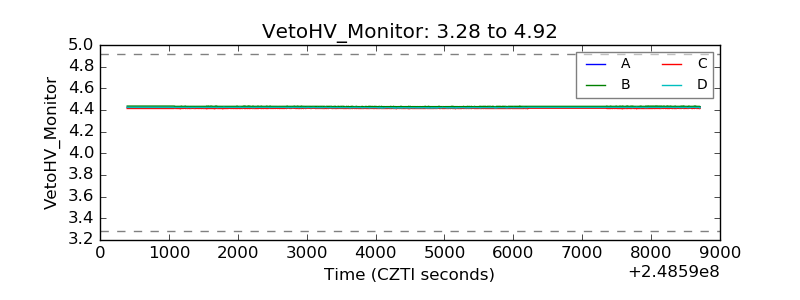 |
| Veto LLD | 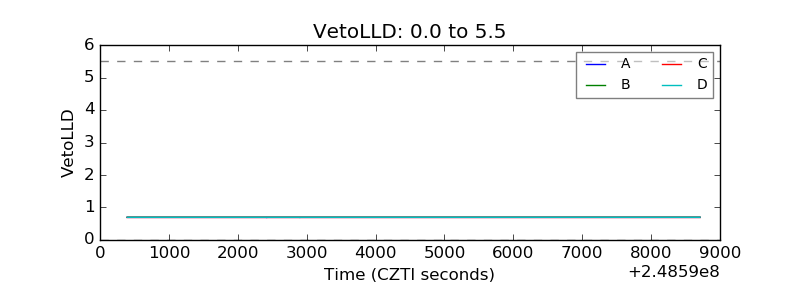 |
| Alpha Counter | 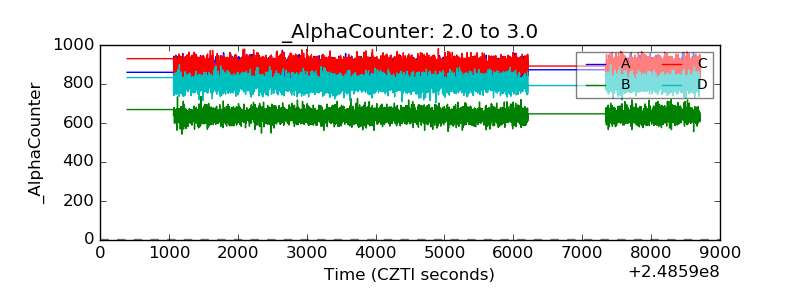 |
| _CPM_Rate | 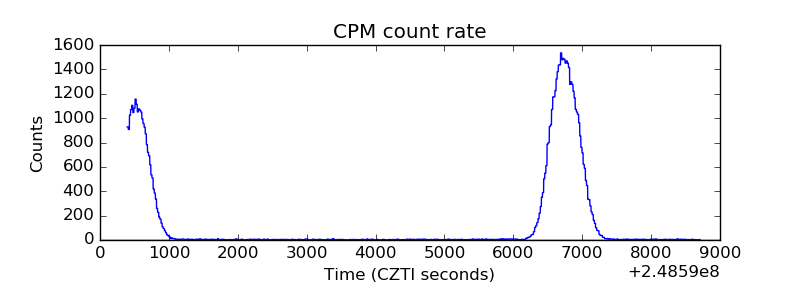 |
| CZT Counter | 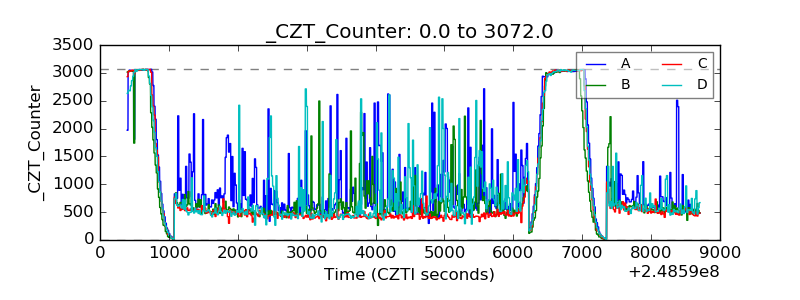 |
| +2.5 Volts monitor |  |
| +5 Volts monitor |  |
| _ROLL_ROT | 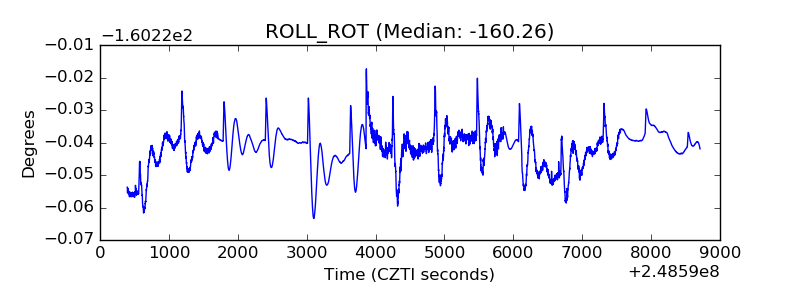 |
| _Roll_DEC | 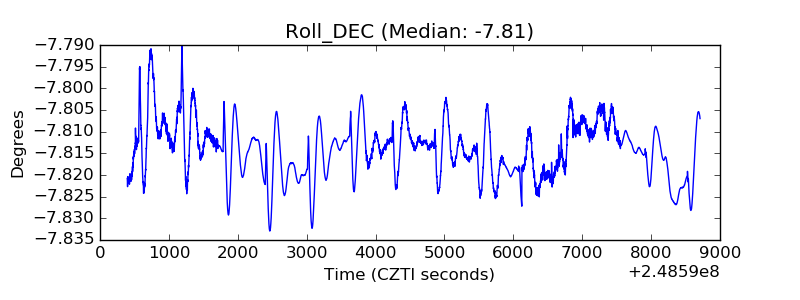 |
| _Roll_RA | 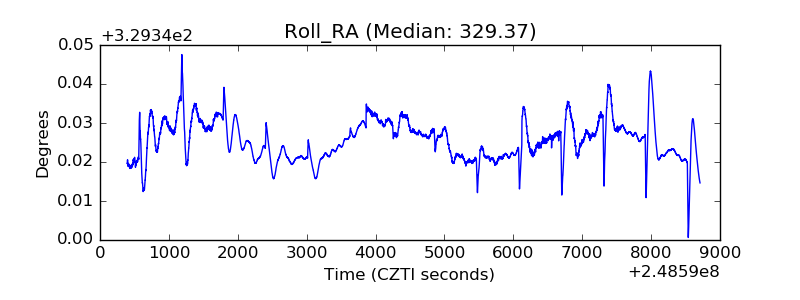 |
| Veto Counter | 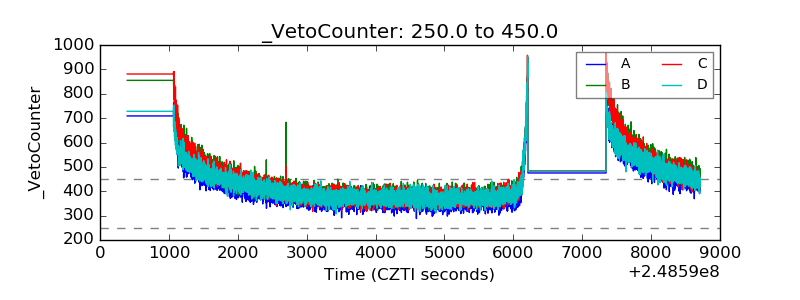 |