| Param | Original file | Final file |
|---|---|---|
| Filename | modeM0/AS1G08_009T01_9000001696_11563cztM0_level2.evt | modeM0/AS1G08_009T01_9000001696_11563cztM0_level2_quad_clean.evt |
| Size (bytes) | 555,050,880 | 83,183,040 |
| Size | 529.3 MB | 79.3 MB |
| Events in quadrant A | 5,124,297 | 513,473 |
| Events in quadrant B | 4,298,713 | 528,157 |
| Events in quadrant C | 3,101,611 | 531,383 |
| Events in quadrant D | 3,858,256 | 506,109 |
| Mode SS | |||
|---|---|---|---|
| Quadrant | BADHDUFLAG | Total packets | Discarded packets |
| A | 0 | 126 | 0 |
| B | 0 | 126 | 0 |
| C | 0 | 126 | 0 |
| D | 0 | 126 | 0 |
| Mode M9 | |||
|---|---|---|---|
| Quadrant | BADHDUFLAG | Total packets | Discarded packets |
| A | 0 | 13 | 0 |
| B | 0 | 13 | 0 |
| C | 0 | 13 | 0 |
| D | 0 | 13 | 0 |
| Mode M0 | |||
|---|---|---|---|
| Quadrant | BADHDUFLAG | Total packets | Discarded packets |
| A | 0 | 19514 | 3 |
| B | 0 | 16882 | 2 |
| C | 0 | 13308 | 2 |
| D | 0 | 15514 | 2 |
| Quadrant | Total seconds | Saturated seconds | Saturation percentage |
|---|---|---|---|
| A | 6307 | 455 | 7.214206% |
| B | 6307 | 310 | 4.915174% |
| C | 6307 | 65 | 1.030601% |
| D | 6308 | 135 | 2.140140% |
Noise dominated data is calculated using 1-second bins in cleaned event files. If a bin has >2000 counts, and if more than 50% of those come from <1% of pixels, then it is considered to be noise-dominated and hence unusable.
| Quadrant | # 1 sec bins | Bins with >0 counts | Bins with >2000 counts | High rate bins dominated by noise | Noise dominated (total time) | Noise dominated (detector-on time) | Marked lightcurve |
|---|---|---|---|---|---|---|---|
| A | 7533 | 6309 | 245 | 245 | 3.25% | 3.88% | 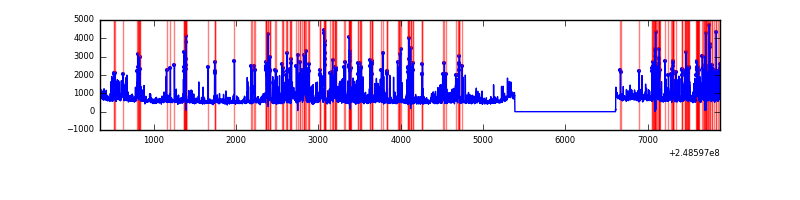 |
| B | 7533 | 6309 | 153 | 153 | 2.03% | 2.43% | 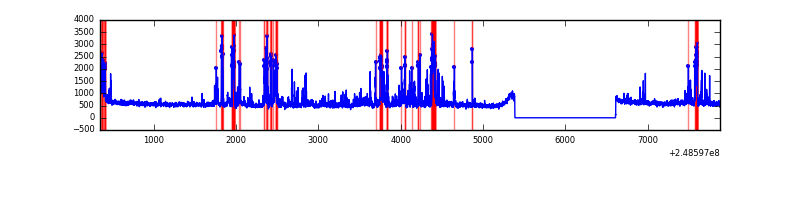 |
| C | 7533 | 6309 | 0 | 0 | 0.00% | 0.00% | 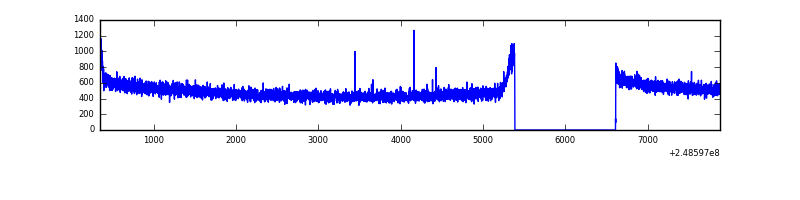 |
| D | 7534 | 6310 | 89 | 89 | 1.18% | 1.41% | 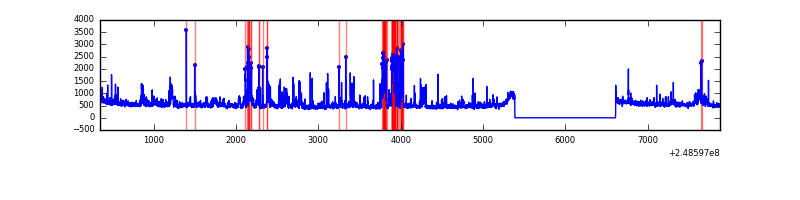 |
Top three noisy pixels from each quadrant. If the there are fewer than three noisy pixels in the level2.evt file, extra rows are filled as -1
| Pixel properties | Quadrant properties | ||||||
|---|---|---|---|---|---|---|---|
| Quadrant | DetID | PixID | Counts | Sigma | Mean | Median | Sigma |
| A | 8 | 5 | 1777699 | 10915.58 | 808 | 795 | 162.8 |
| A | 1 | 162 | 58549 | 354.78 | 808 | 795 | 162.8 |
| A | 1 | 178 | 36642 | 220.21 | 808 | 795 | 162.8 |
| B | 4 | 239 | 693288 | 4518.45 | 815 | 798 | 153.3 |
| B | 15 | 204 | 248551 | 1616.57 | 815 | 798 | 153.3 |
| B | 11 | 51 | 89676 | 579.92 | 815 | 798 | 153.3 |
| C | 0 | 10 | 8751 | 43.4 | 793 | 800 | 183.2 |
| C | 13 | 61 | 5687 | 26.68 | 793 | 800 | 183.2 |
| C | 9 | 54 | 3207 | 13.14 | 793 | 800 | 183.2 |
| D | 1 | 52 | 384035 | 2026.27 | 795 | 776 | 189.1 |
| D | 13 | 137 | 162771 | 856.46 | 795 | 776 | 189.1 |
| D | 13 | 152 | 101368 | 531.82 | 795 | 776 | 189.1 |
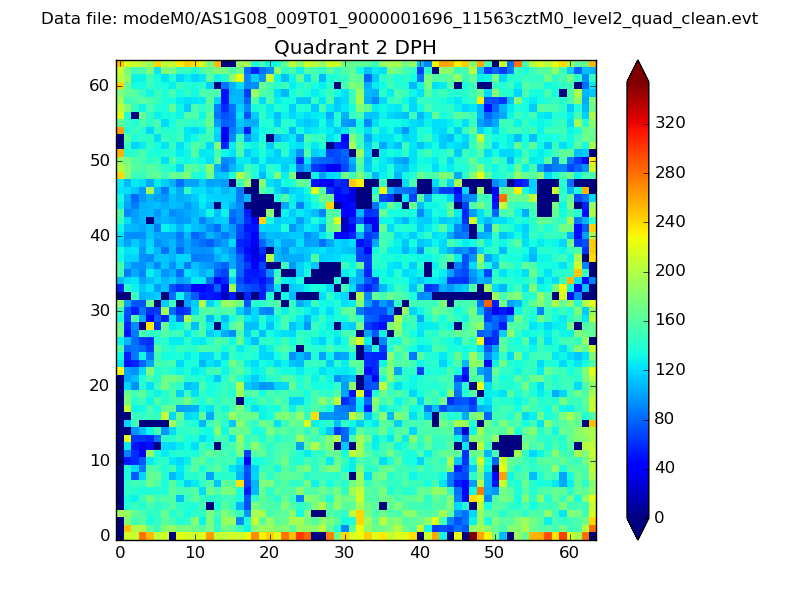
Histogram calculated using DETX and DETY for each event in the final _common_clean file
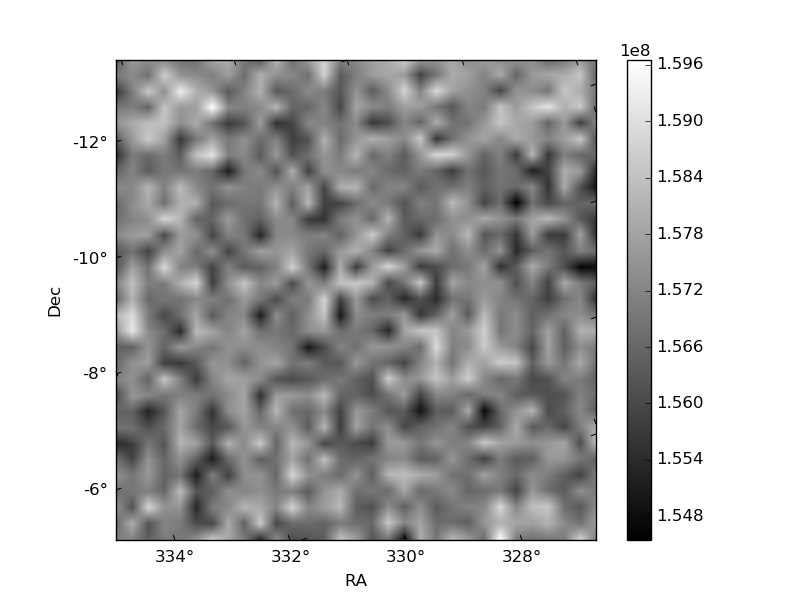
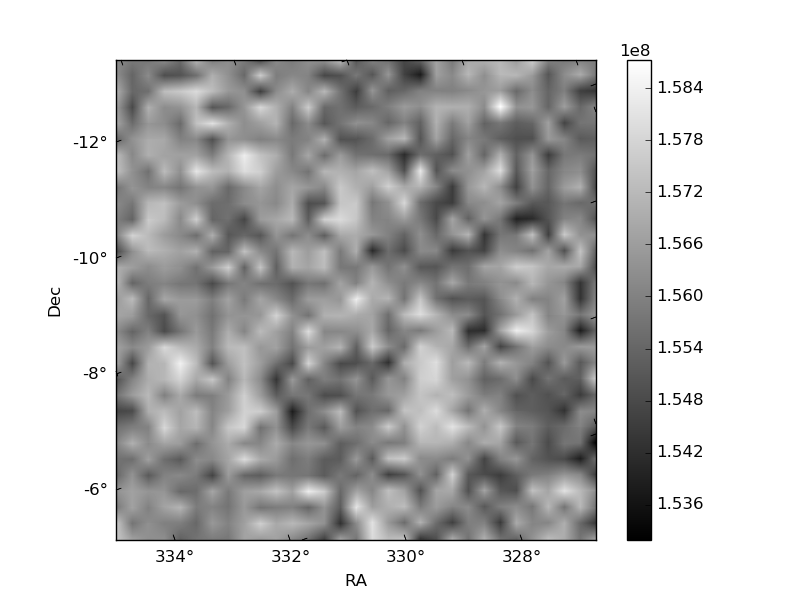
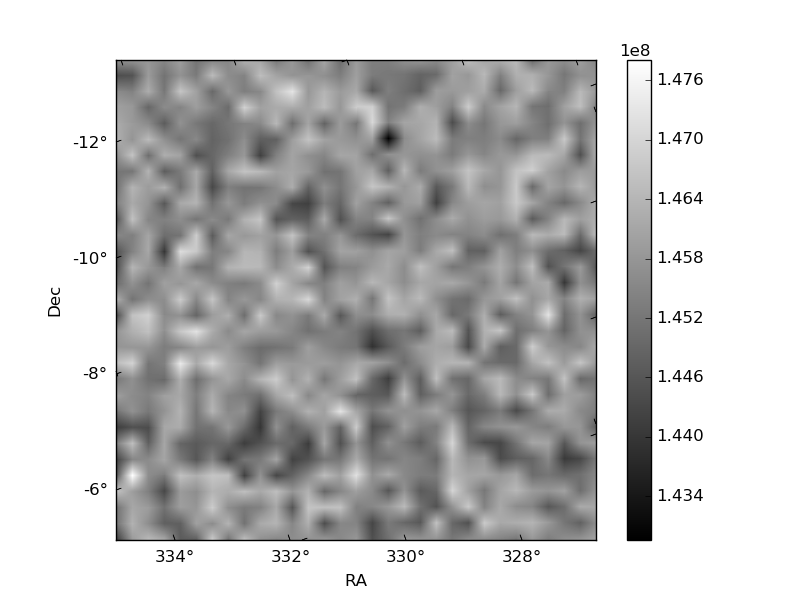
| Quadrant A | 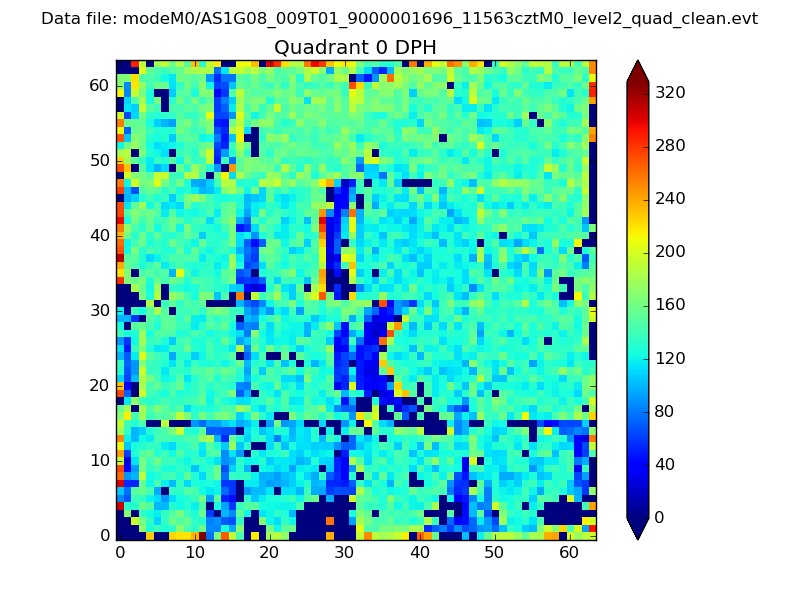 |
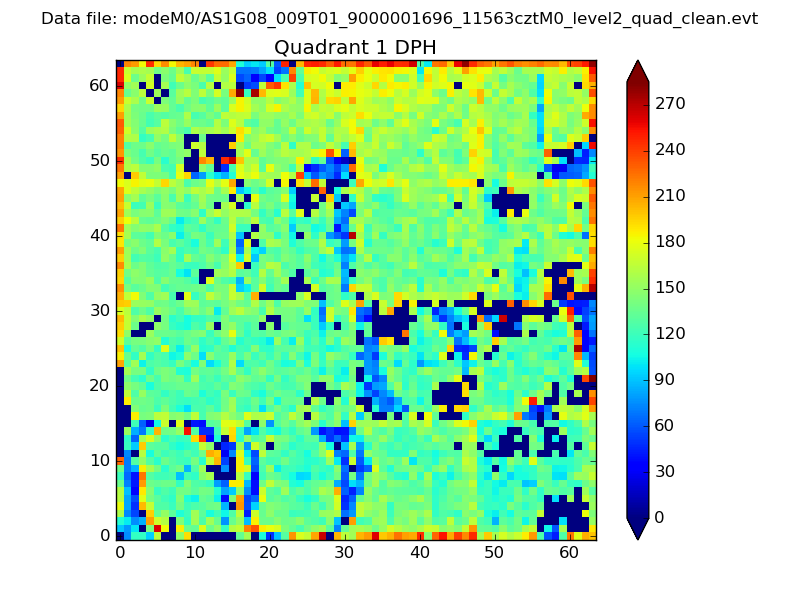 |
Quadrant B |
|---|---|---|---|
| Quadrant D | 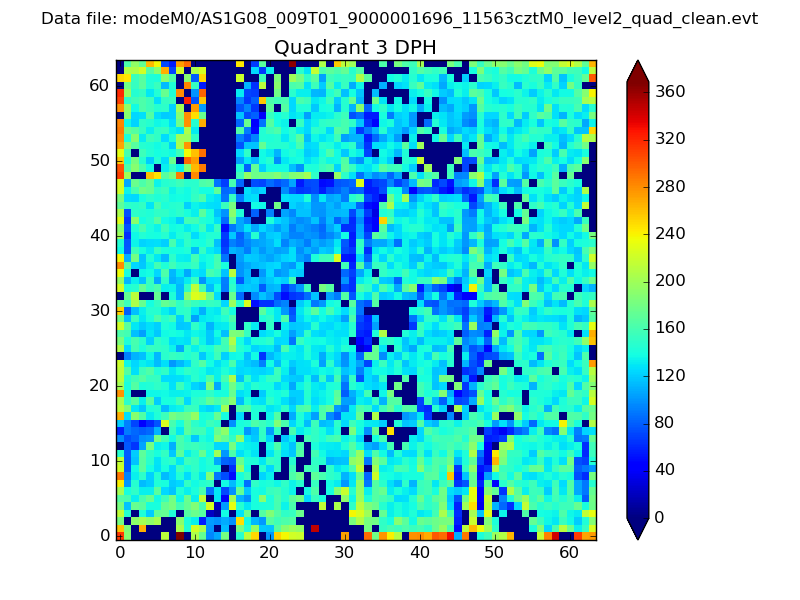 |
 |
Quadrant C |
| Plot type | Count rate plots | Images |
|---|---|---|
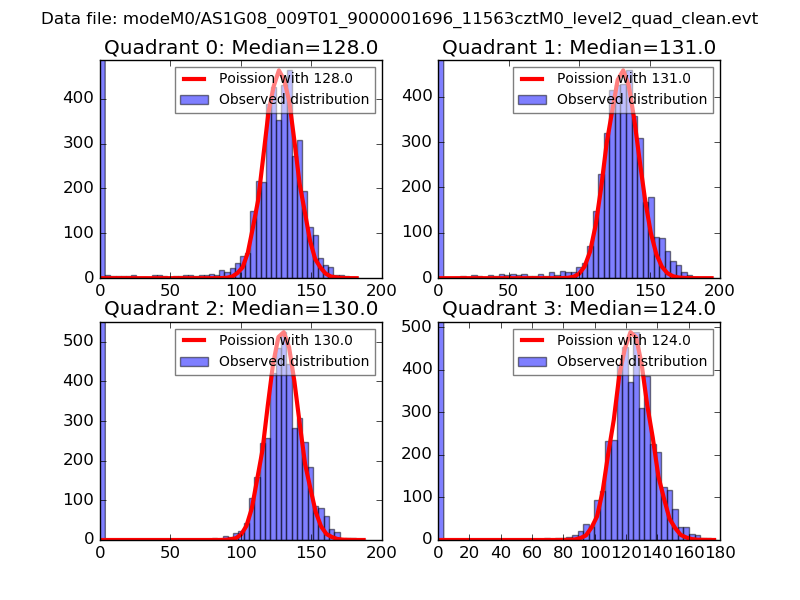
| Comparison with Poisson distribution Blue bars denote a histogram of data divided into 1 sec bins. Red curve is a Poisson curve with rate = median count rate of data. |
 |
 |
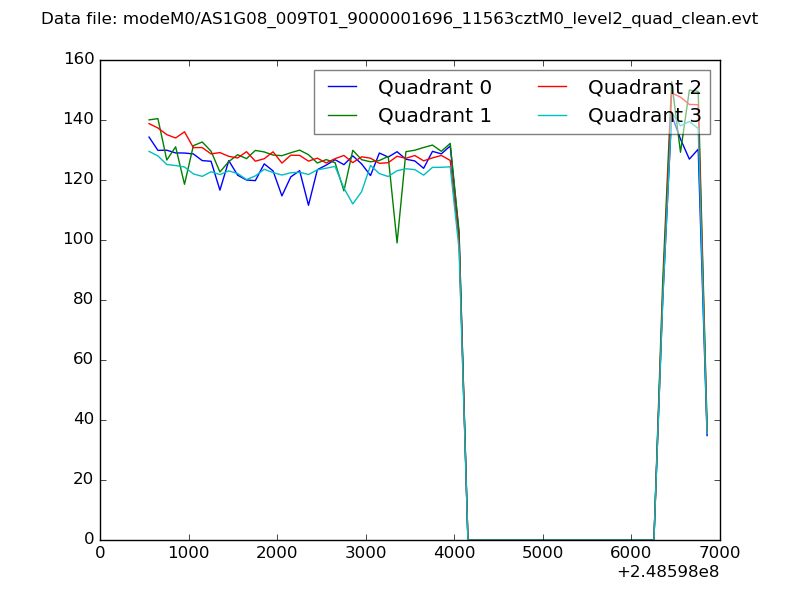
| Quadrant-wise count rates Data is divided into 100 sec bins |
 |
|
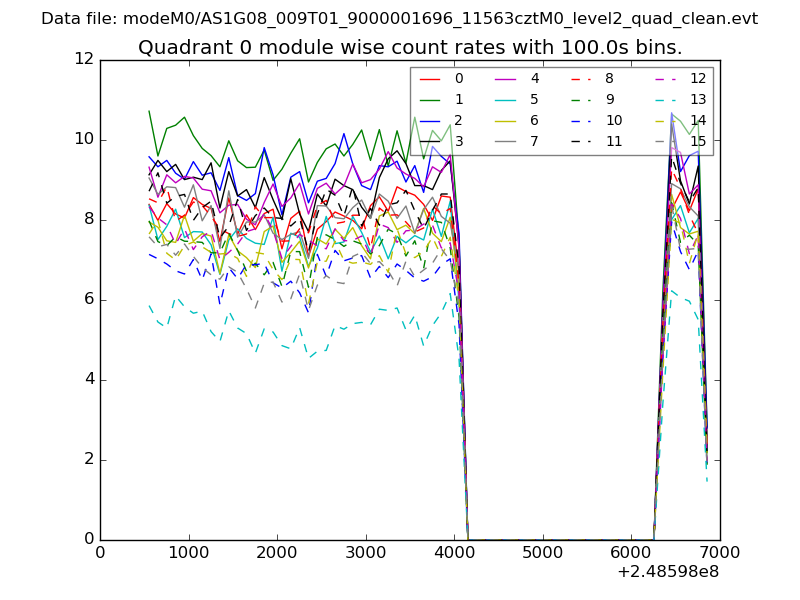
| Module-wise count rates for Quadrant A Data is divided into 100 sec bins |
 |
 |
| Module-wise count rates for Quadrant B Data is divided into 100 sec bins |
 |
 |
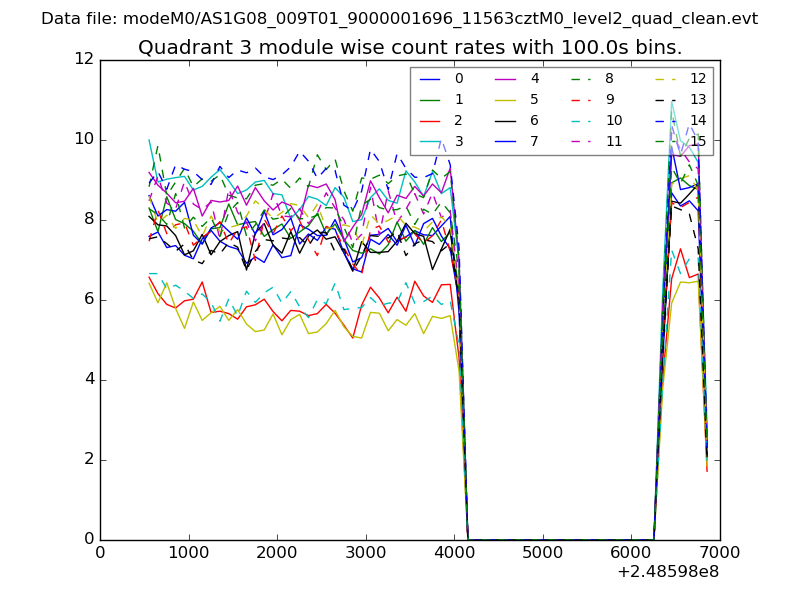
| Module-wise count rates for Quadrant C Data is divided into 100 sec bins |
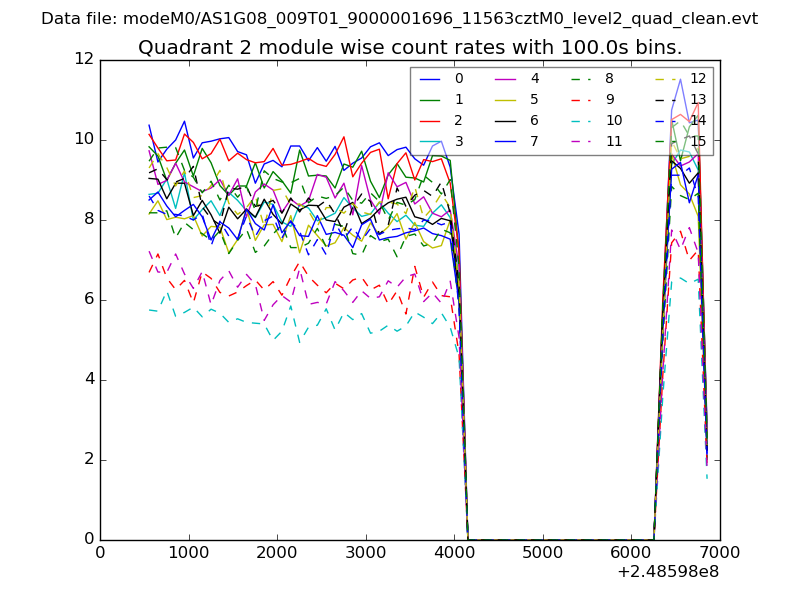 |
 |
| Module-wise count rates for Quadrant D Data is divided into 100 sec bins |
 |
 |
| Parameter | Plot |
|---|---|
| CZT HV Monitor | 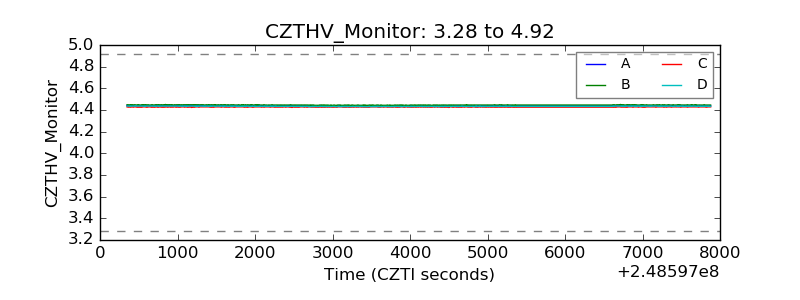 |
| D_VDD | 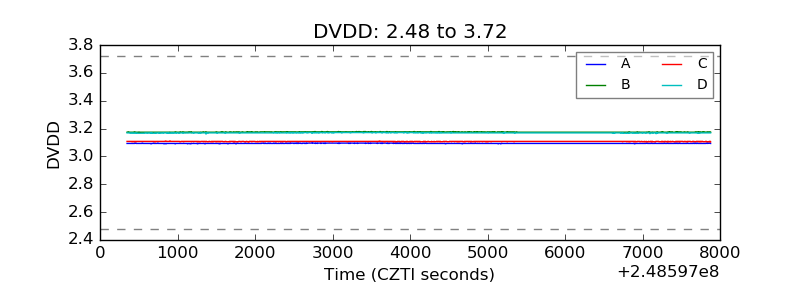 |
| Temperature 1 |  |
| Veto HV Monitor | 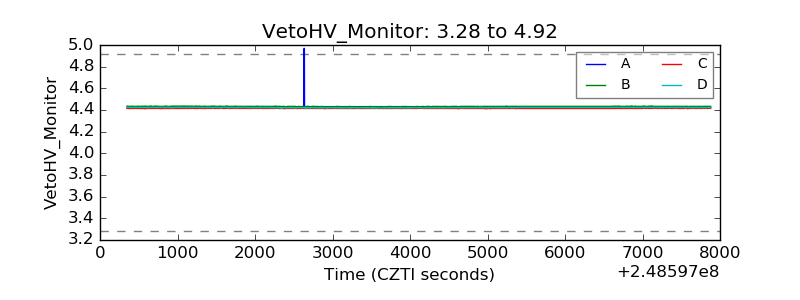 |
| Veto LLD |  |
| Alpha Counter | 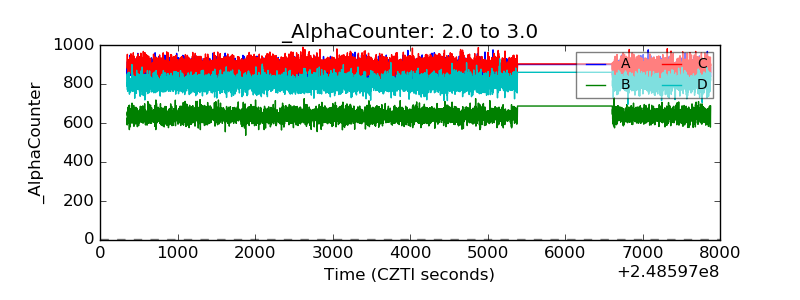 |
| _CPM_Rate | 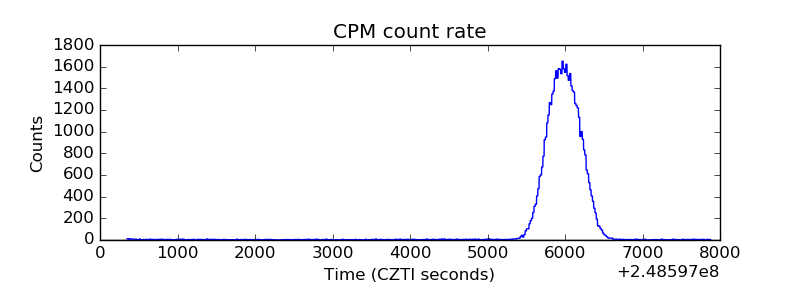 |
| CZT Counter | 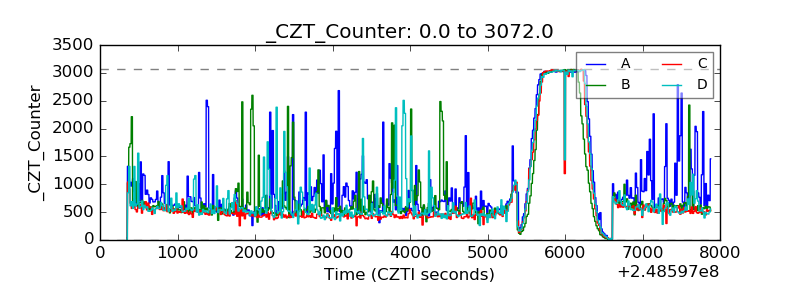 |
| +2.5 Volts monitor |  |
| +5 Volts monitor |  |
| _ROLL_ROT |  |
| _Roll_DEC |  |
| _Roll_RA | 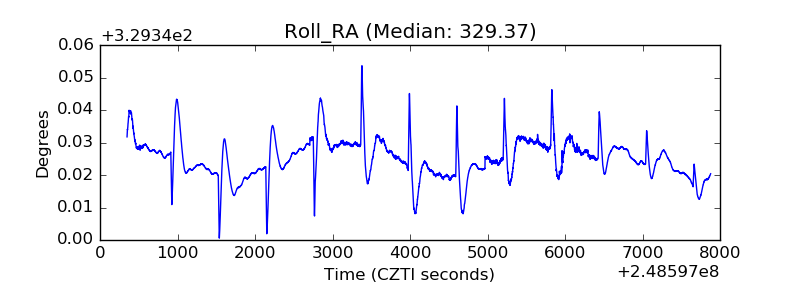 |
| Veto Counter | 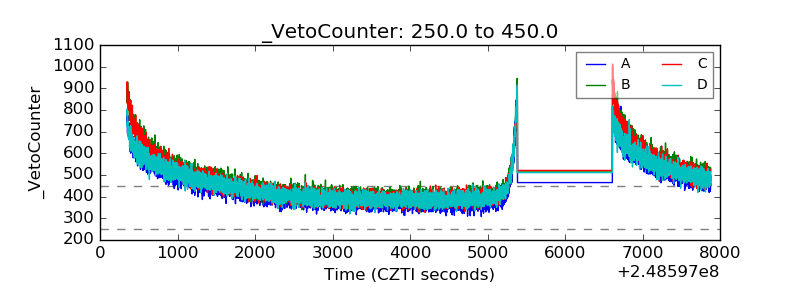 |