| Param | Original file | Final file |
|---|---|---|
| Filename | modeM0/AS1G08_009T01_9000001696_11564cztM0_level2.evt | modeM0/AS1G08_009T01_9000001696_11564cztM0_level2_quad_clean.evt |
| Size (bytes) | 613,584,000 | 93,600,000 |
| Size | 585.2 MB | 89.3 MB |
| Events in quadrant A | 6,221,342 | 586,616 |
| Events in quadrant B | 4,679,806 | 614,126 |
| Events in quadrant C | 3,011,783 | 617,864 |
| Events in quadrant D | 4,252,485 | 585,091 |
| Mode SS | |||
|---|---|---|---|
| Quadrant | BADHDUFLAG | Total packets | Discarded packets |
| A | 0 | 126 | 0 |
| B | 0 | 126 | 0 |
| C | 0 | 126 | 0 |
| D | 0 | 126 | 0 |
| Mode M9 | |||
|---|---|---|---|
| Quadrant | BADHDUFLAG | Total packets | Discarded packets |
| A | 0 | 13 | 0 |
| B | 0 | 13 | 0 |
| C | 0 | 13 | 0 |
| D | 0 | 13 | 0 |
| Mode M0 | |||
|---|---|---|---|
| Quadrant | BADHDUFLAG | Total packets | Discarded packets |
| A | 0 | 22918 | 2 |
| B | 0 | 18070 | 1 |
| C | 0 | 12860 | 1 |
| D | 0 | 16592 | 1 |
| Quadrant | Total seconds | Saturated seconds | Saturation percentage |
|---|---|---|---|
| A | 6164 | 769 | 12.475665% |
| B | 6164 | 416 | 6.748864% |
| C | 6164 | 25 | 0.405581% |
| D | 6164 | 289 | 4.688514% |
Noise dominated data is calculated using 1-second bins in cleaned event files. If a bin has >2000 counts, and if more than 50% of those come from <1% of pixels, then it is considered to be noise-dominated and hence unusable.
| Quadrant | # 1 sec bins | Bins with >0 counts | Bins with >2000 counts | High rate bins dominated by noise | Noise dominated (total time) | Noise dominated (detector-on time) | Marked lightcurve |
|---|---|---|---|---|---|---|---|
| A | 7470 | 6166 | 543 | 543 | 7.27% | 8.81% | 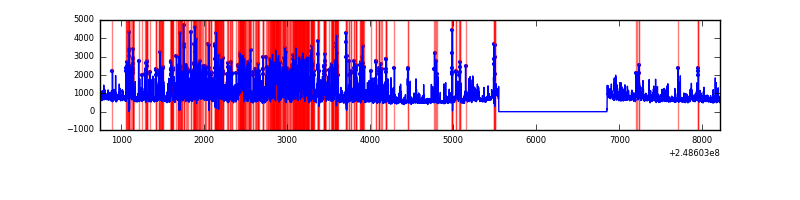 |
| B | 7470 | 6166 | 261 | 261 | 3.49% | 4.23% | 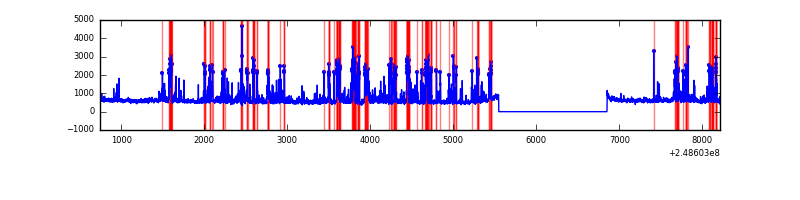 |
| C | 7470 | 6166 | 0 | 0 | 0.00% | 0.00% | 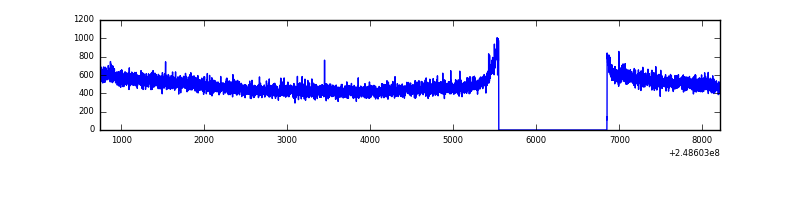 |
| D | 7470 | 6166 | 180 | 180 | 2.41% | 2.92% | 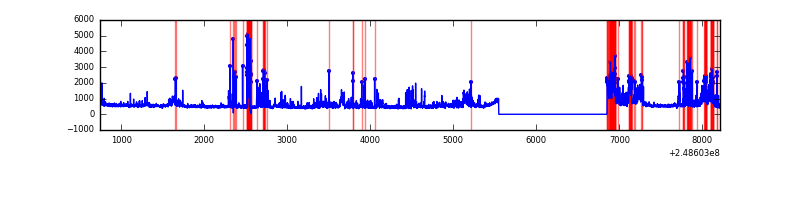 |
Top three noisy pixels from each quadrant. If the there are fewer than three noisy pixels in the level2.evt file, extra rows are filled as -1
| Pixel properties | Quadrant properties | ||||||
|---|---|---|---|---|---|---|---|
| Quadrant | DetID | PixID | Counts | Sigma | Mean | Median | Sigma |
| A | 8 | 5 | 2813229 | 17883.46 | 779 | 765 | 157.3 |
| A | 13 | 210 | 117181 | 740.25 | 779 | 765 | 157.3 |
| A | 1 | 162 | 103302 | 652.0 | 779 | 765 | 157.3 |
| B | 4 | 239 | 1228166 | 8193.23 | 792 | 775 | 149.8 |
| B | 15 | 204 | 175809 | 1168.41 | 792 | 775 | 149.8 |
| B | 11 | 51 | 85294 | 564.19 | 792 | 775 | 149.8 |
| C | 13 | 61 | 5610 | 27.05 | 772 | 777 | 178.7 |
| C | 14 | 67 | 2411 | 9.15 | 772 | 777 | 178.7 |
| C | 3 | 202 | 1928 | 6.44 | 772 | 777 | 178.7 |
| D | 13 | 137 | 471641 | 2617.46 | 765 | 746 | 179.9 |
| D | 2 | 120 | 469076 | 2603.2 | 765 | 746 | 179.9 |
| D | 1 | 52 | 229654 | 1272.38 | 765 | 746 | 179.9 |
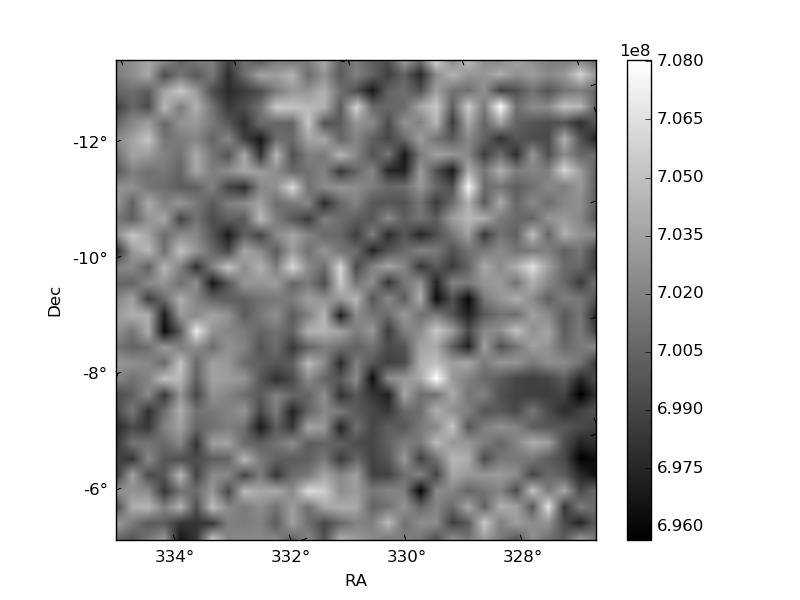
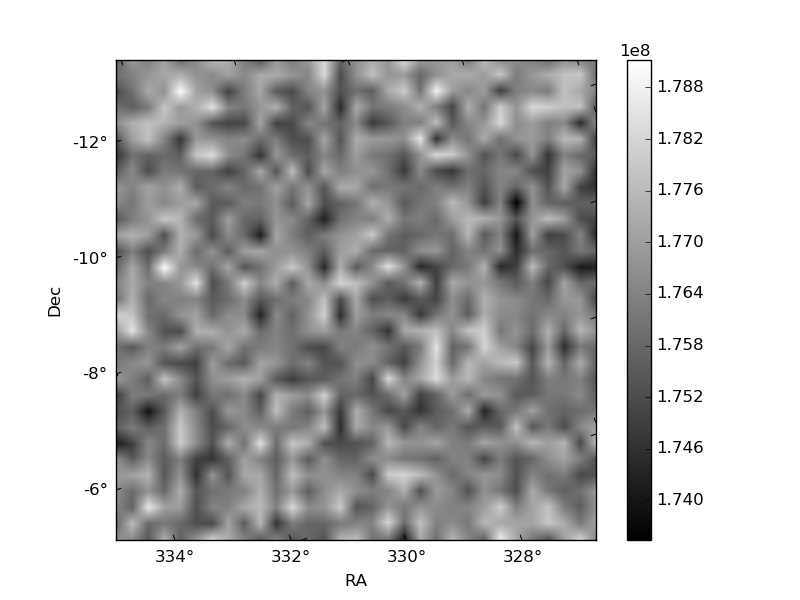
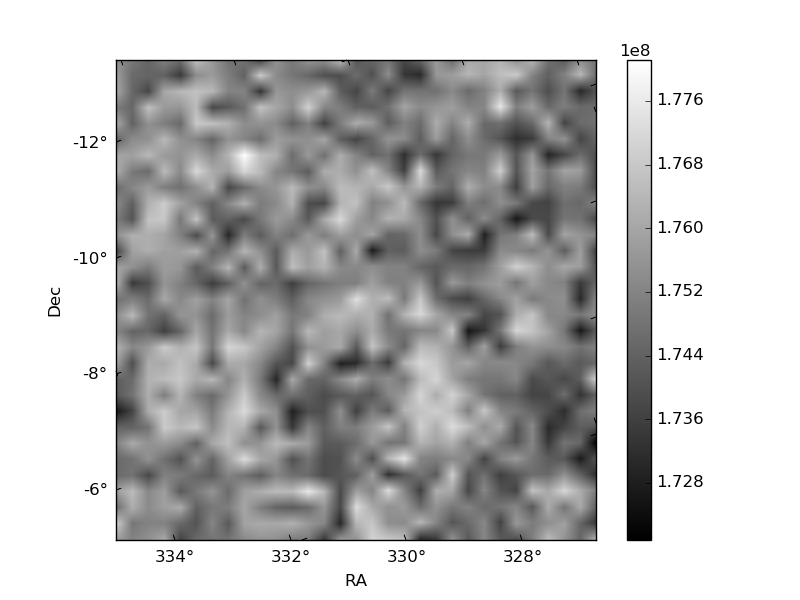
Histogram calculated using DETX and DETY for each event in the final _common_clean file
| Quadrant A | 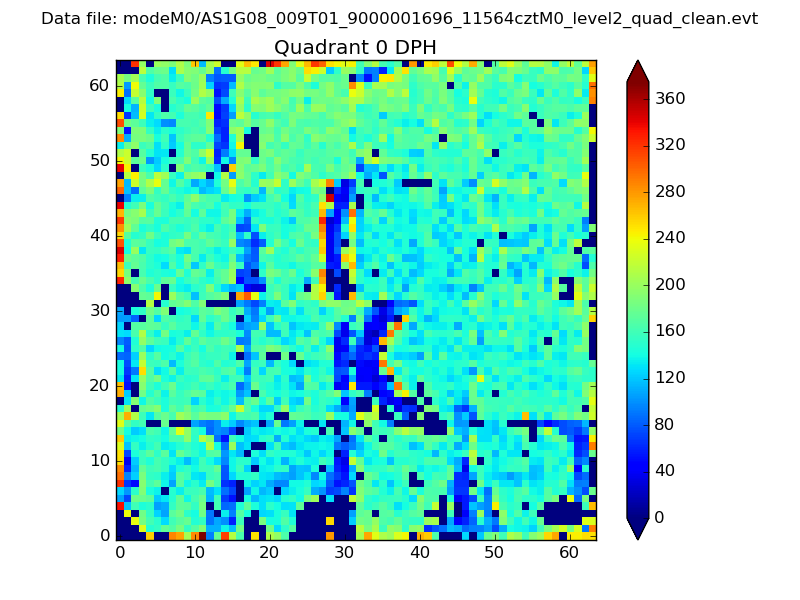 |
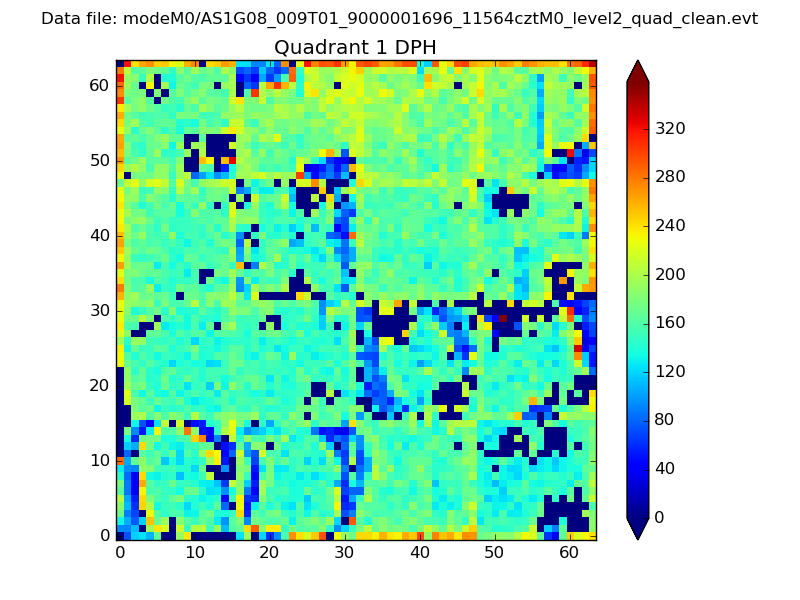 |
Quadrant B |
|---|---|---|---|
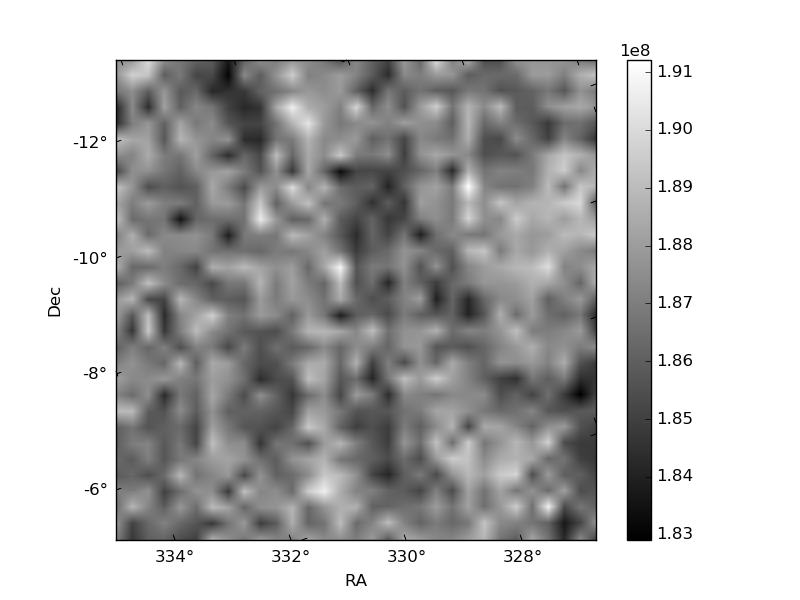
| Quadrant D |  |
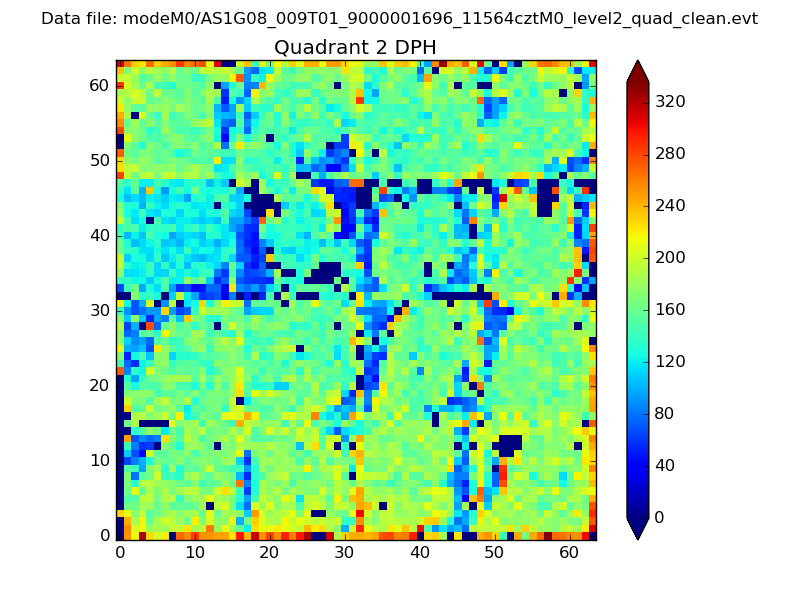 |
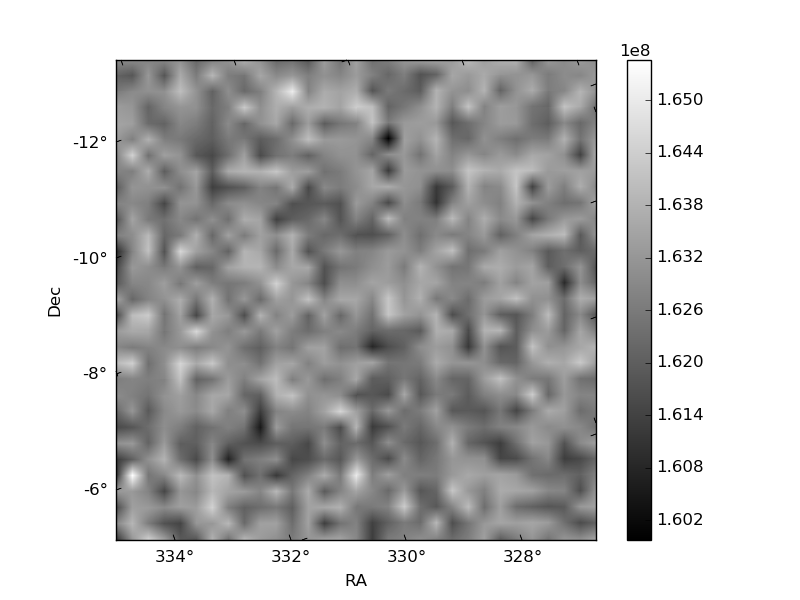
Quadrant C |
| Plot type | Count rate plots | Images |
|---|---|---|
| Comparison with Poisson distribution Blue bars denote a histogram of data divided into 1 sec bins. Red curve is a Poisson curve with rate = median count rate of data. |
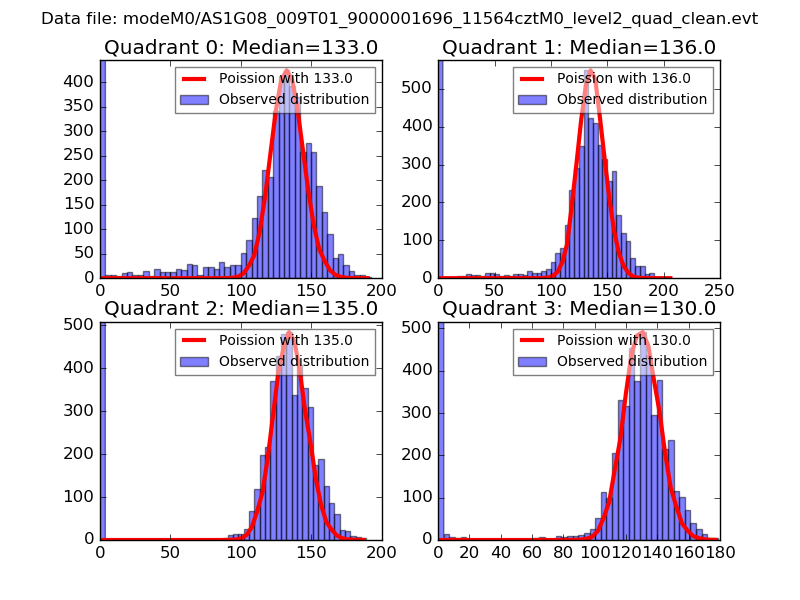 |
 |
| Quadrant-wise count rates Data is divided into 100 sec bins |
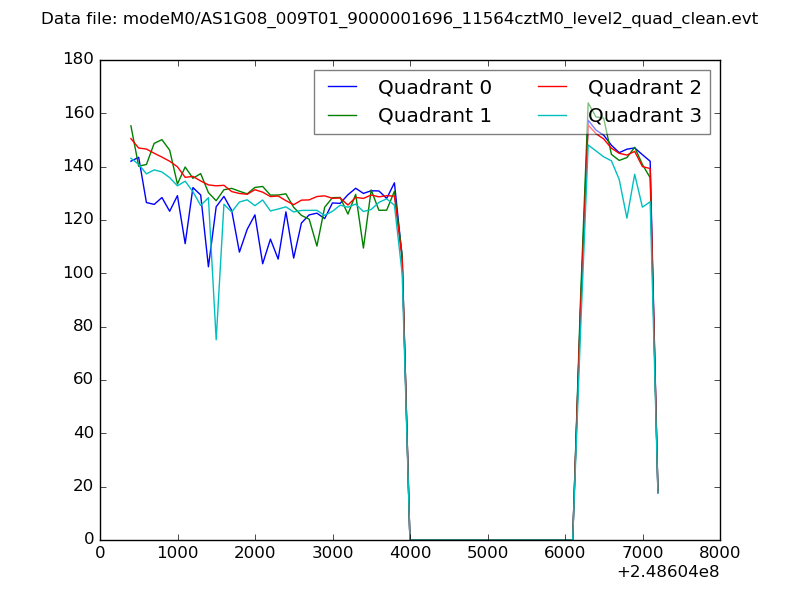 |
|
| Module-wise count rates for Quadrant A Data is divided into 100 sec bins |
 |
 |
| Module-wise count rates for Quadrant B Data is divided into 100 sec bins |
 |
 |
| Module-wise count rates for Quadrant C Data is divided into 100 sec bins |
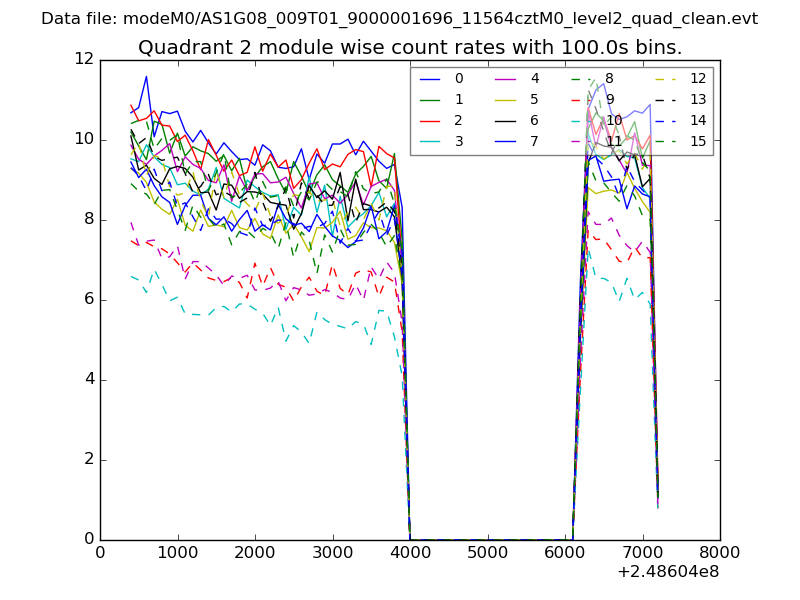 |
 |
| Module-wise count rates for Quadrant D Data is divided into 100 sec bins |
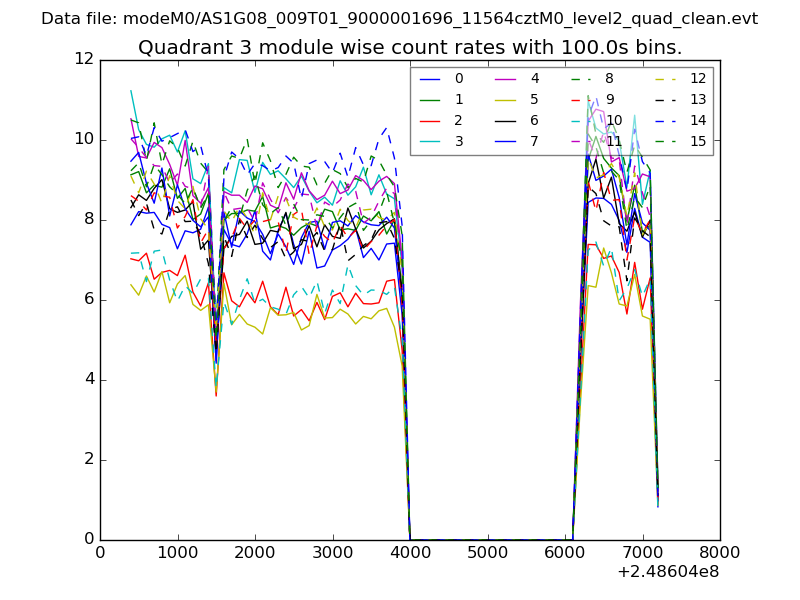 |
 |
| Parameter | Plot |
|---|---|
| CZT HV Monitor |  |
| D_VDD | 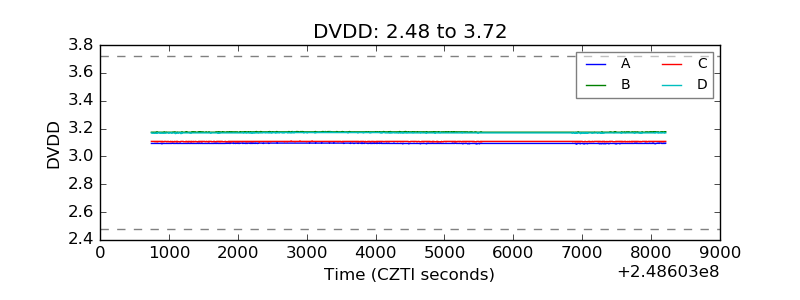 |
| Temperature 1 | 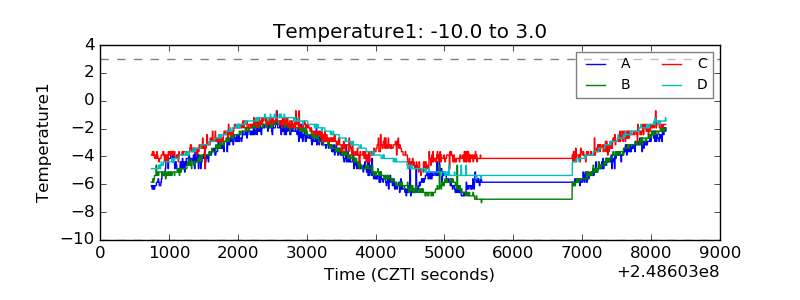 |
| Veto HV Monitor | 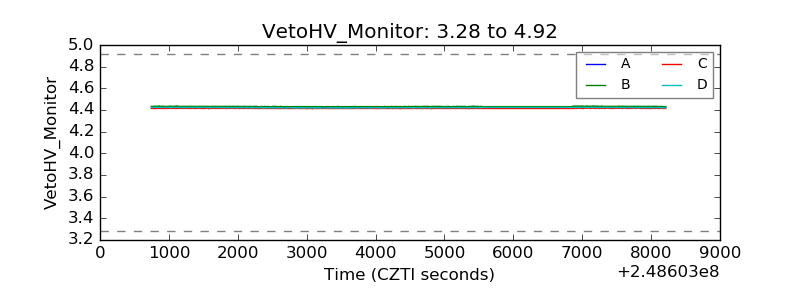 |
| Veto LLD |  |
| Alpha Counter | 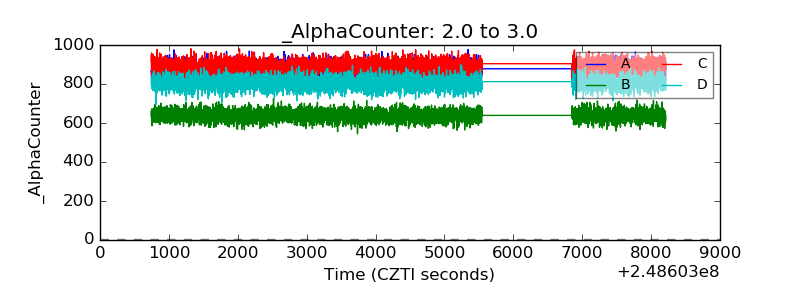 |
| _CPM_Rate | 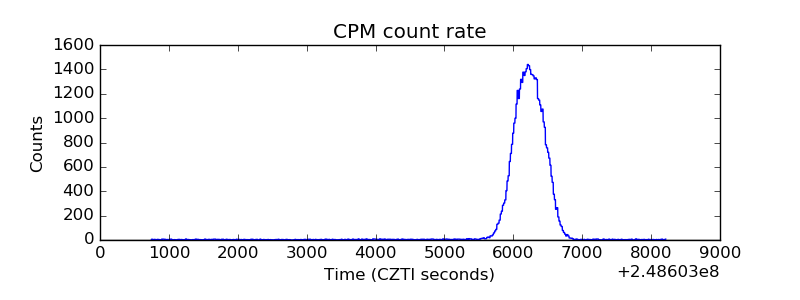 |
| CZT Counter | 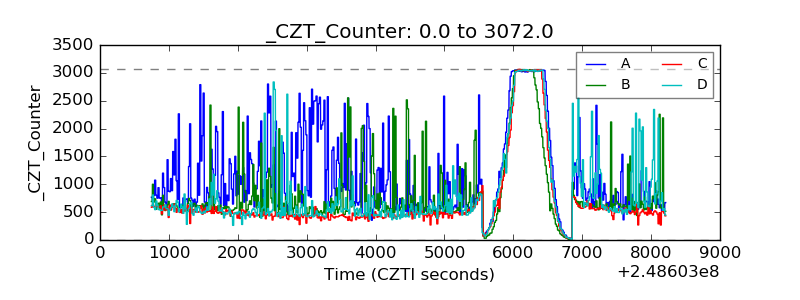 |
| +2.5 Volts monitor |  |
| +5 Volts monitor |  |
| _ROLL_ROT | 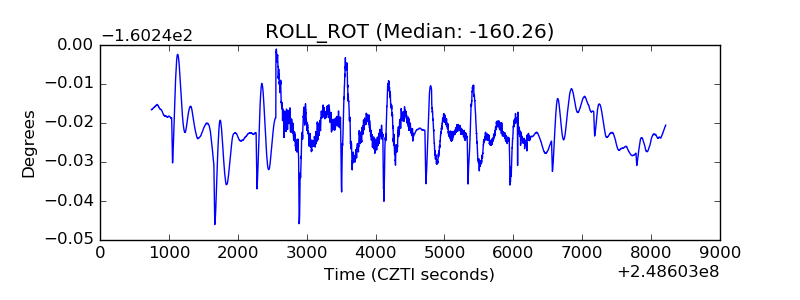 |
| _Roll_DEC | 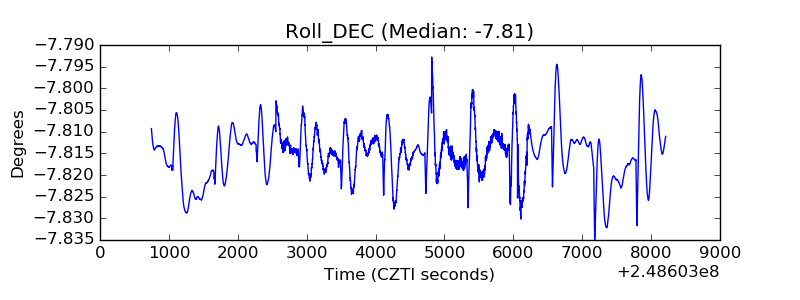 |
| _Roll_RA | 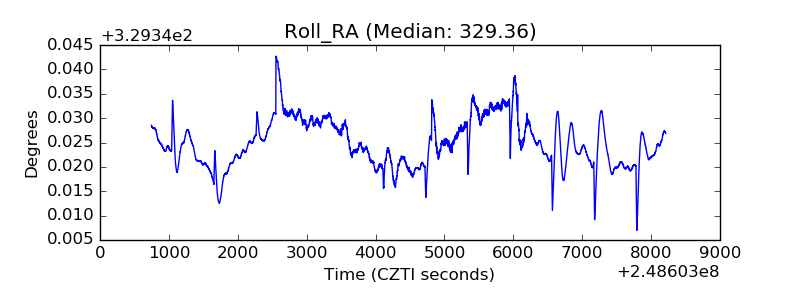 |
| Veto Counter |  |