| Param | Original file | Final file |
|---|---|---|
| Filename | modeM0/AS1G08_009T01_9000001696_11565cztM0_level2.evt | modeM0/AS1G08_009T01_9000001696_11565cztM0_level2_quad_clean.evt |
| Size (bytes) | 319,446,720 | 55,411,200 |
| Size | 304.6 MB | 52.8 MB |
| Events in quadrant A | 2,974,817 | 366,367 |
| Events in quadrant B | 2,450,585 | 381,657 |
| Events in quadrant C | 1,300,467 | 384,675 |
| Events in quadrant D | 2,753,489 | 340,647 |
| Mode SS | |||
|---|---|---|---|
| Quadrant | BADHDUFLAG | Total packets | Discarded packets |
| A | 0 | 56 | 0 |
| B | 0 | 56 | 0 |
| C | 0 | 56 | 0 |
| D | 0 | 56 | 0 |
| Mode M0 | |||
|---|---|---|---|
| Quadrant | BADHDUFLAG | Total packets | Discarded packets |
| A | 0 | 10924 | 0 |
| B | 0 | 9263 | 0 |
| C | 0 | 5764 | 0 |
| D | 0 | 10069 | 0 |
| Quadrant | Total seconds | Saturated seconds | Saturation percentage |
|---|---|---|---|
| A | 2861 | 368 | 12.862635% |
| B | 2861 | 213 | 7.444949% |
| C | 2861 | 0 | 0.000000% |
| D | 2861 | 430 | 15.029710% |
Noise dominated data is calculated using 1-second bins in cleaned event files. If a bin has >2000 counts, and if more than 50% of those come from <1% of pixels, then it is considered to be noise-dominated and hence unusable.
| Quadrant | # 1 sec bins | Bins with >0 counts | Bins with >2000 counts | High rate bins dominated by noise | Noise dominated (total time) | Noise dominated (detector-on time) | Marked lightcurve |
|---|---|---|---|---|---|---|---|
| A | 2862 | 2862 | 322 | 322 | 11.25% | 11.25% | 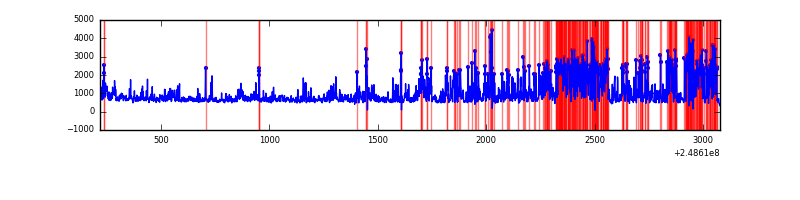 |
| B | 2862 | 2862 | 168 | 168 | 5.87% | 5.87% | 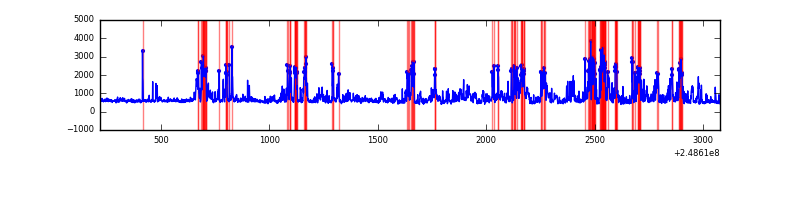 |
| C | 2862 | 2862 | 0 | 0 | 0.00% | 0.00% | 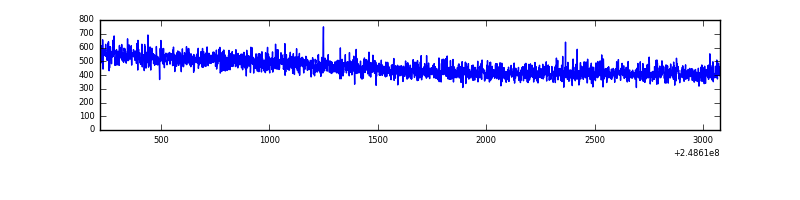 |
| D | 2862 | 2862 | 405 | 405 | 14.15% | 14.15% | 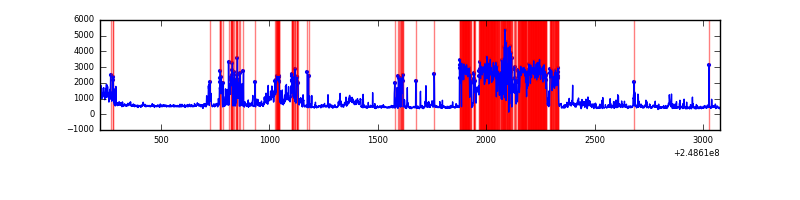 |
Top three noisy pixels from each quadrant. If the there are fewer than three noisy pixels in the level2.evt file, extra rows are filled as -1
| Pixel properties | Quadrant properties | ||||||
|---|---|---|---|---|---|---|---|
| Quadrant | DetID | PixID | Counts | Sigma | Mean | Median | Sigma |
| A | 8 | 5 | 1473503 | 20980.9 | 340 | 334 | 70.2 |
| A | 1 | 162 | 65955 | 934.58 | 340 | 334 | 70.2 |
| A | 1 | 178 | 40714 | 575.09 | 340 | 334 | 70.2 |
| B | 4 | 239 | 749429 | 11356.81 | 343 | 337 | 66.0 |
| B | 15 | 204 | 239670 | 3628.47 | 343 | 337 | 66.0 |
| B | 11 | 51 | 80300 | 1212.3 | 343 | 337 | 66.0 |
| C | 13 | 61 | 2489 | 27.72 | 333 | 336 | 77.7 |
| C | 3 | 202 | 834 | 6.41 | 333 | 336 | 77.7 |
| C | 3 | 203 | 741 | 5.21 | 333 | 336 | 77.7 |
| D | 1 | 52 | 991071 | 12849.32 | 316 | 307 | 77.1 |
| D | 13 | 137 | 355514 | 4606.72 | 316 | 307 | 77.1 |
| D | 2 | 120 | 146488 | 1895.84 | 316 | 307 | 77.1 |
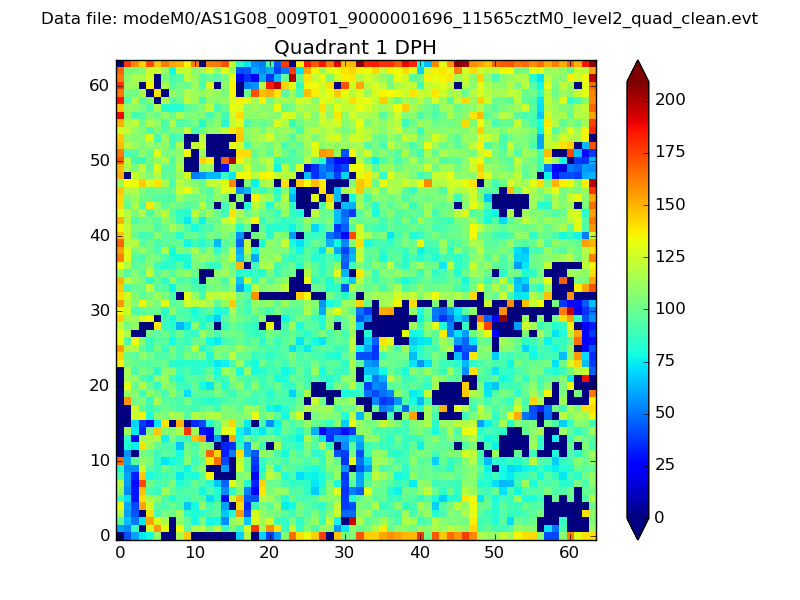
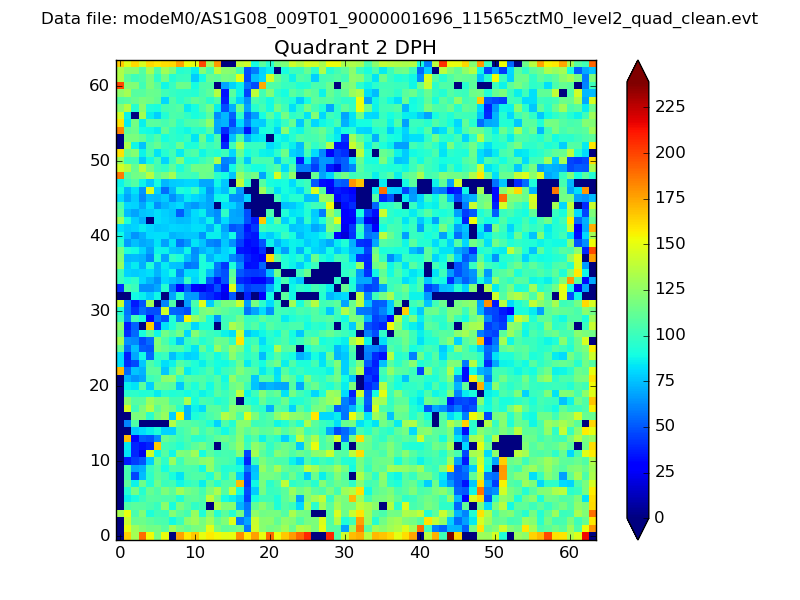
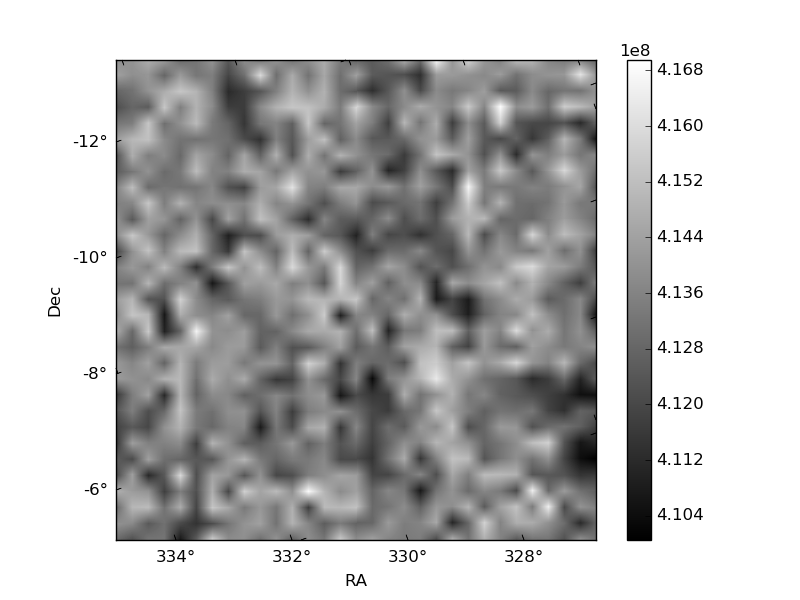
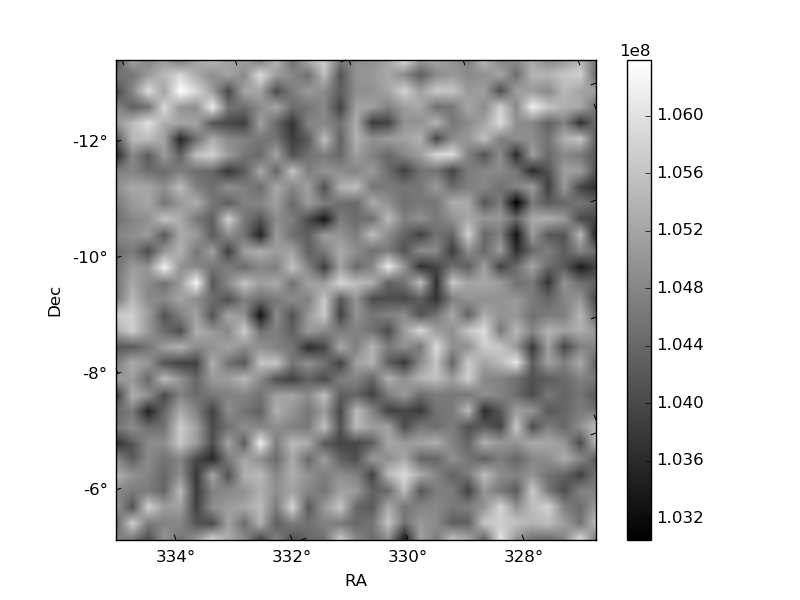
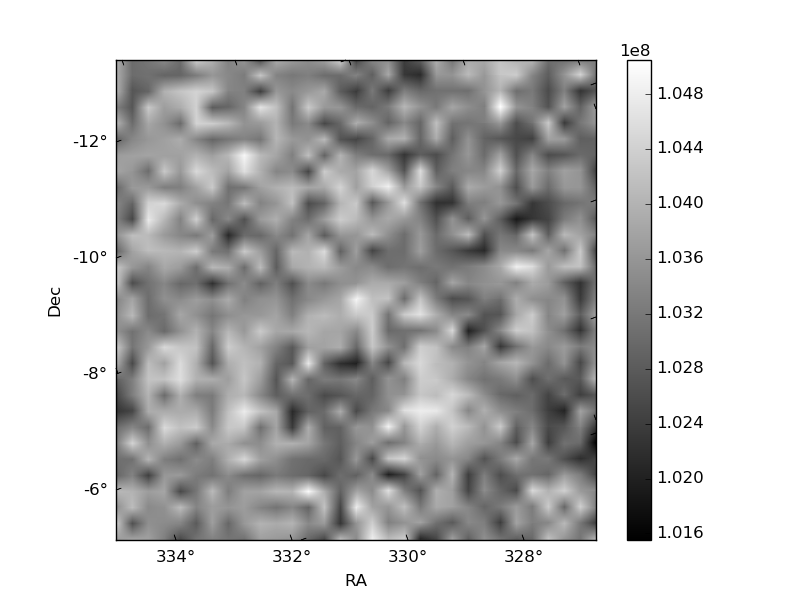
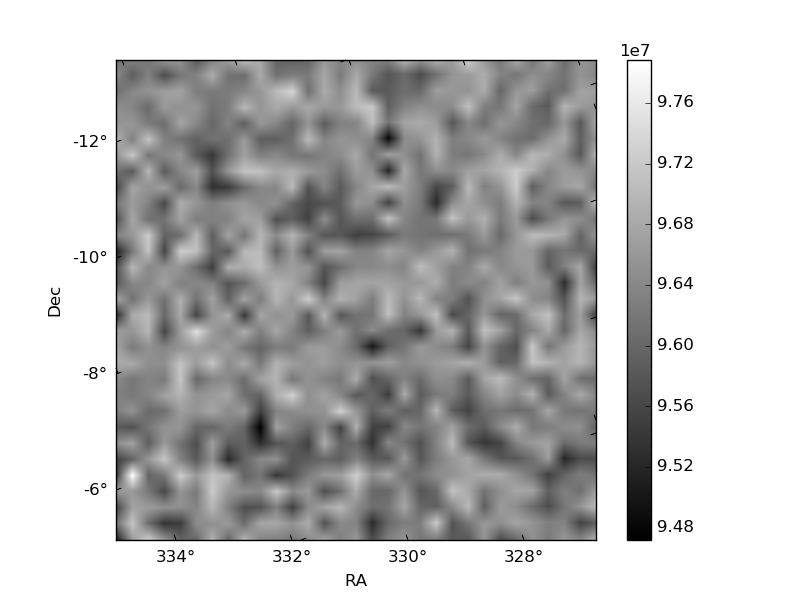
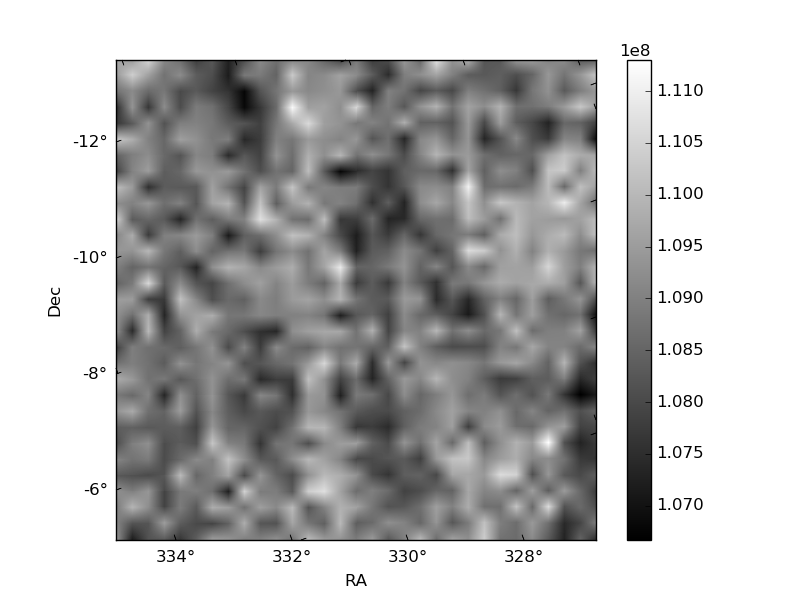
Histogram calculated using DETX and DETY for each event in the final _common_clean file
| Quadrant A |  |
 |
Quadrant B |
|---|---|---|---|
| Quadrant D | 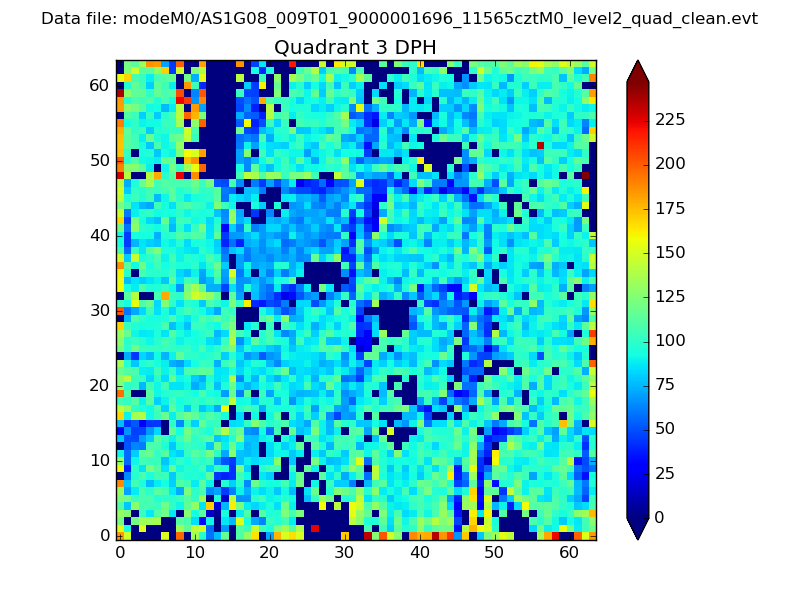 |
 |
Quadrant C |
| Plot type | Count rate plots | Images |
|---|---|---|
| Comparison with Poisson distribution Blue bars denote a histogram of data divided into 1 sec bins. Red curve is a Poisson curve with rate = median count rate of data. |
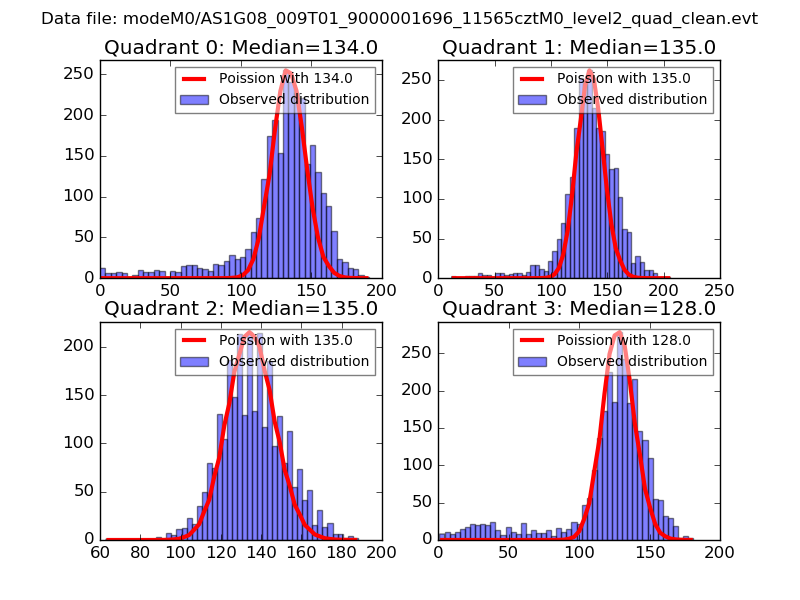 |
 |
| Quadrant-wise count rates Data is divided into 100 sec bins |
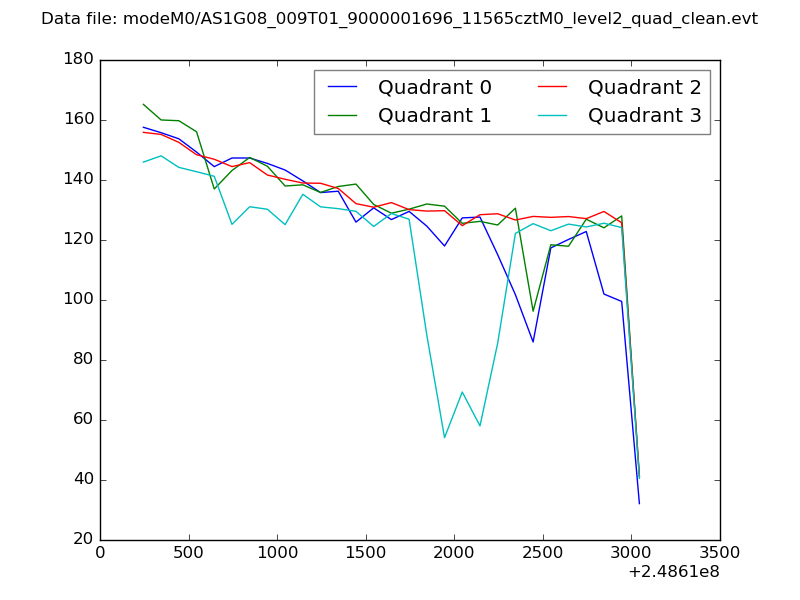 |
|
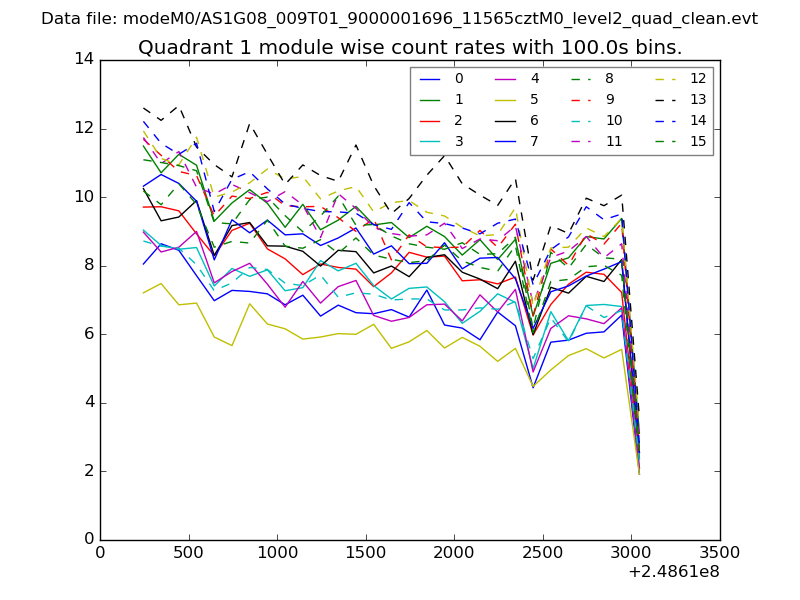
| Module-wise count rates for Quadrant A Data is divided into 100 sec bins |
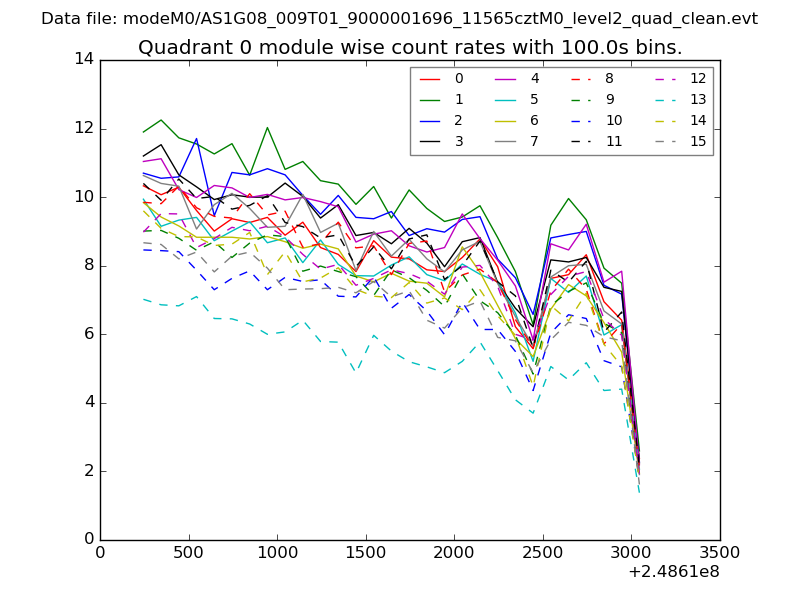 |
 |
| Module-wise count rates for Quadrant B Data is divided into 100 sec bins |
 |
 |
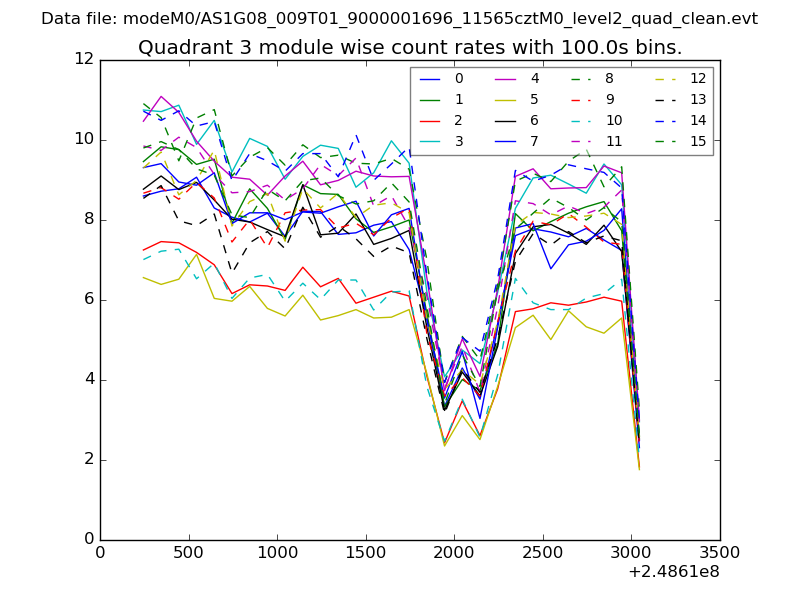
| Module-wise count rates for Quadrant C Data is divided into 100 sec bins |
 |
 |
| Module-wise count rates for Quadrant D Data is divided into 100 sec bins |
 |
 |
| Parameter | Plot |
|---|---|
| CZT HV Monitor | 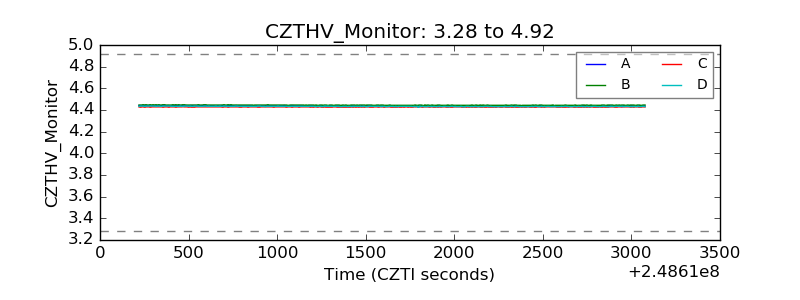 |
| D_VDD | 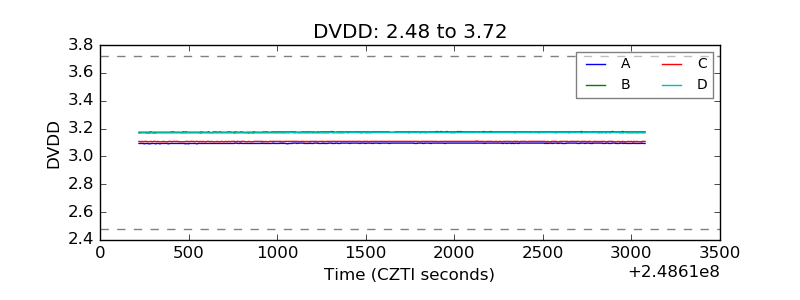 |
| Temperature 1 | 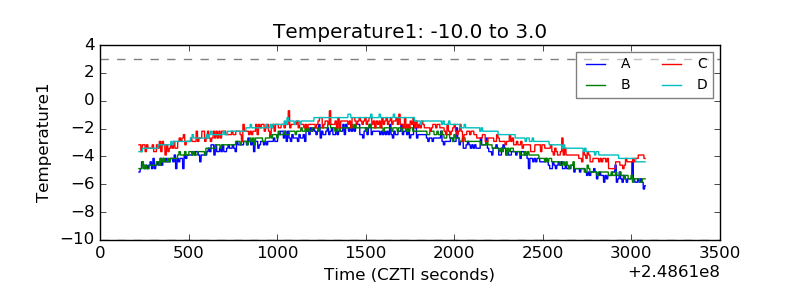 |
| Veto HV Monitor | 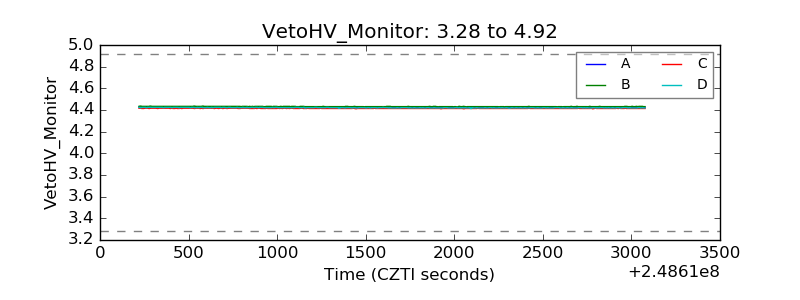 |
| Veto LLD | 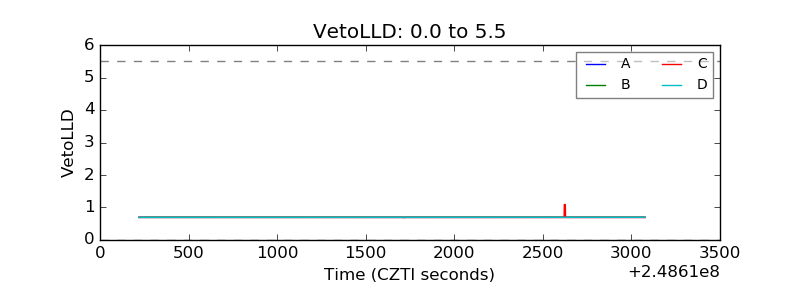 |
| Alpha Counter | 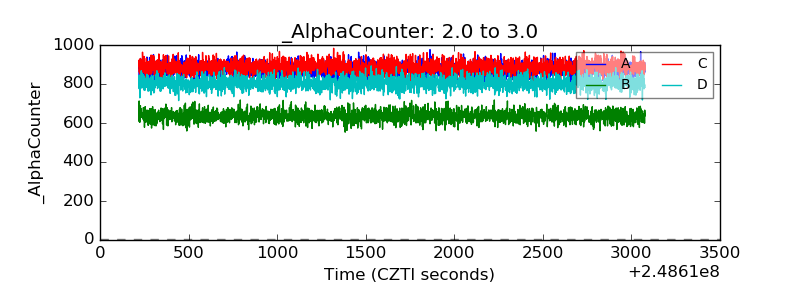 |
| _CPM_Rate | 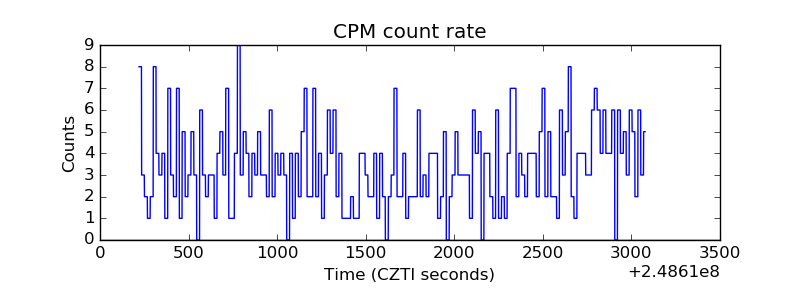 |
| CZT Counter | 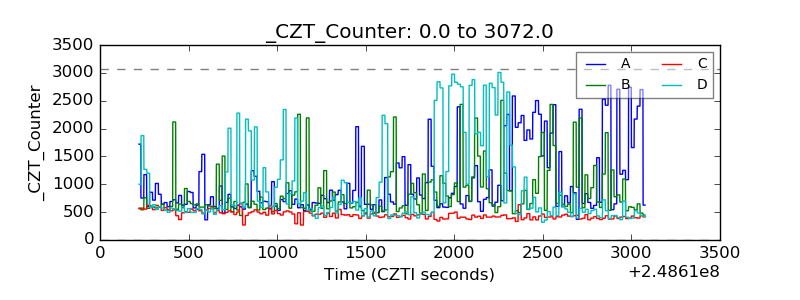 |
| +2.5 Volts monitor |  |
| +5 Volts monitor | 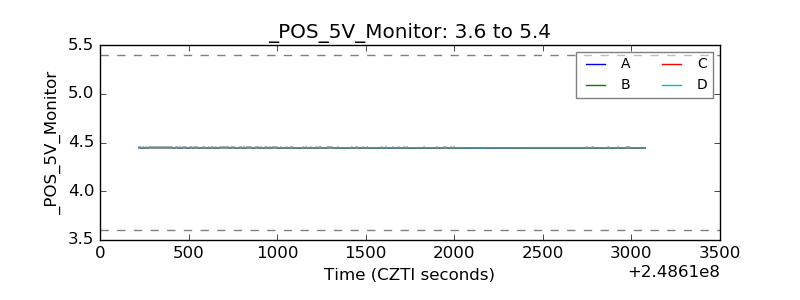 |
| _ROLL_ROT | 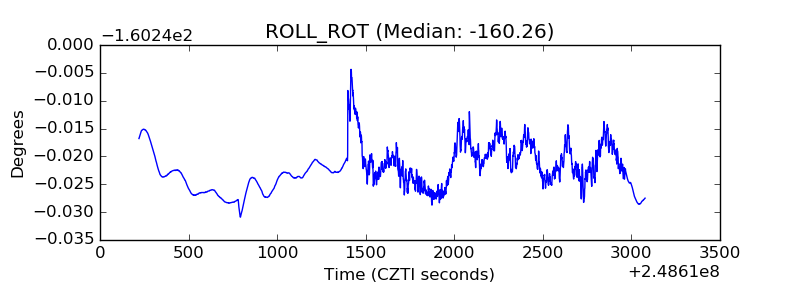 |
| _Roll_DEC | 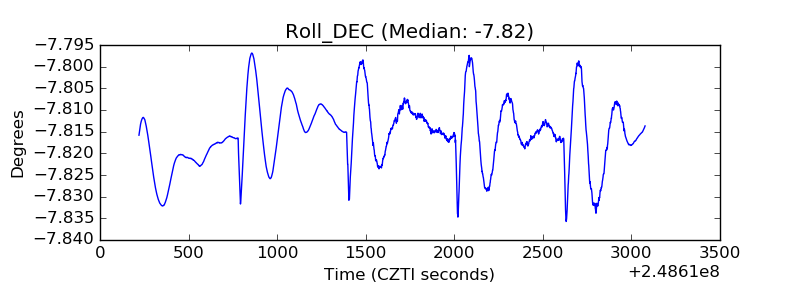 |
| _Roll_RA | 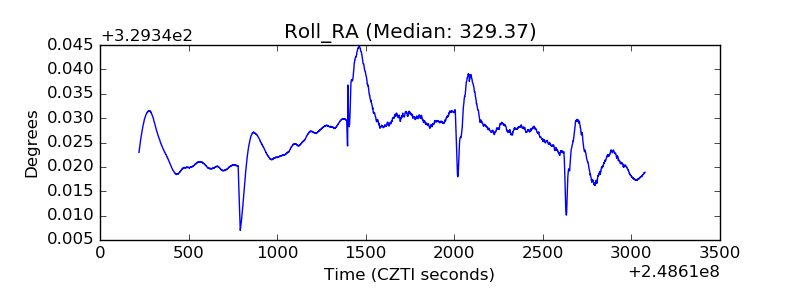 |
| Veto Counter | 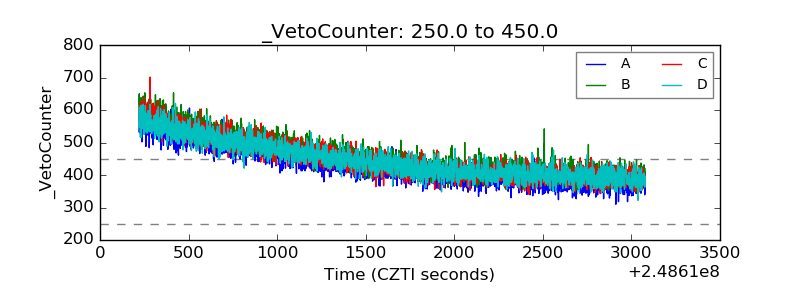 |