| Param | Original file | Final file |
|---|---|---|
| Filename | modeM0/AS1T01_206T01_9000001694_11548cztM0_level2.evt | modeM0/AS1T01_206T01_9000001694_11548cztM0_level2_quad_clean.evt |
| Size (bytes) | 658,774,080 | 73,895,040 |
| Size | 628.3 MB | 70.5 MB |
| Events in quadrant A | 5,048,866 | 469,612 |
| Events in quadrant B | 4,390,438 | 463,890 |
| Events in quadrant C | 2,990,033 | 463,170 |
| Events in quadrant D | 7,107,916 | 412,837 |
| Mode SS | |||
|---|---|---|---|
| Quadrant | BADHDUFLAG | Total packets | Discarded packets |
| A | 0 | 122 | 0 |
| B | 0 | 122 | 0 |
| C | 0 | 122 | 0 |
| D | 0 | 122 | 0 |
| Mode M0 | |||
|---|---|---|---|
| Quadrant | BADHDUFLAG | Total packets | Discarded packets |
| A | 0 | 19435 | 2 |
| B | 0 | 16981 | 1 |
| C | 0 | 12733 | 1 |
| D | 0 | 25381 | 1 |
| Mode M9 | |||
|---|---|---|---|
| Quadrant | BADHDUFLAG | Total packets | Discarded packets |
| A | 0 | 12 | 0 |
| B | 0 | 12 | 0 |
| C | 0 | 12 | 0 |
| D | 0 | 12 | 0 |
| Quadrant | Total seconds | Saturated seconds | Saturation percentage |
|---|---|---|---|
| A | 6133 | 340 | 5.543780% |
| B | 6133 | 357 | 5.820969% |
| C | 6133 | 55 | 0.896788% |
| D | 6133 | 1133 | 18.473830% |
Noise dominated data is calculated using 1-second bins in cleaned event files. If a bin has >2000 counts, and if more than 50% of those come from <1% of pixels, then it is considered to be noise-dominated and hence unusable.
| Quadrant | # 1 sec bins | Bins with >0 counts | Bins with >2000 counts | High rate bins dominated by noise | Noise dominated (total time) | Noise dominated (detector-on time) | Marked lightcurve |
|---|---|---|---|---|---|---|---|
| A | 7279 | 6135 | 144 | 144 | 1.98% | 2.35% | 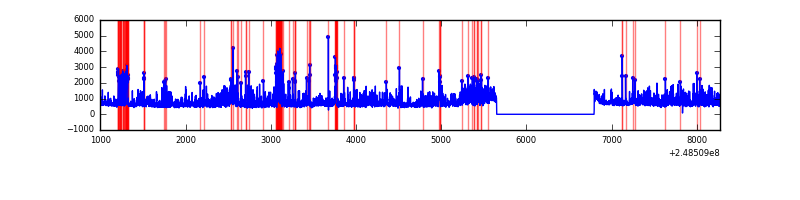 |
| B | 7279 | 6135 | 189 | 189 | 2.60% | 3.08% | 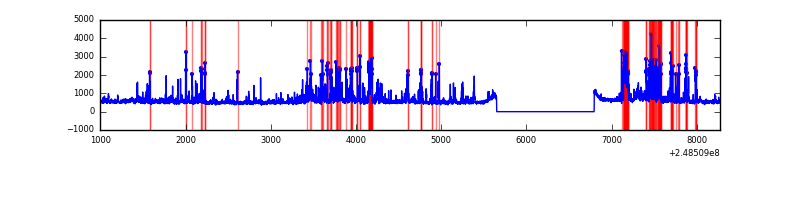 |
| C | 7279 | 6135 | 0 | 0 | 0.00% | 0.00% | 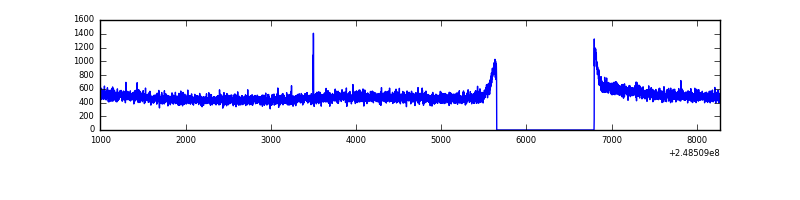 |
| D | 7279 | 6135 | 932 | 932 | 12.80% | 15.19% | 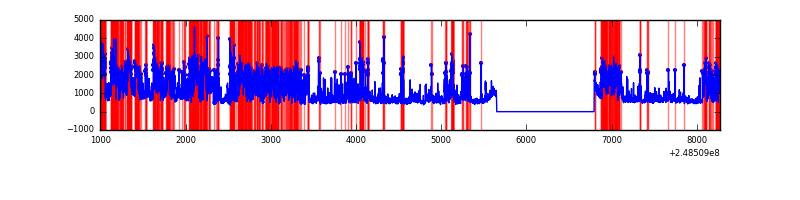 |
Top three noisy pixels from each quadrant. If the there are fewer than three noisy pixels in the level2.evt file, extra rows are filled as -1
| Pixel properties | Quadrant properties | ||||||
|---|---|---|---|---|---|---|---|
| Quadrant | DetID | PixID | Counts | Sigma | Mean | Median | Sigma |
| A | 8 | 5 | 1407729 | 8767.7 | 790 | 776 | 160.5 |
| A | 1 | 162 | 148684 | 921.72 | 790 | 776 | 160.5 |
| A | 9 | 143 | 145969 | 904.8 | 790 | 776 | 160.5 |
| B | 4 | 239 | 760416 | 5147.41 | 779 | 766 | 147.6 |
| B | 3 | 64 | 341540 | 2309.1 | 779 | 766 | 147.6 |
| B | 11 | 51 | 151334 | 1020.25 | 779 | 766 | 147.6 |
| C | 13 | 61 | 5623 | 27.3 | 766 | 773 | 177.6 |
| C | 14 | 234 | 5050 | 24.08 | 766 | 773 | 177.6 |
| C | 3 | 202 | 1953 | 6.64 | 766 | 773 | 177.6 |
| D | 13 | 137 | 2885536 | 16511.36 | 724 | 706 | 174.7 |
| D | 1 | 52 | 1297006 | 7419.39 | 724 | 706 | 174.7 |
| D | 2 | 120 | 87961 | 499.41 | 724 | 706 | 174.7 |
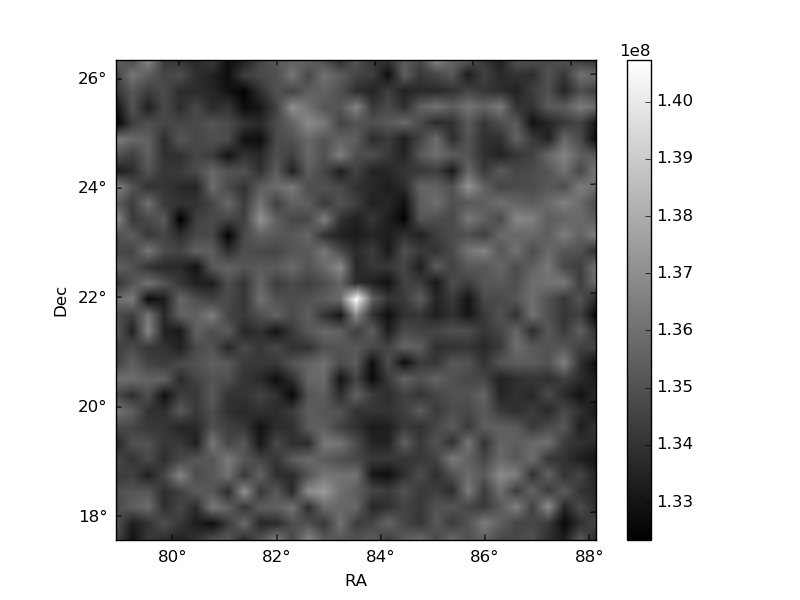
Histogram calculated using DETX and DETY for each event in the final _common_clean file
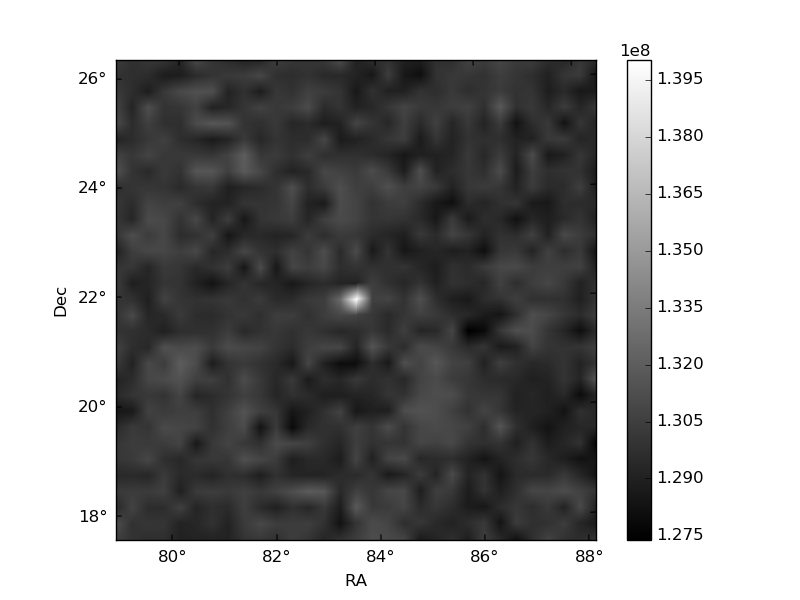
| Quadrant A | 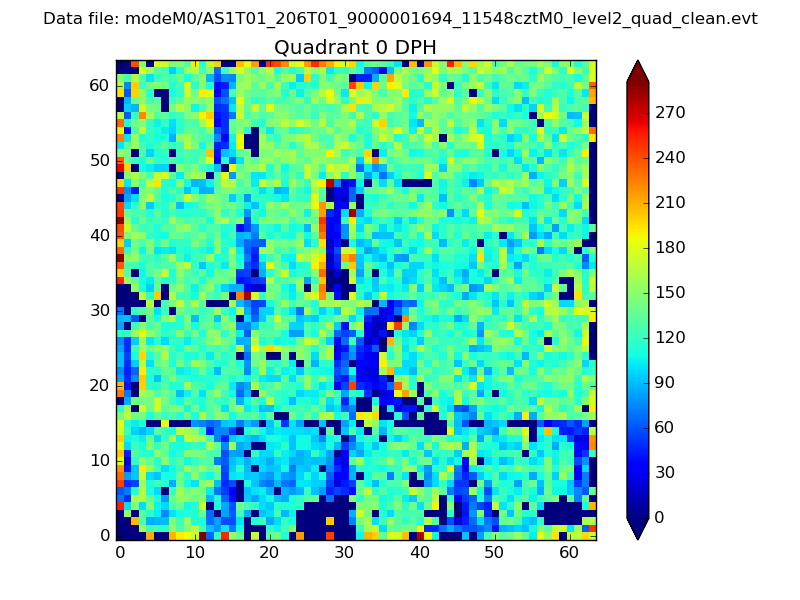 |
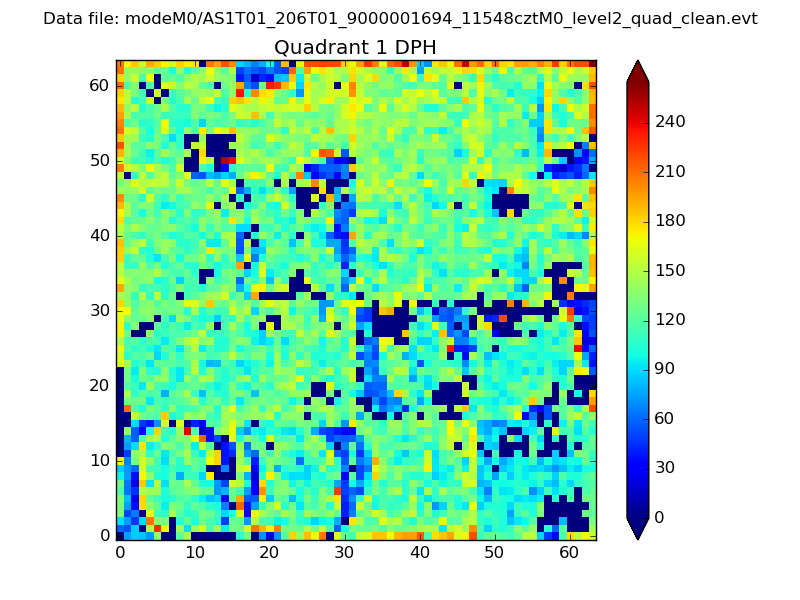 |
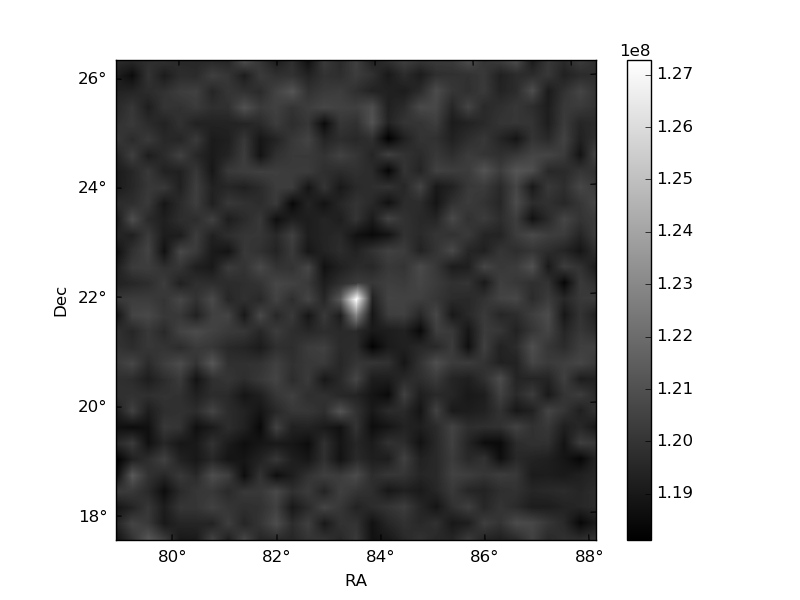
Quadrant B |
|---|---|---|---|
| Quadrant D | 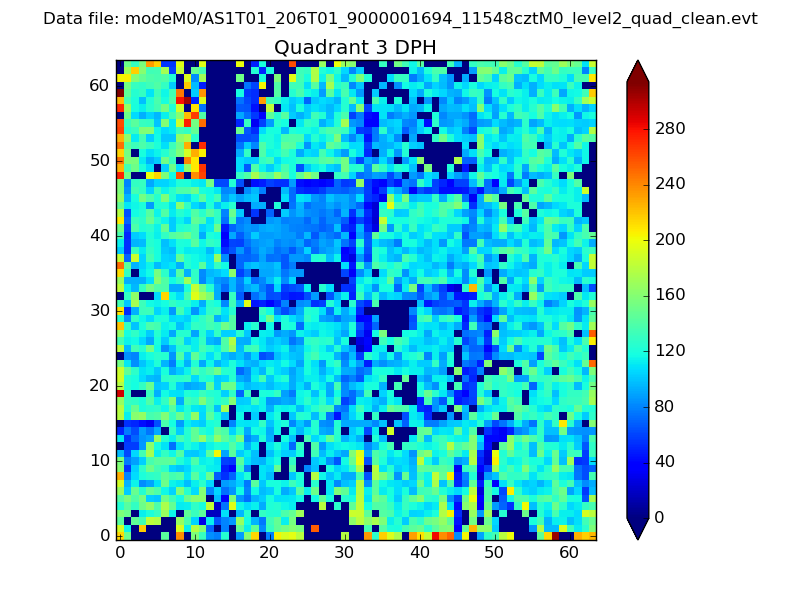 |
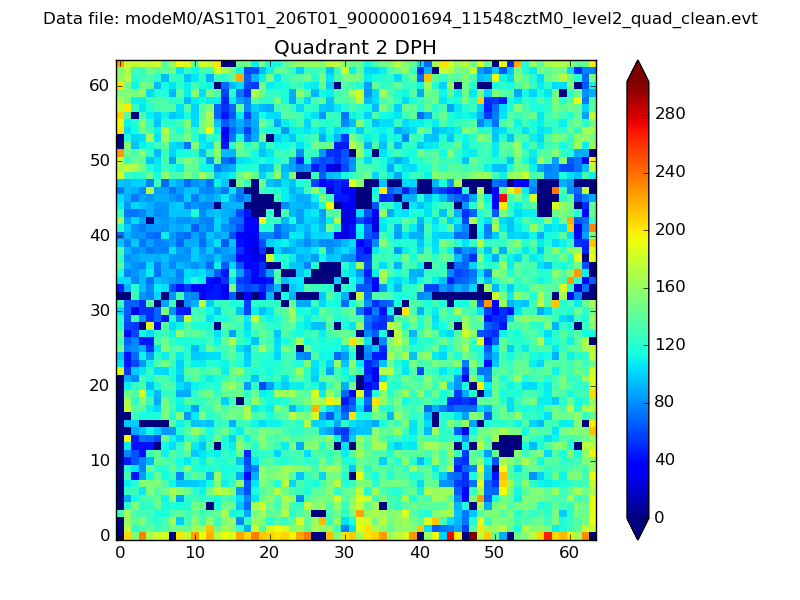 |
Quadrant C |
| Plot type | Count rate plots | Images |
|---|---|---|
| Comparison with Poisson distribution Blue bars denote a histogram of data divided into 1 sec bins. Red curve is a Poisson curve with rate = median count rate of data. |
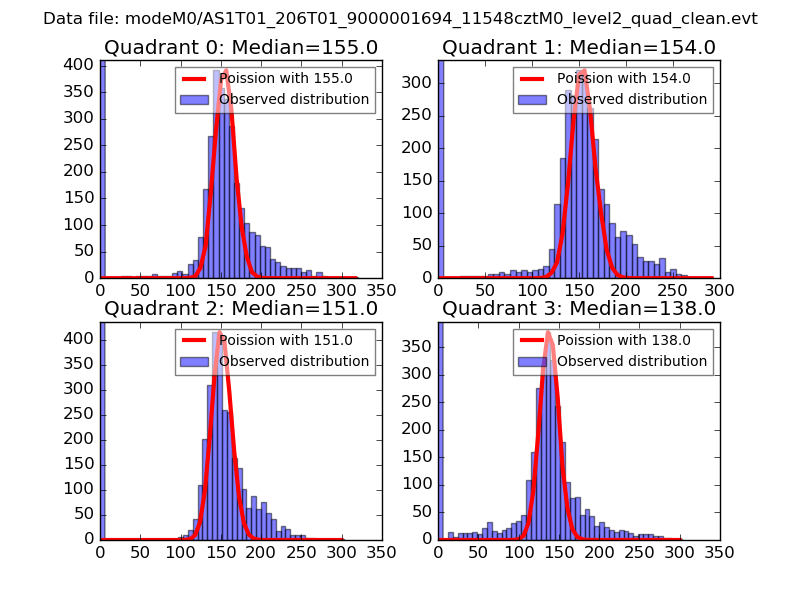 |
 |
| Quadrant-wise count rates Data is divided into 100 sec bins |
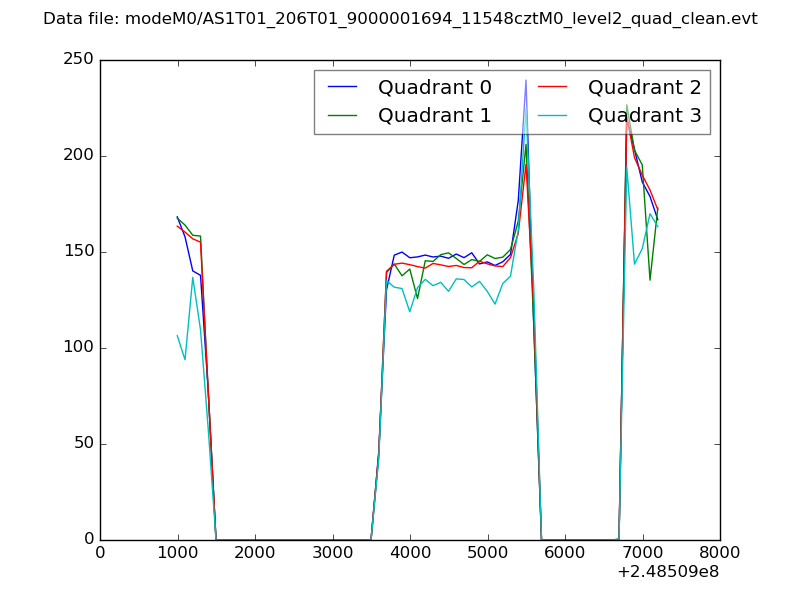 |
|
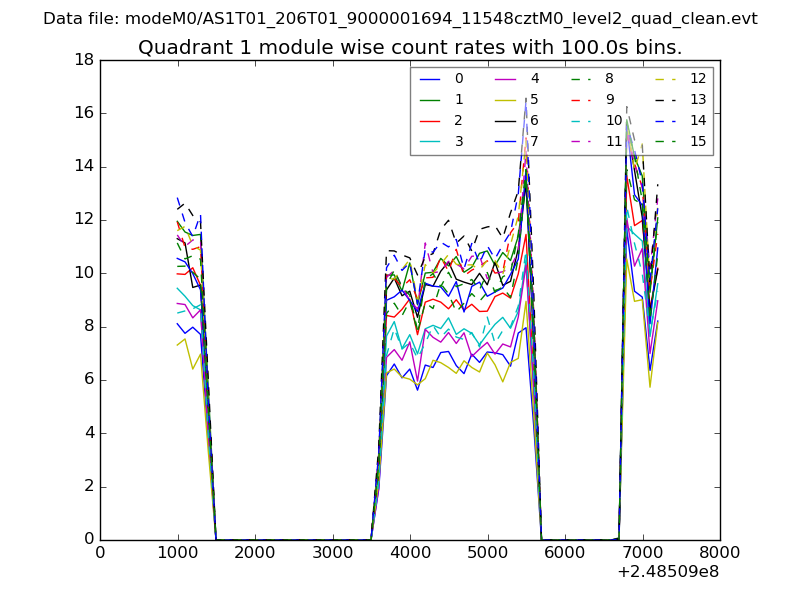
| Module-wise count rates for Quadrant A Data is divided into 100 sec bins |
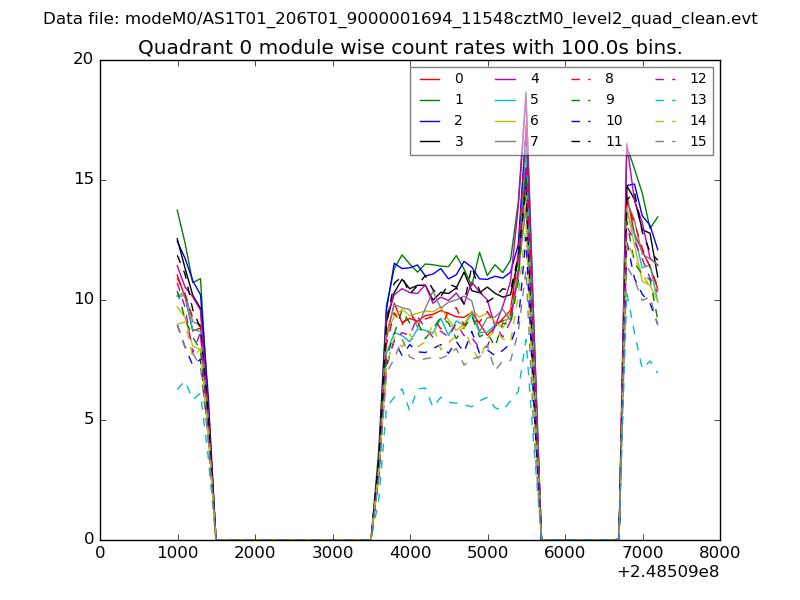 |
 |
| Module-wise count rates for Quadrant B Data is divided into 100 sec bins |
 |
 |
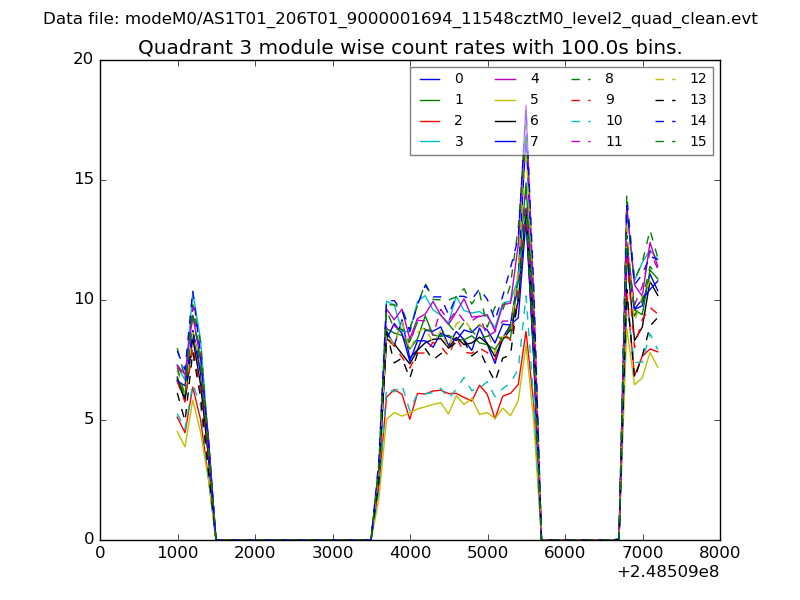
| Module-wise count rates for Quadrant C Data is divided into 100 sec bins |
 |
 |
| Module-wise count rates for Quadrant D Data is divided into 100 sec bins |
 |
 |
| Parameter | Plot |
|---|---|
| CZT HV Monitor | 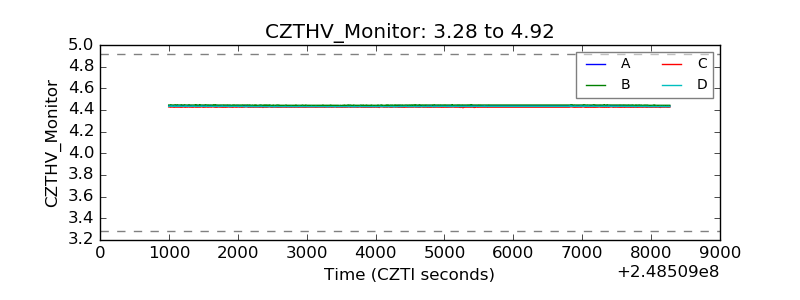 |
| D_VDD |  |
| Temperature 1 | 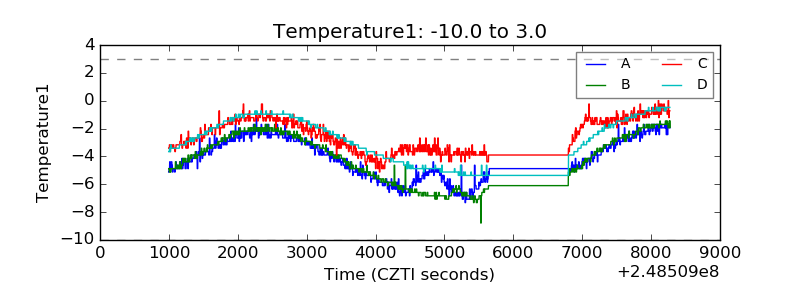 |
| Veto HV Monitor | 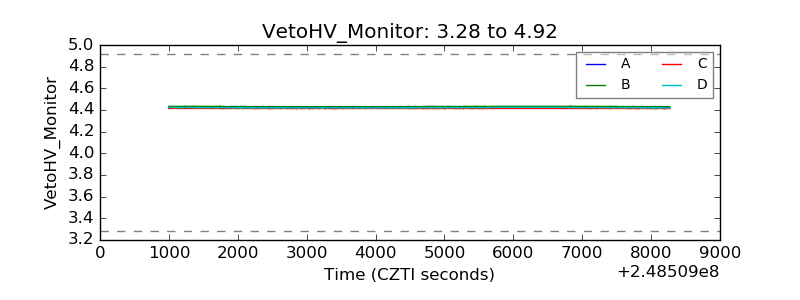 |
| Veto LLD | 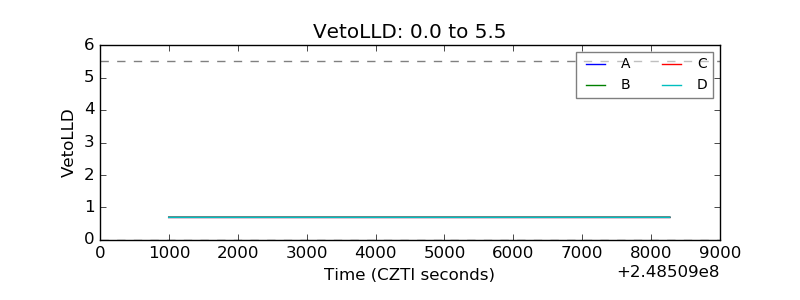 |
| Alpha Counter | 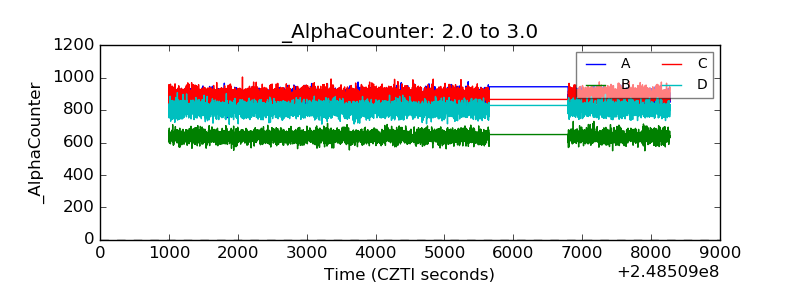 |
| _CPM_Rate | 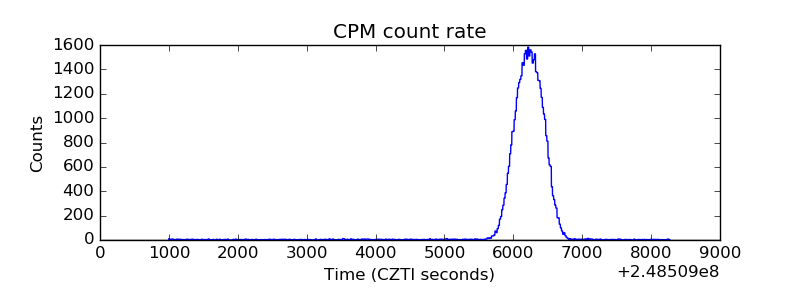 |
| CZT Counter | 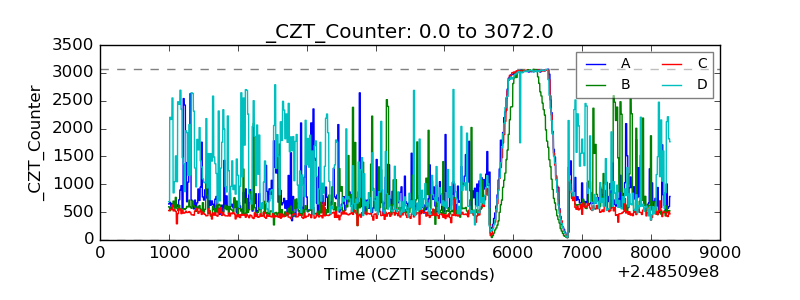 |
| +2.5 Volts monitor |  |
| +5 Volts monitor |  |
| _ROLL_ROT | 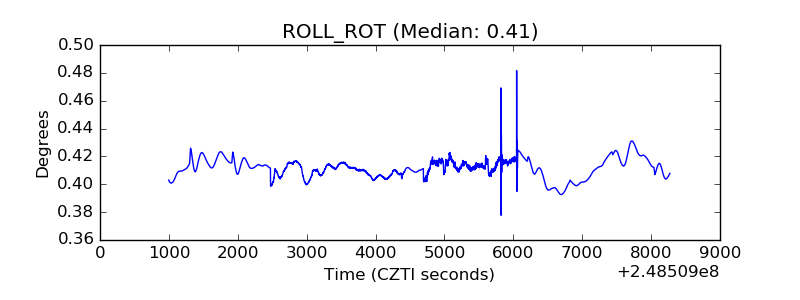 |
| _Roll_DEC | 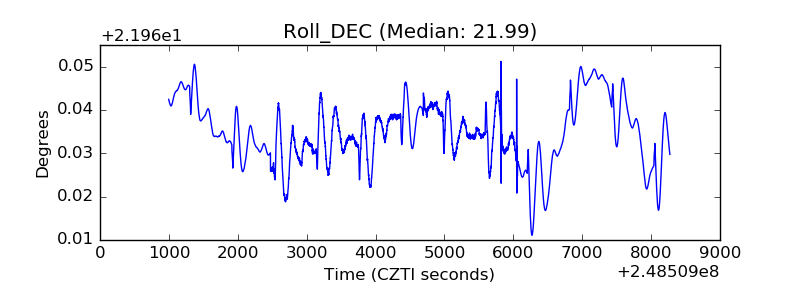 |
| _Roll_RA |  |
| Veto Counter | 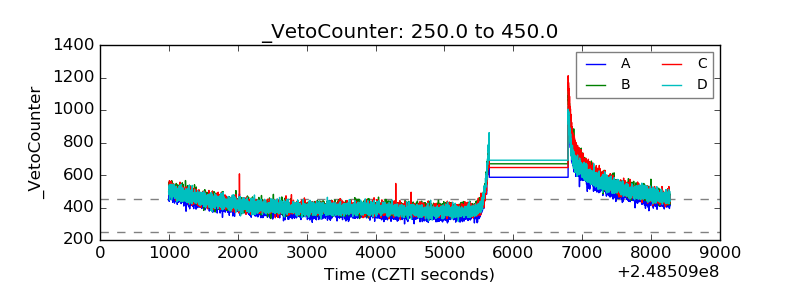 |