| Param | Original file | Final file |
|---|---|---|
| Filename | modeM0/AS1T01_206T01_9000001694_11550cztM0_level2.evt | modeM0/AS1T01_206T01_9000001694_11550cztM0_level2_quad_clean.evt |
| Size (bytes) | 619,320,960 | 66,971,520 |
| Size | 590.6 MB | 63.9 MB |
| Events in quadrant A | 5,347,921 | 398,140 |
| Events in quadrant B | 4,646,133 | 407,887 |
| Events in quadrant C | 3,180,521 | 405,148 |
| Events in quadrant D | 5,163,445 | 384,674 |
| Mode SS | |||
|---|---|---|---|
| Quadrant | BADHDUFLAG | Total packets | Discarded packets |
| A | 0 | 126 | 0 |
| B | 0 | 126 | 0 |
| C | 0 | 126 | 0 |
| D | 0 | 126 | 0 |
| Mode M0 | |||
|---|---|---|---|
| Quadrant | BADHDUFLAG | Total packets | Discarded packets |
| A | 0 | 20275 | 2 |
| B | 0 | 17886 | 1 |
| C | 0 | 13084 | 1 |
| D | 0 | 19410 | 1 |
| Mode M9 | |||
|---|---|---|---|
| Quadrant | BADHDUFLAG | Total packets | Discarded packets |
| A | 0 | 13 | 0 |
| B | 0 | 13 | 0 |
| C | 0 | 13 | 0 |
| D | 0 | 13 | 0 |
| Quadrant | Total seconds | Saturated seconds | Saturation percentage |
|---|---|---|---|
| A | 6183 | 471 | 7.617661% |
| B | 6183 | 423 | 6.841339% |
| C | 6183 | 56 | 0.905709% |
| D | 6183 | 690 | 11.159631% |
Noise dominated data is calculated using 1-second bins in cleaned event files. If a bin has >2000 counts, and if more than 50% of those come from <1% of pixels, then it is considered to be noise-dominated and hence unusable.
| Quadrant | # 1 sec bins | Bins with >0 counts | Bins with >2000 counts | High rate bins dominated by noise | Noise dominated (total time) | Noise dominated (detector-on time) | Marked lightcurve |
|---|---|---|---|---|---|---|---|
| A | 7479 | 6185 | 225 | 225 | 3.01% | 3.64% | 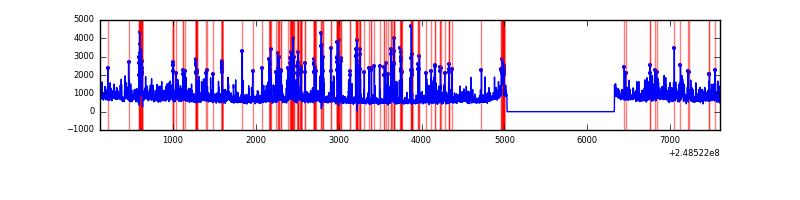 |
| B | 7479 | 6185 | 210 | 210 | 2.81% | 3.40% | 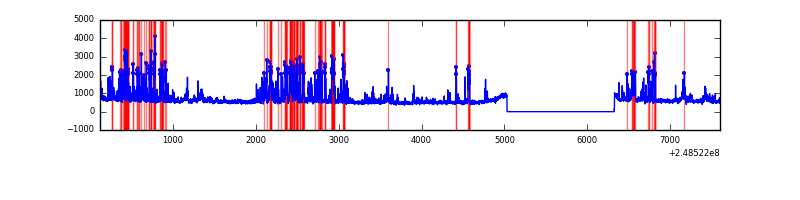 |
| C | 7479 | 6185 | 0 | 0 | 0.00% | 0.00% | 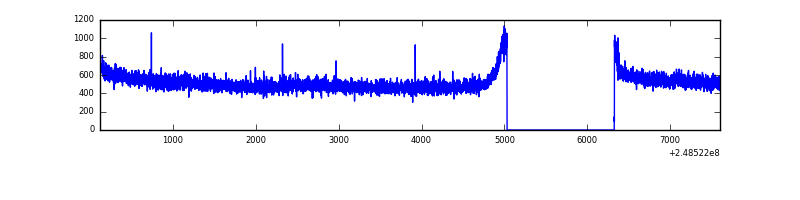 |
| D | 7479 | 6185 | 493 | 493 | 6.59% | 7.97% | 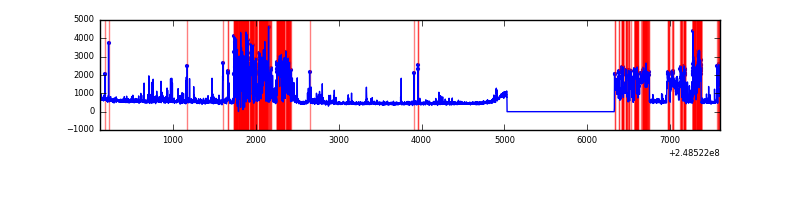 |
Top three noisy pixels from each quadrant. If the there are fewer than three noisy pixels in the level2.evt file, extra rows are filled as -1
| Pixel properties | Quadrant properties | ||||||
|---|---|---|---|---|---|---|---|
| Quadrant | DetID | PixID | Counts | Sigma | Mean | Median | Sigma |
| A | 8 | 5 | 1846957 | 11187.31 | 818 | 804 | 165.0 |
| A | 1 | 162 | 104634 | 629.19 | 818 | 804 | 165.0 |
| A | 1 | 178 | 63806 | 381.78 | 818 | 804 | 165.0 |
| B | 4 | 239 | 1059463 | 6842.65 | 821 | 806 | 154.7 |
| B | 3 | 64 | 202142 | 1301.34 | 821 | 806 | 154.7 |
| B | 11 | 51 | 81278 | 520.13 | 821 | 806 | 154.7 |
| C | 13 | 61 | 6200 | 29.0 | 814 | 820 | 185.5 |
| C | 7 | 159 | 3855 | 16.36 | 814 | 820 | 185.5 |
| C | 13 | 250 | 2593 | 9.56 | 814 | 820 | 185.5 |
| D | 2 | 120 | 1083952 | 5819.9 | 778 | 759 | 186.1 |
| D | 1 | 52 | 962088 | 5165.13 | 778 | 759 | 186.1 |
| D | 13 | 137 | 48406 | 256.0 | 778 | 759 | 186.1 |
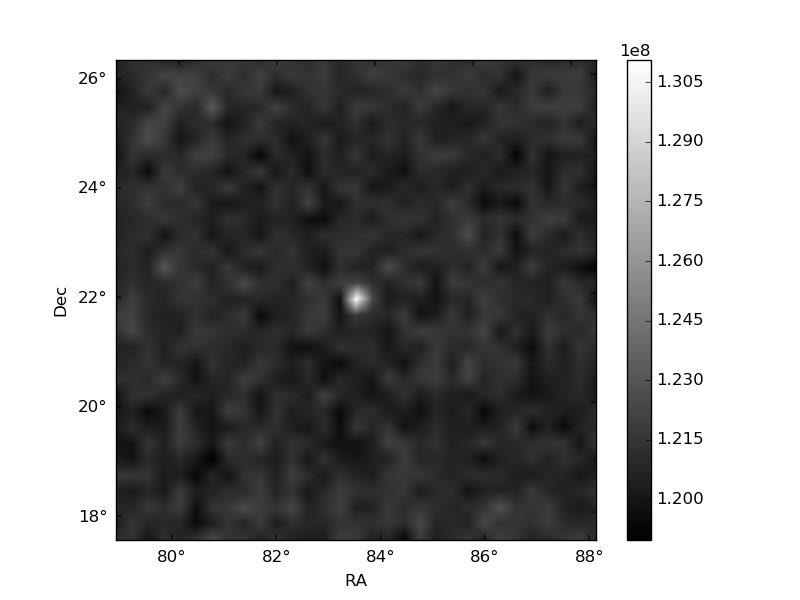
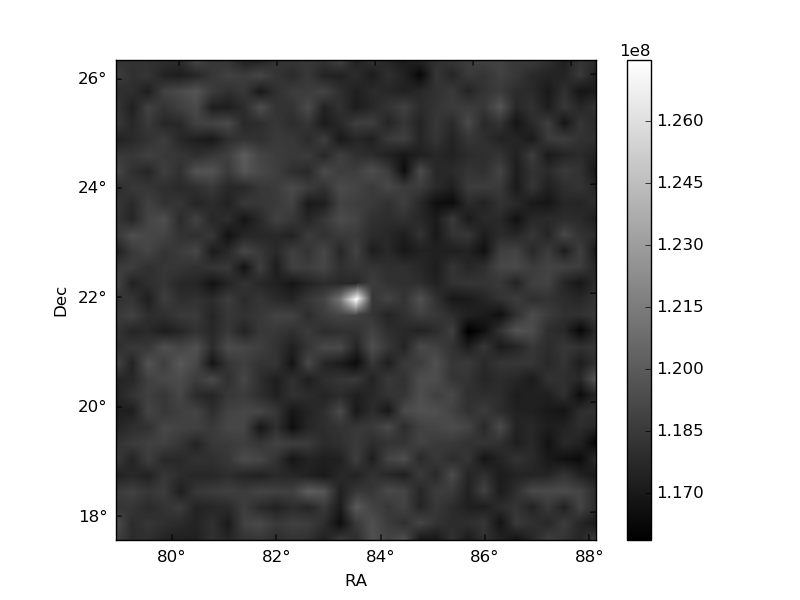
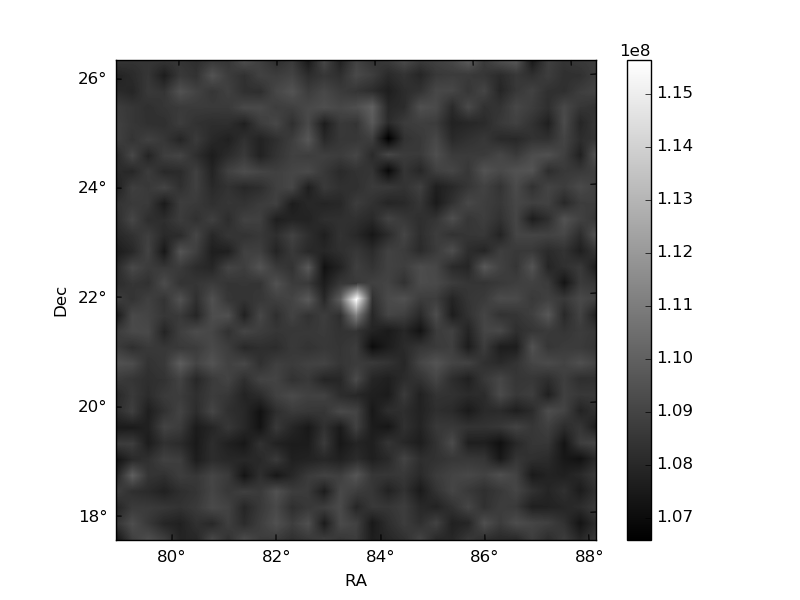
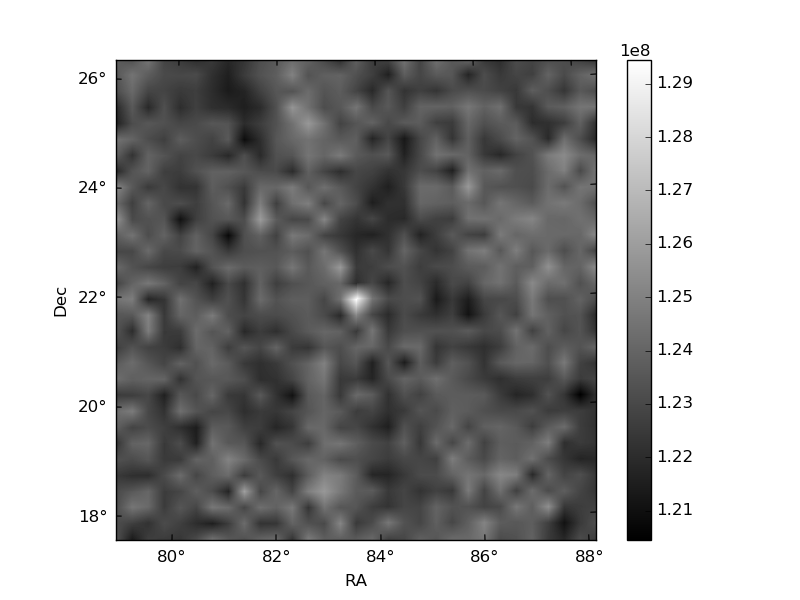
Histogram calculated using DETX and DETY for each event in the final _common_clean file
| Quadrant A | 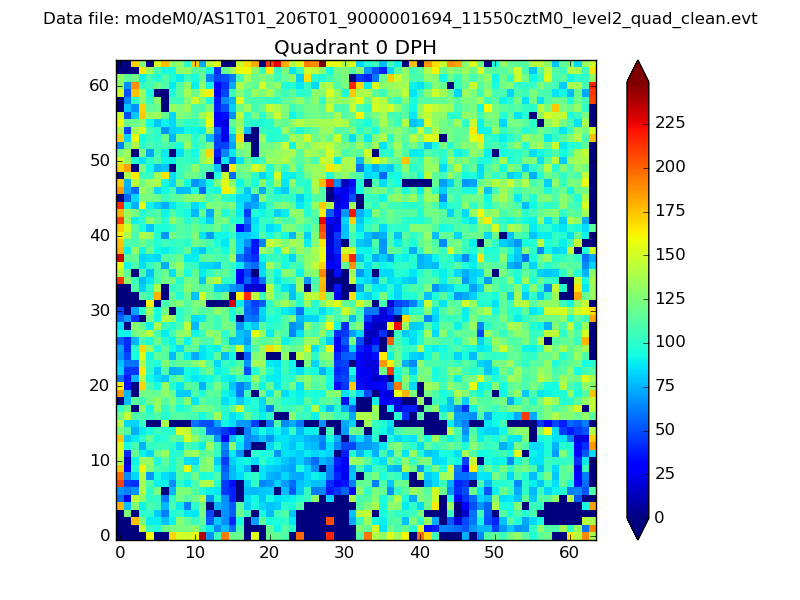 |
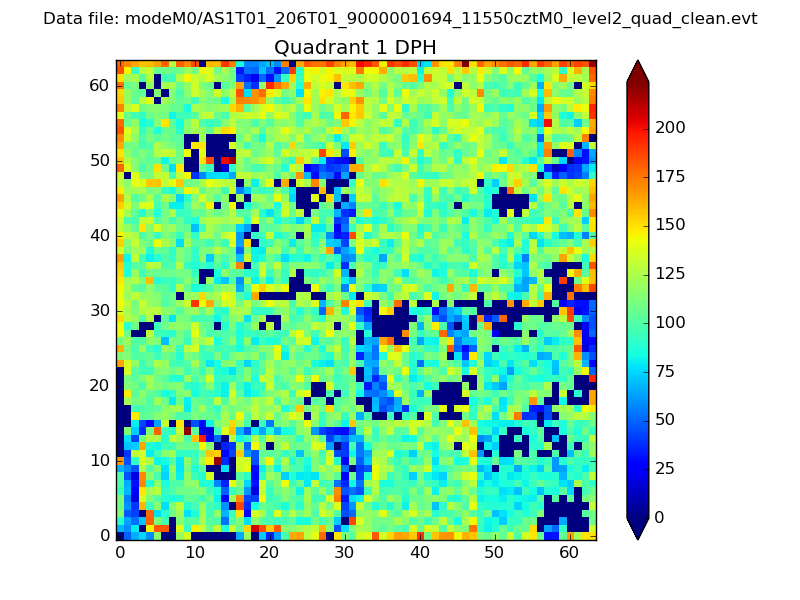 |
Quadrant B |
|---|---|---|---|
| Quadrant D | 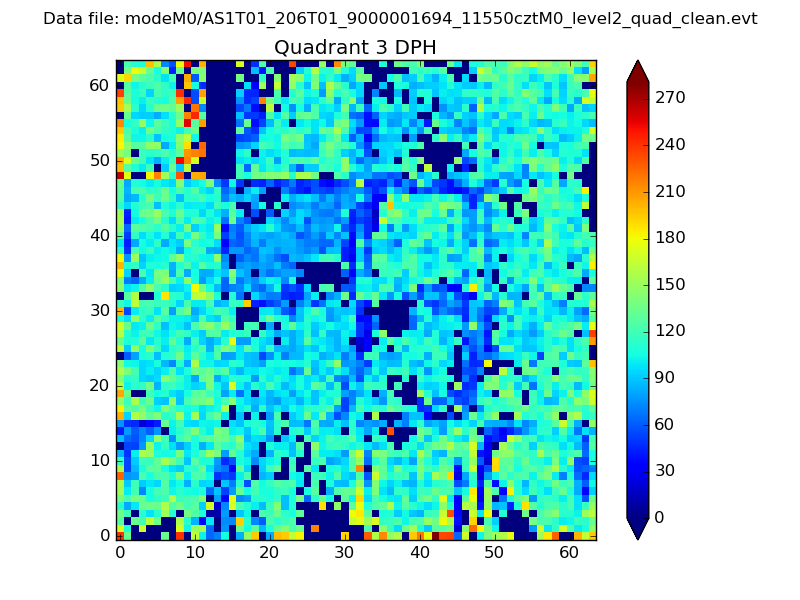 |
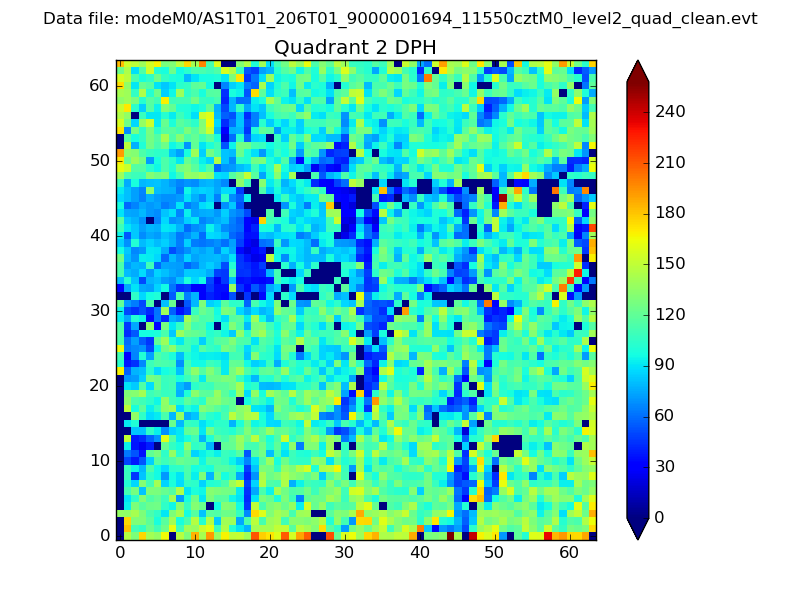 |
Quadrant C |
| Plot type | Count rate plots | Images |
|---|---|---|
| Comparison with Poisson distribution Blue bars denote a histogram of data divided into 1 sec bins. Red curve is a Poisson curve with rate = median count rate of data. |
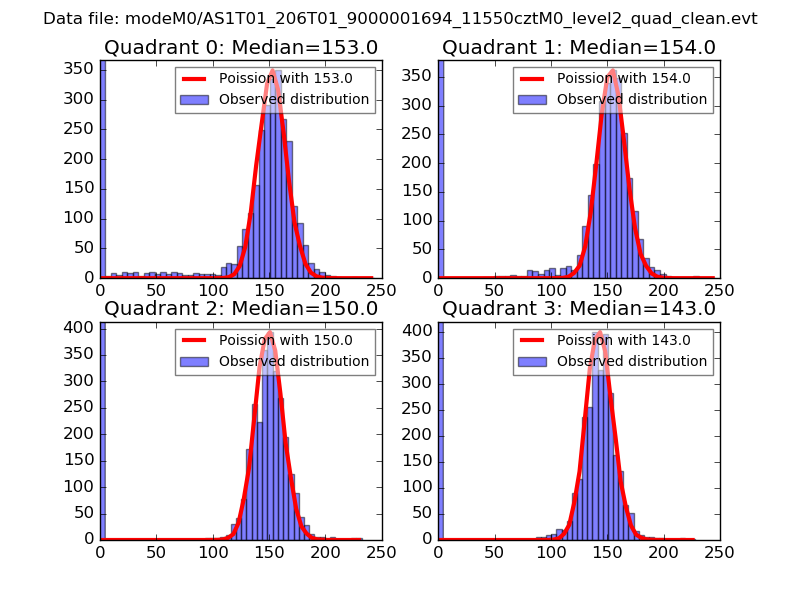 |
 |
| Quadrant-wise count rates Data is divided into 100 sec bins |
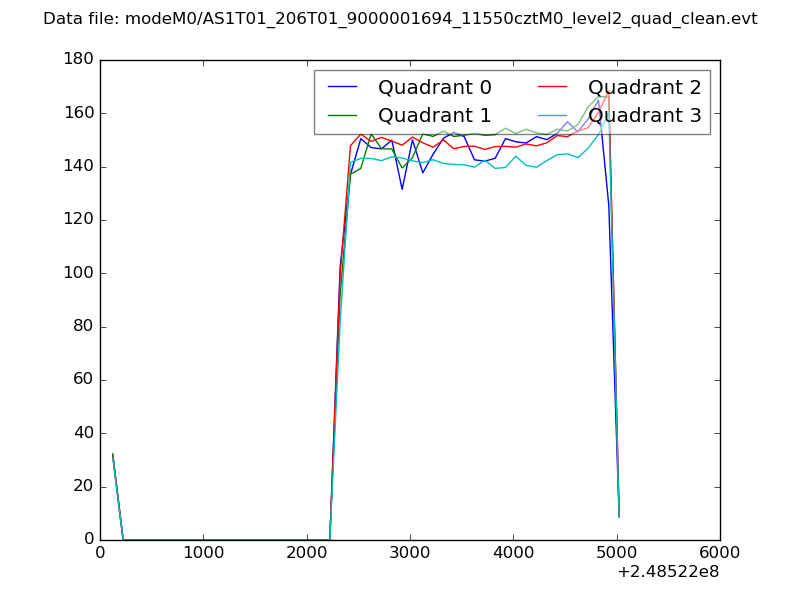 |
|
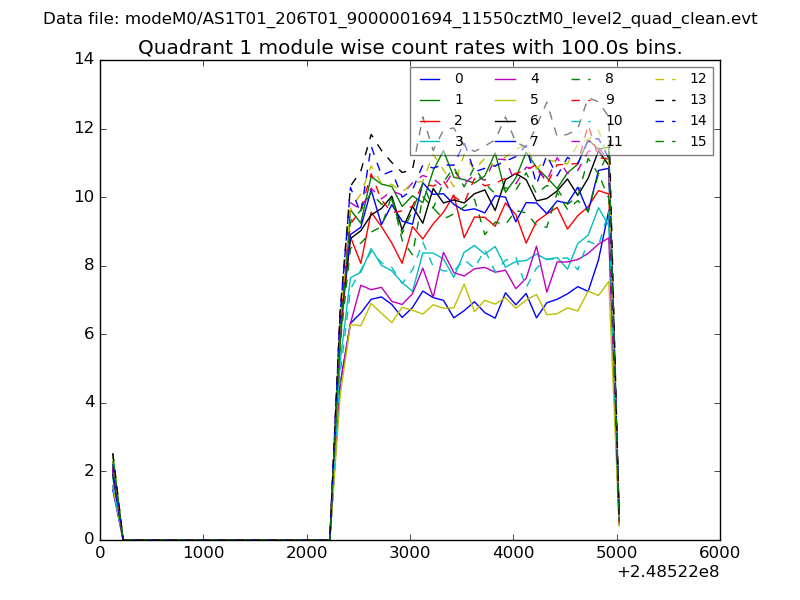
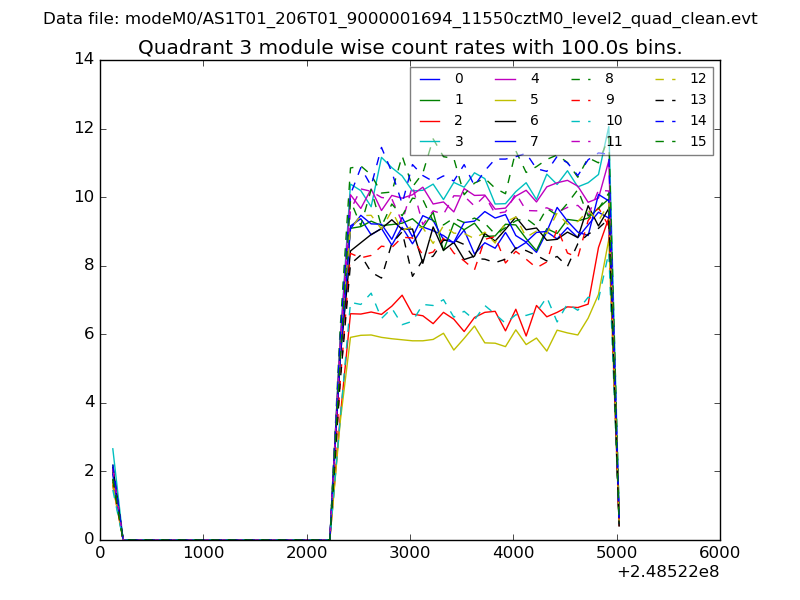
| Module-wise count rates for Quadrant A Data is divided into 100 sec bins |
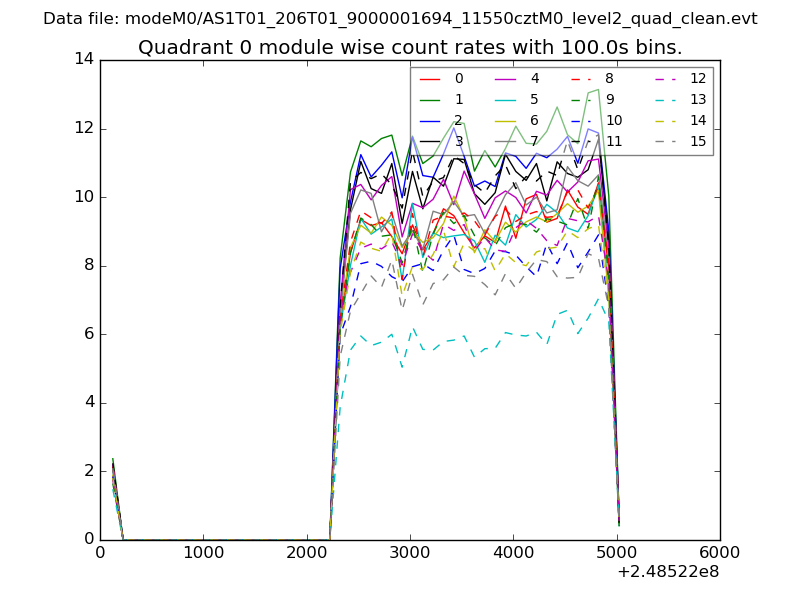 |
 |
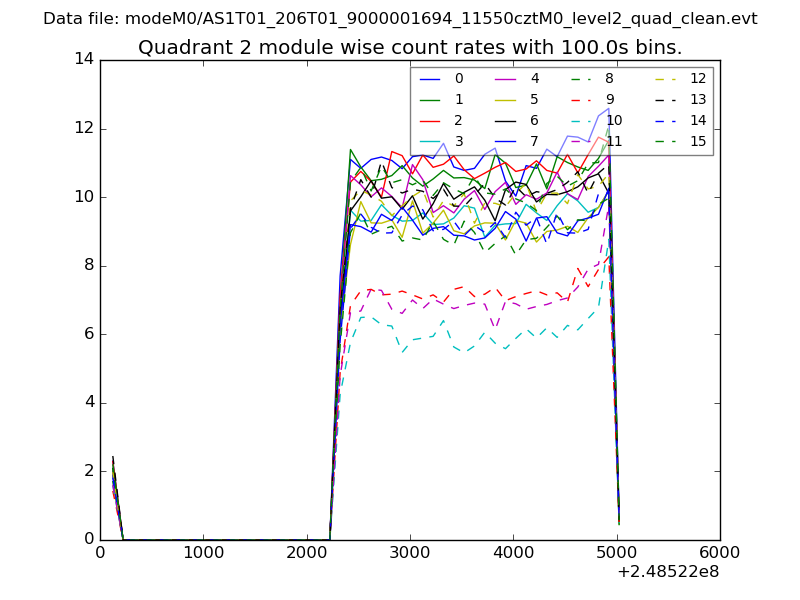
| Module-wise count rates for Quadrant B Data is divided into 100 sec bins |
 |
 |
| Module-wise count rates for Quadrant C Data is divided into 100 sec bins |
 |
 |
| Module-wise count rates for Quadrant D Data is divided into 100 sec bins |
 |
 |
| Parameter | Plot |
|---|---|
| CZT HV Monitor | 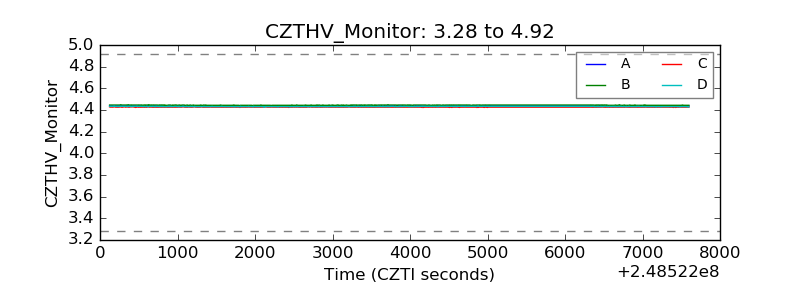 |
| D_VDD |  |
| Temperature 1 | 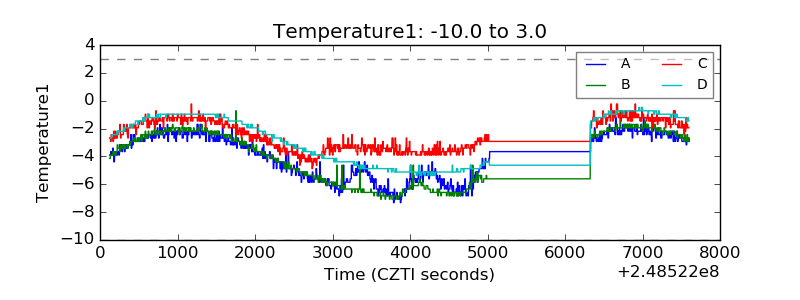 |
| Veto HV Monitor | 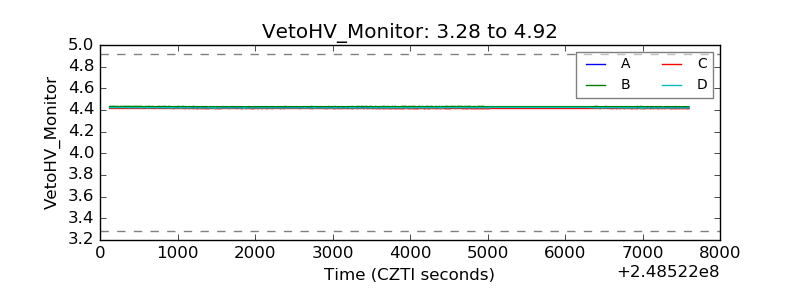 |
| Veto LLD | 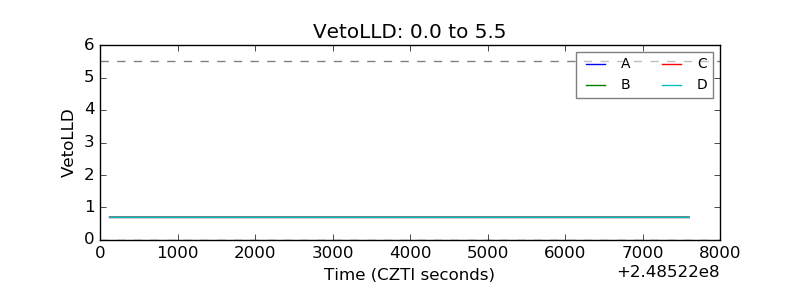 |
| Alpha Counter |  |
| _CPM_Rate | 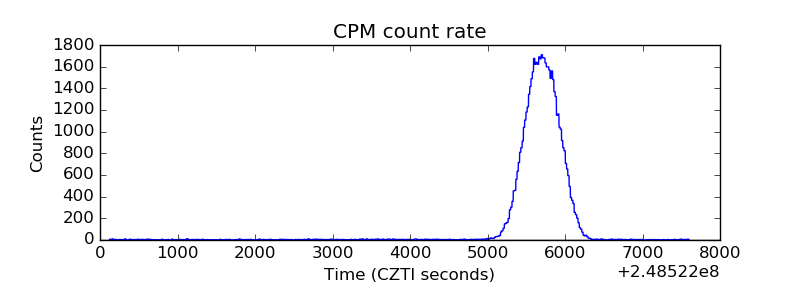 |
| CZT Counter | 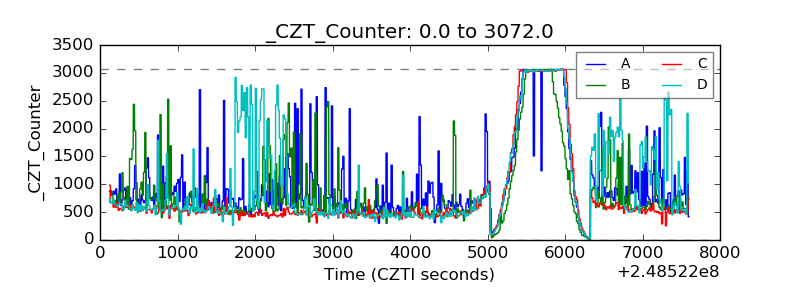 |
| +2.5 Volts monitor |  |
| +5 Volts monitor |  |
| _ROLL_ROT | 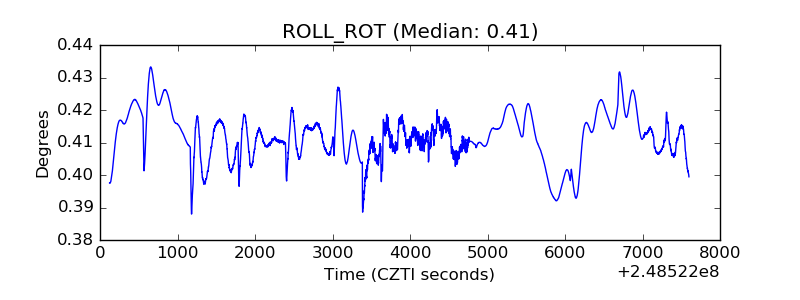 |
| _Roll_DEC | 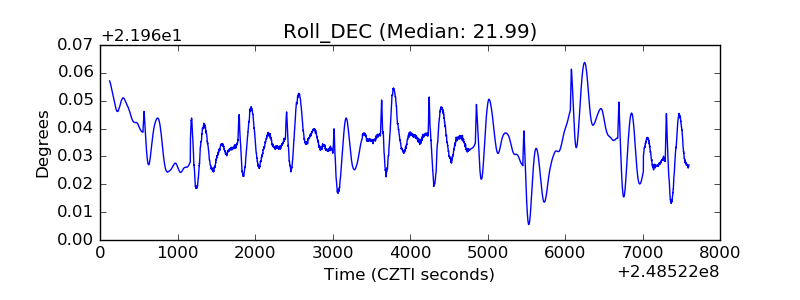 |
| _Roll_RA |  |
| Veto Counter | 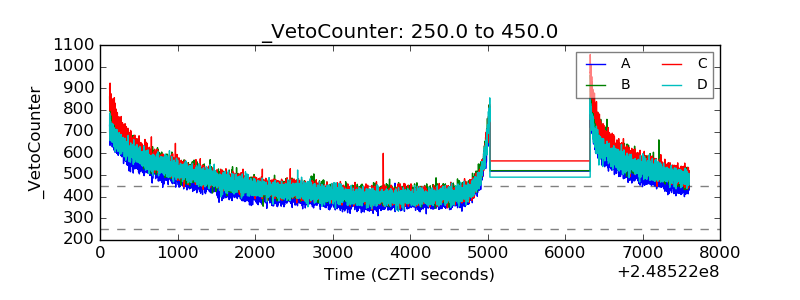 |