| Param | Original file | Final file |
|---|---|---|
| Filename | modeM0/AS1A04_112T01_9000001698cztM0_level2.fits | modeM0/AS1A04_112T01_9000001698cztM0_level2_quad_clean.evt |
| Size (bytes) | 418,371,840 | 485,896,320 |
| Size | 399.0 MB | 463.4 MB |
| Events in quadrant A | 2,398,780 | 2,907,184 |
| Events in quadrant B | 2,387,192 | 2,969,033 |
| Events in quadrant C | 2,511,620 | 2,933,086 |
| Events in quadrant D | 2,179,432 | 2,717,075 |
| Mode SS | |||
|---|---|---|---|
| Quadrant | BADHDUFLAG | Total packets | Discarded packets |
| A | 0 | 944 | 0 |
| B | 0 | 944 | 0 |
| C | 0 | 944 | 0 |
| D | 0 | 944 | 0 |
| Mode M0 | |||
|---|---|---|---|
| Quadrant | BADHDUFLAG | Total packets | Discarded packets |
| A | 0 | 152615 | 0 |
| B | 0 | 131492 | 0 |
| C | 0 | 94792 | 0 |
| D | 0 | 109109 | 0 |
| Mode M9 | |||
|---|---|---|---|
| Quadrant | BADHDUFLAG | Total packets | Discarded packets |
| A | 0 | 64 | 0 |
| B | 0 | 64 | 0 |
| C | 0 | 64 | 0 |
| D | 0 | 64 | 0 |
| Quadrant | Total seconds | Saturated seconds | Saturation percentage |
|---|---|---|---|
| A | 46475 | 5161 | 11.104895% |
| B | 46475 | 4026 | 8.662722% |
| C | 46475 | 412 | 0.886498% |
| D | 46475 | 1195 | 2.571275% |
Noise dominated data is calculated using 1-second bins in cleaned event files. If a bin has >2000 counts, and if more than 50% of those come from <1% of pixels, then it is considered to be noise-dominated and hence unusable.
| Quadrant | # 1 sec bins | Bins with >0 counts | Bins with >2000 counts | High rate bins dominated by noise | Noise dominated (total time) | Noise dominated (detector-on time) | Marked lightcurve |
|---|---|---|---|---|---|---|---|
| A | 52720 | 46164 | 0 | 0 | 0.00% | 0.00% |  |
| B | 52720 | 46461 | 0 | 0 | 0.00% | 0.00% |  |
| C | 52720 | 46475 | 0 | 0 | 0.00% | 0.00% | 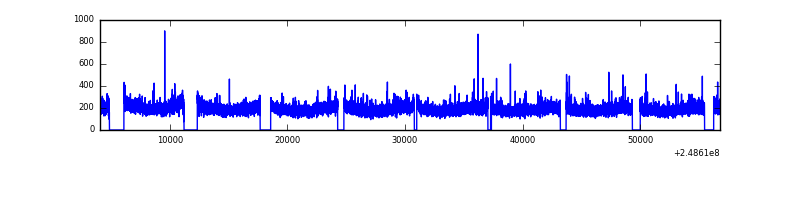 |
| D | 52720 | 46473 | 0 | 0 | 0.00% | 0.00% |  |
Top three noisy pixels from each quadrant. If the there are fewer than three noisy pixels in the level2.evt file, extra rows are filled as -1
| Pixel properties | Quadrant properties | ||||||
|---|---|---|---|---|---|---|---|
| Quadrant | DetID | PixID | Counts | Sigma | Mean | Median | Sigma |
| A | 0 | 29 | 2330 | 11.02 | 625 | 587 | 158.2 |
| A | 7 | 110 | 2002 | 8.94 | 625 | 587 | 158.2 |
| A | 9 | 19 | 1822 | 7.81 | 625 | 587 | 158.2 |
| B | 2 | 9 | 2076 | 11.83 | 630 | 600 | 124.7 |
| B | 3 | 17 | 1623 | 8.2 | 630 | 600 | 124.7 |
| B | 14 | 254 | 1553 | 7.64 | 630 | 600 | 124.7 |
| C | 3 | 158 | 1706 | 6.24 | 664 | 617 | 174.4 |
| C | 2 | 191 | 1686 | 6.13 | 664 | 617 | 174.4 |
| C | 3 | 126 | 1664 | 6.0 | 664 | 617 | 174.4 |
| D | 6 | 231 | 1635 | 6.36 | 623 | 566 | 168.0 |
| D | 7 | 3 | 1528 | 5.73 | 623 | 566 | 168.0 |
| D | 4 | 160 | 1524 | 5.7 | 623 | 566 | 168.0 |
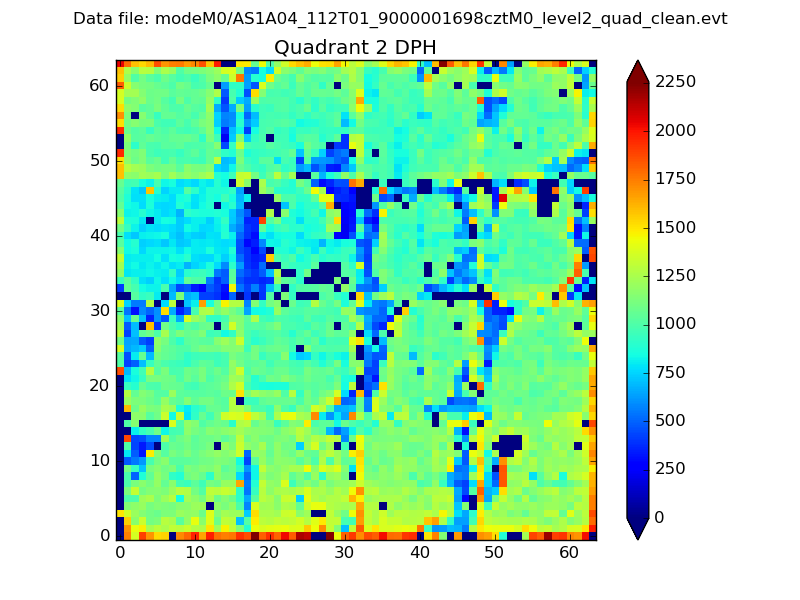
Histogram calculated using DETX and DETY for each event in the final _common_clean file
| Quadrant A | 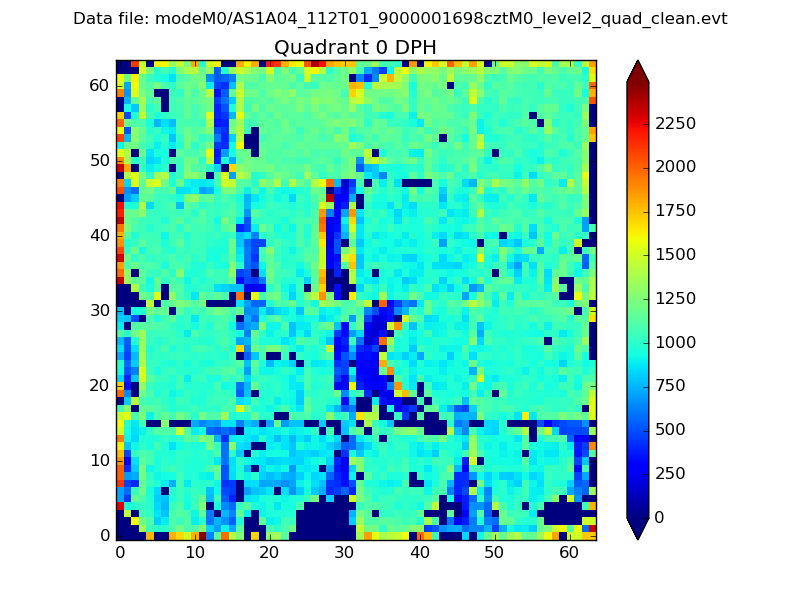 |
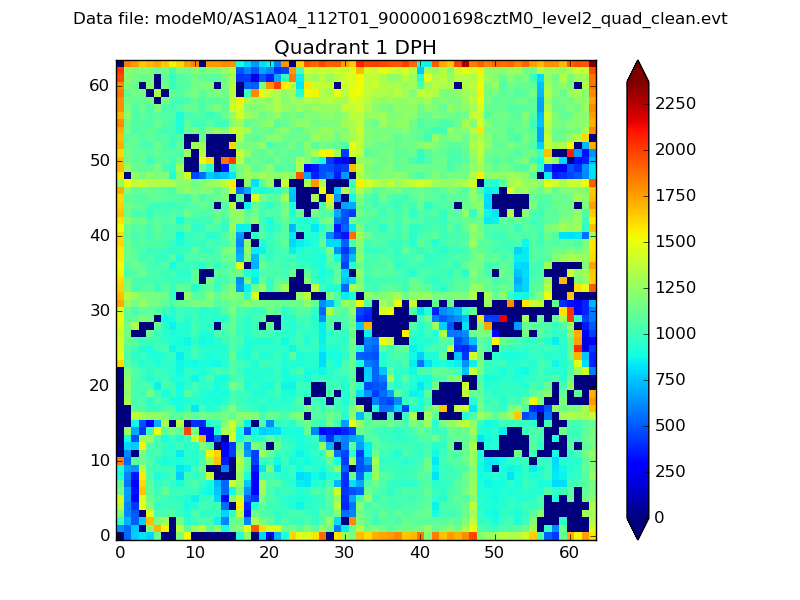 |
Quadrant B |
|---|---|---|---|
| Quadrant D | 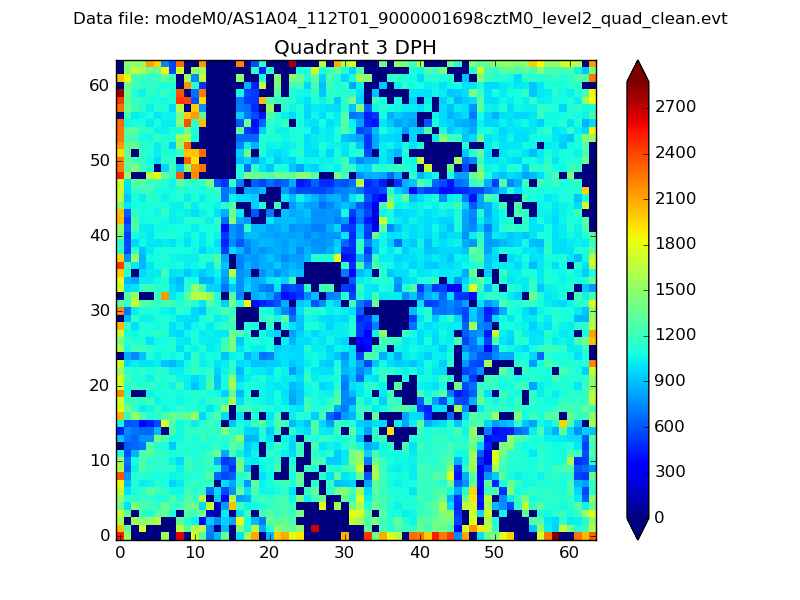 |
 |
Quadrant C |
| Plot type | Count rate plots | Images |
|---|---|---|
| Comparison with Poisson distribution Blue bars denote a histogram of data divided into 1 sec bins. Red curve is a Poisson curve with rate = median count rate of data. |
 |
 |
| Quadrant-wise count rates Data is divided into 100 sec bins |
 |
|
| Module-wise count rates for Quadrant A Data is divided into 100 sec bins |
 |
 |
| Module-wise count rates for Quadrant B Data is divided into 100 sec bins |
 |
 |
| Module-wise count rates for Quadrant C Data is divided into 100 sec bins |
 |
 |
| Module-wise count rates for Quadrant D Data is divided into 100 sec bins |
 |
 |
| Parameter | Plot |
|---|---|
| CZT HV Monitor |  |
| D_VDD | 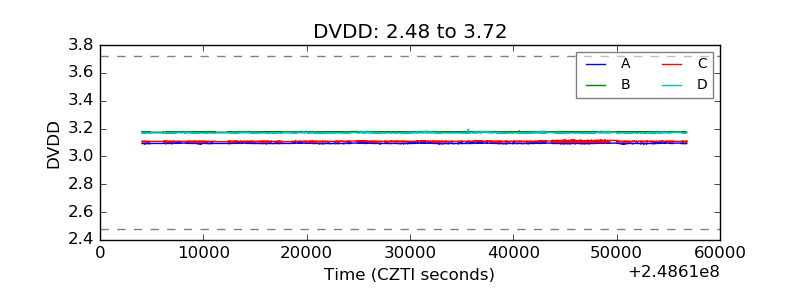 |
| Temperature 1 |  |
| Veto HV Monitor |  |
| Veto LLD |  |
| Alpha Counter |  |
| _CPM_Rate |  |
| CZT Counter |  |
| +2.5 Volts monitor |  |
| +5 Volts monitor |  |
| _ROLL_ROT |  |
| _Roll_DEC |  |
| _Roll_RA |  |
| Veto Counter |  |