| Param | Original file | Final file |
|---|---|---|
| Filename | modeM0/AS1A04_112T01_9000001698_11565cztM0_level2.evt | modeM0/AS1A04_112T01_9000001698_11565cztM0_level2_quad_clean.evt |
| Size (bytes) | 247,904,640 | 21,559,680 |
| Size | 236.4 MB | 20.6 MB |
| Events in quadrant A | 2,638,729 | 114,957 |
| Events in quadrant B | 1,989,393 | 120,433 |
| Events in quadrant C | 1,262,907 | 122,031 |
| Events in quadrant D | 1,447,651 | 117,531 |
| Mode SS | |||
|---|---|---|---|
| Quadrant | BADHDUFLAG | Total packets | Discarded packets |
| A | 0 | 50 | 0 |
| B | 0 | 50 | 0 |
| C | 0 | 50 | 0 |
| D | 0 | 50 | 0 |
| Mode M0 | |||
|---|---|---|---|
| Quadrant | BADHDUFLAG | Total packets | Discarded packets |
| A | 0 | 9581 | 2 |
| B | 0 | 7570 | 1 |
| C | 0 | 5252 | 1 |
| D | 0 | 5952 | 1 |
| Mode M9 | |||
|---|---|---|---|
| Quadrant | BADHDUFLAG | Total packets | Discarded packets |
| A | 0 | 13 | 0 |
| B | 0 | 13 | 0 |
| C | 0 | 13 | 0 |
| D | 0 | 13 | 0 |
| Quadrant | Total seconds | Saturated seconds | Saturation percentage |
|---|---|---|---|
| A | 2467 | 546 | 22.132144% |
| B | 2467 | 339 | 13.741386% |
| C | 2467 | 106 | 4.296717% |
| D | 2467 | 109 | 4.418322% |
Noise dominated data is calculated using 1-second bins in cleaned event files. If a bin has >2000 counts, and if more than 50% of those come from <1% of pixels, then it is considered to be noise-dominated and hence unusable.
| Quadrant | # 1 sec bins | Bins with >0 counts | Bins with >2000 counts | High rate bins dominated by noise | Noise dominated (total time) | Noise dominated (detector-on time) | Marked lightcurve |
|---|---|---|---|---|---|---|---|
| A | 3703 | 2469 | 272 | 272 | 7.35% | 11.02% | 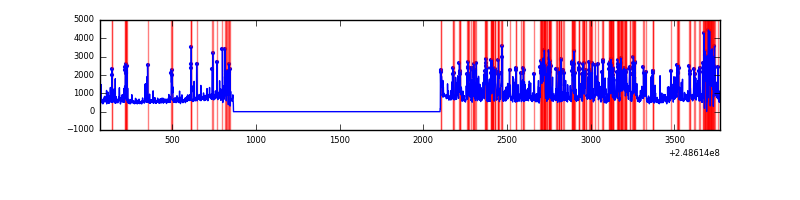 |
| B | 3703 | 2469 | 140 | 140 | 3.78% | 5.67% | 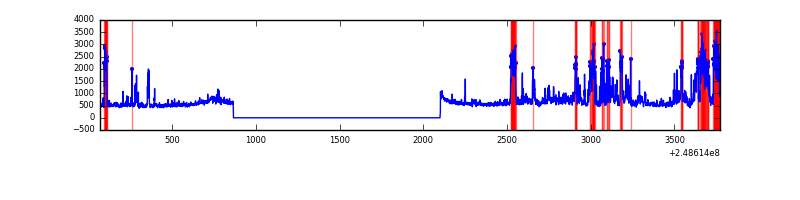 |
| C | 3703 | 2469 | 0 | 0 | 0.00% | 0.00% | 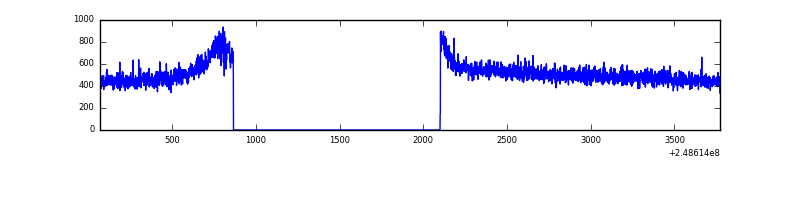 |
| D | 3703 | 2469 | 6 | 6 | 0.16% | 0.24% | 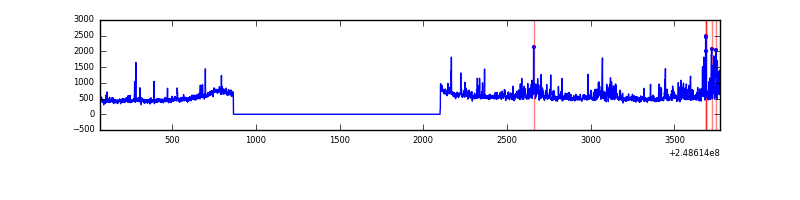 |
Top three noisy pixels from each quadrant. If the there are fewer than three noisy pixels in the level2.evt file, extra rows are filled as -1
| Pixel properties | Quadrant properties | ||||||
|---|---|---|---|---|---|---|---|
| Quadrant | DetID | PixID | Counts | Sigma | Mean | Median | Sigma |
| A | 8 | 5 | 1330626 | 21064.29 | 305 | 298 | 63.2 |
| A | 1 | 162 | 40601 | 638.15 | 305 | 298 | 63.2 |
| A | 1 | 178 | 24888 | 389.36 | 305 | 298 | 63.2 |
| B | 4 | 239 | 532883 | 8651.04 | 319 | 311 | 61.6 |
| B | 15 | 204 | 108645 | 1759.77 | 319 | 311 | 61.6 |
| B | 15 | 255 | 40333 | 650.11 | 319 | 311 | 61.6 |
| C | 13 | 61 | 2463 | 28.78 | 323 | 324 | 74.3 |
| C | 3 | 202 | 800 | 6.4 | 323 | 324 | 74.3 |
| C | 3 | 203 | 707 | 5.15 | 323 | 324 | 74.3 |
| D | 2 | 120 | 82593 | 1059.16 | 324 | 313 | 77.7 |
| D | 1 | 52 | 77162 | 989.25 | 324 | 313 | 77.7 |
| D | 10 | 199 | 16511 | 208.51 | 324 | 313 | 77.7 |
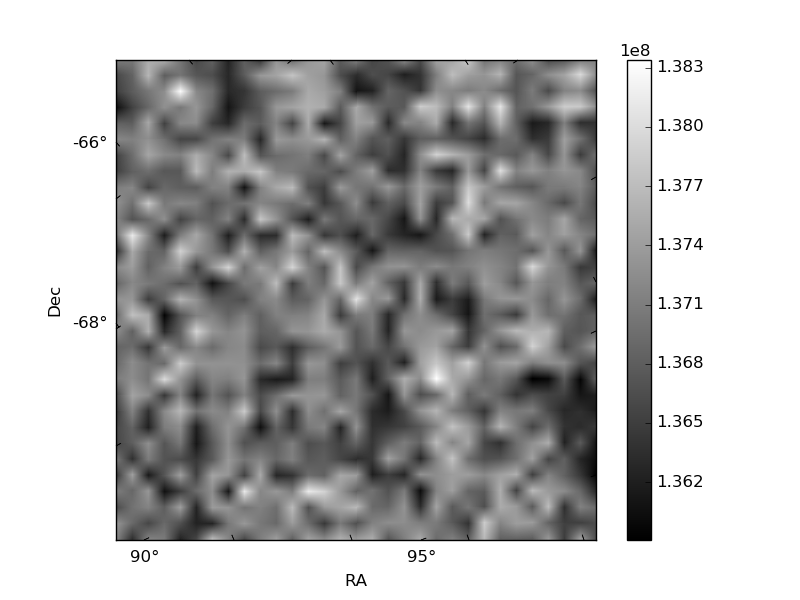
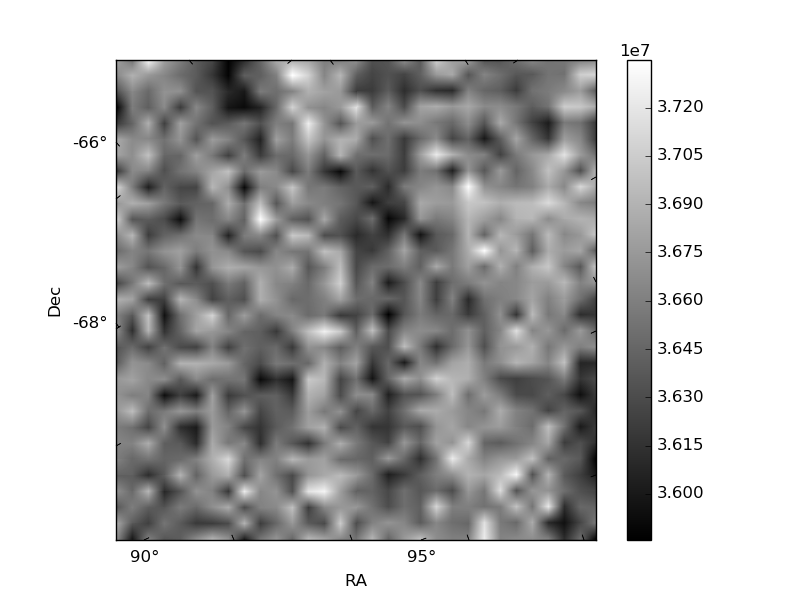
Histogram calculated using DETX and DETY for each event in the final _common_clean file
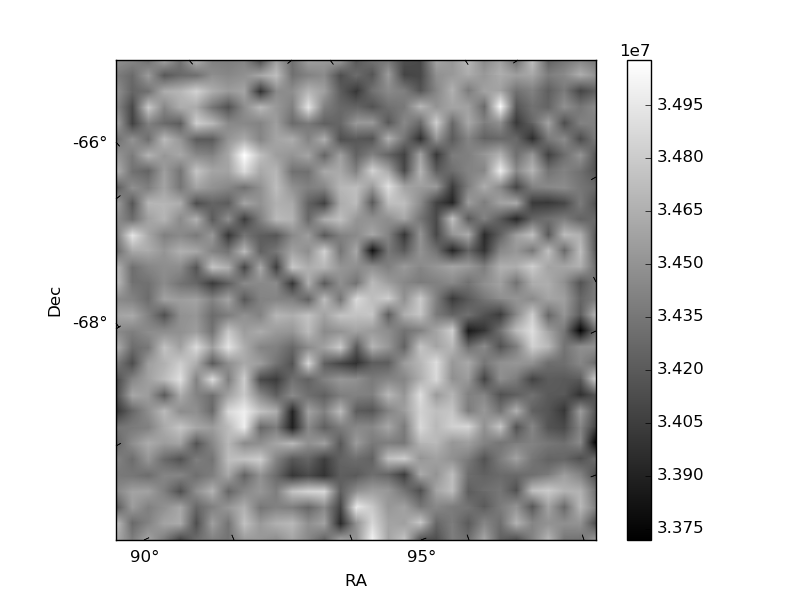
| Quadrant A | 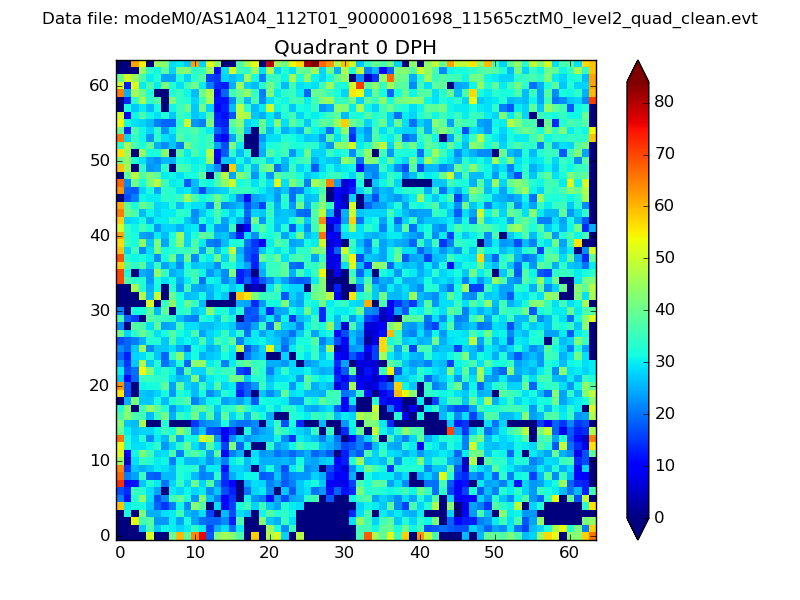 |
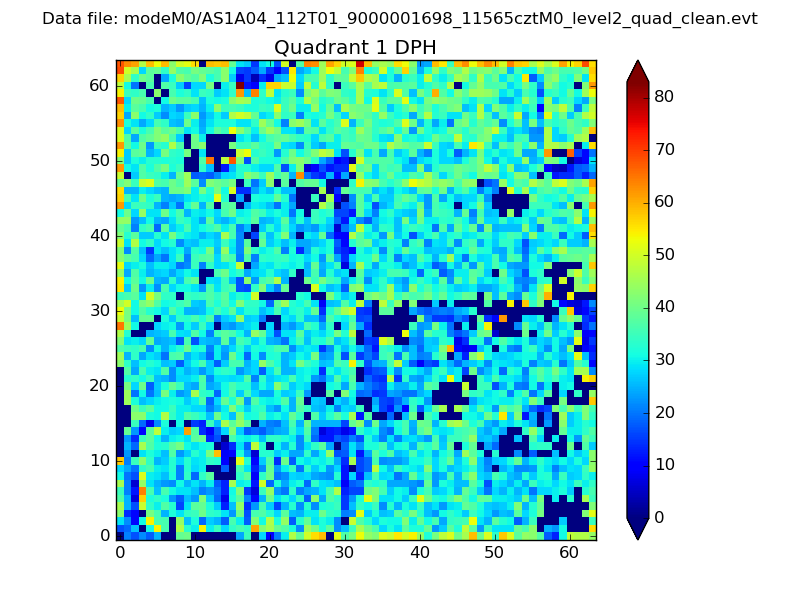 |
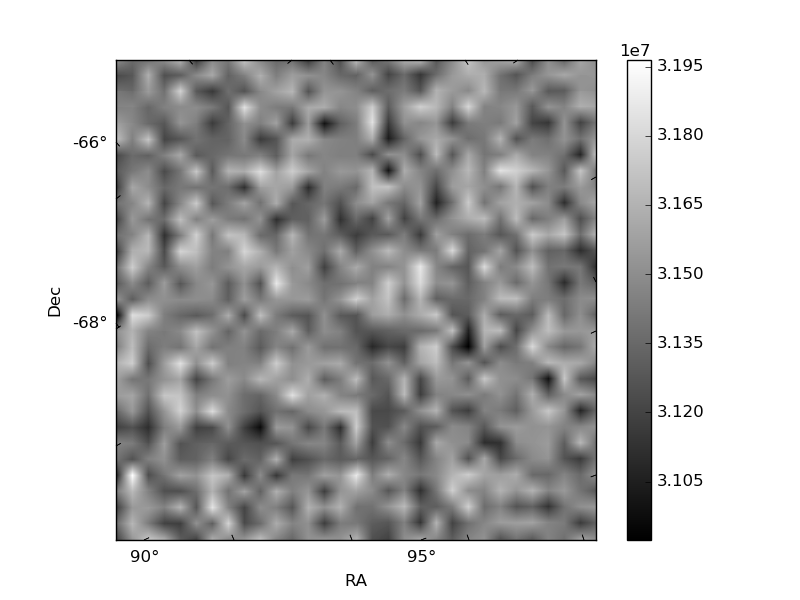
Quadrant B |
|---|---|---|---|
| Quadrant D | 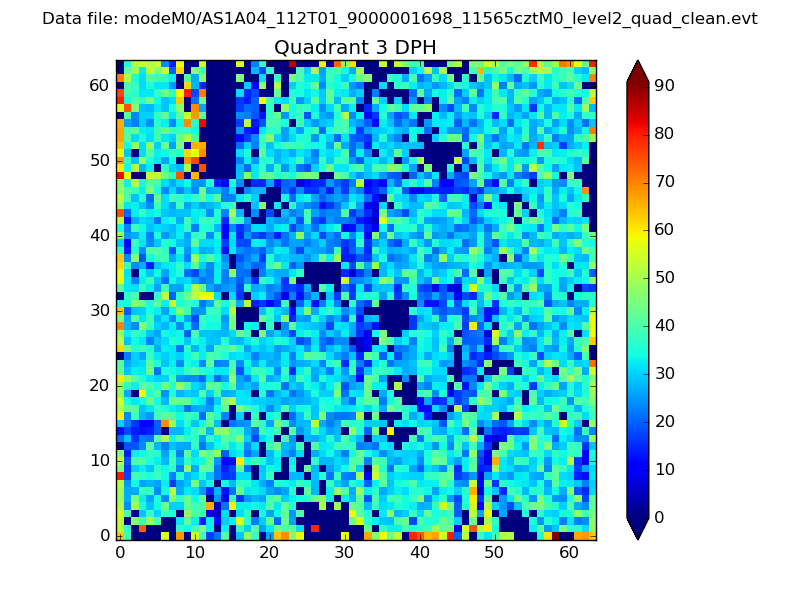 |
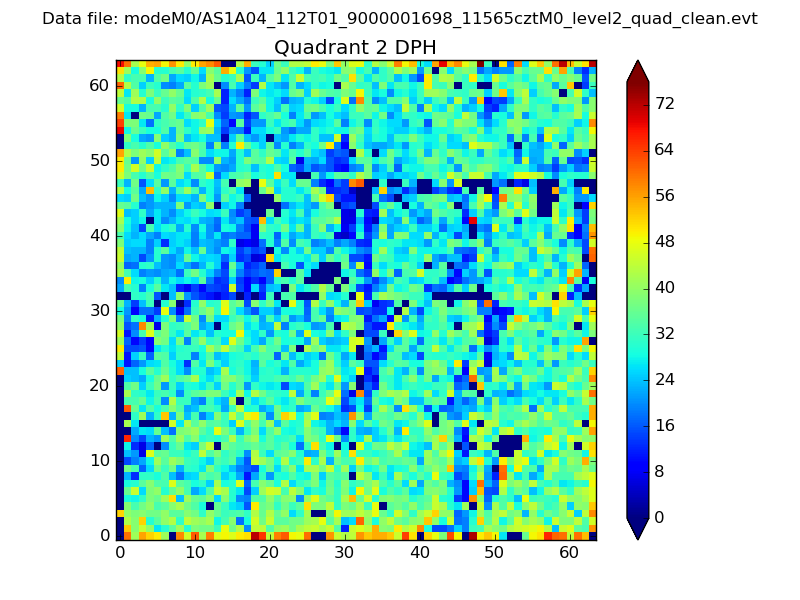 |
Quadrant C |
| Plot type | Count rate plots | Images |
|---|---|---|
| Comparison with Poisson distribution Blue bars denote a histogram of data divided into 1 sec bins. Red curve is a Poisson curve with rate = median count rate of data. |
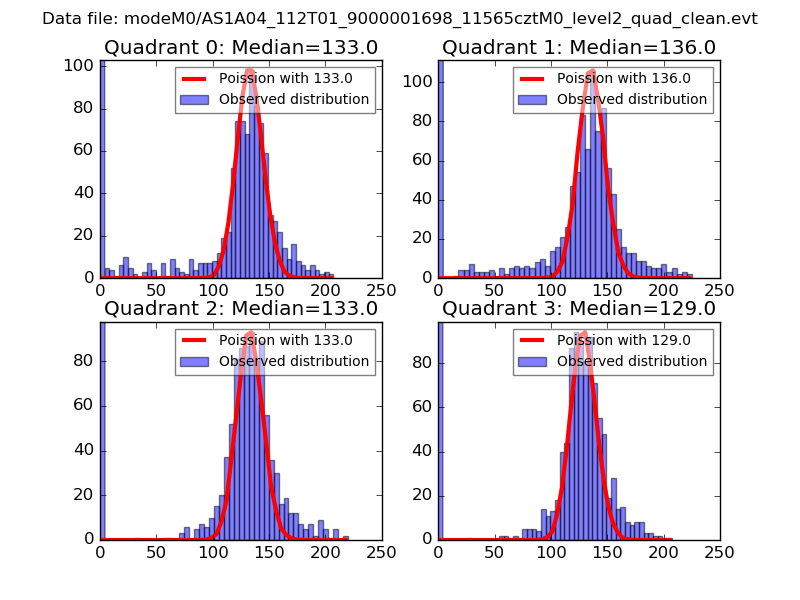 |
 |
| Quadrant-wise count rates Data is divided into 100 sec bins |
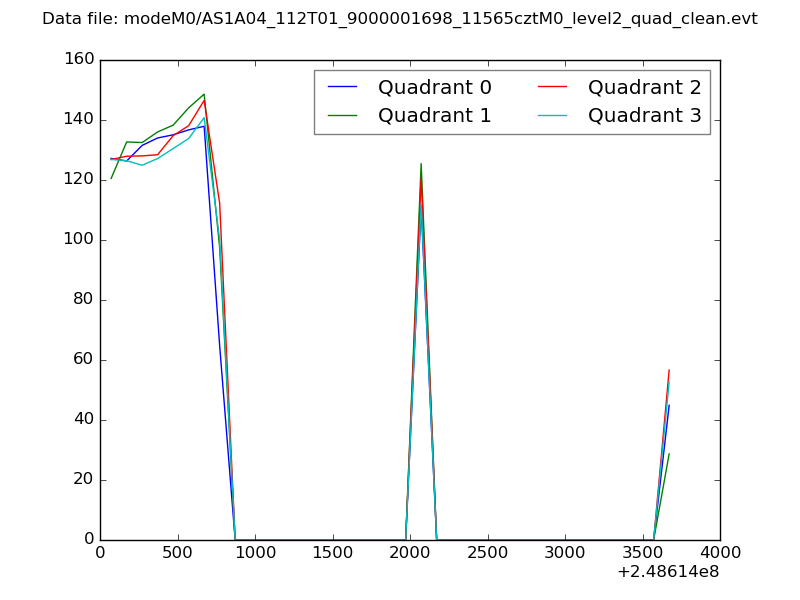 |
|
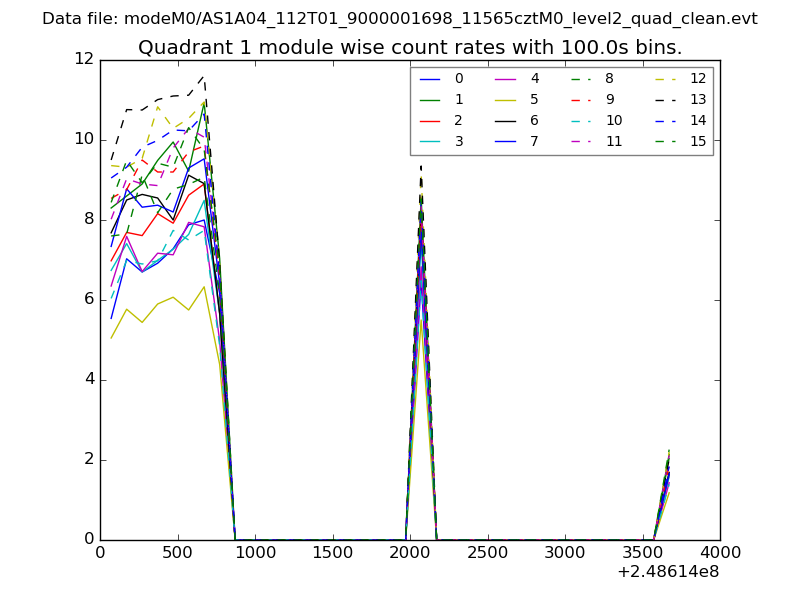
| Module-wise count rates for Quadrant A Data is divided into 100 sec bins |
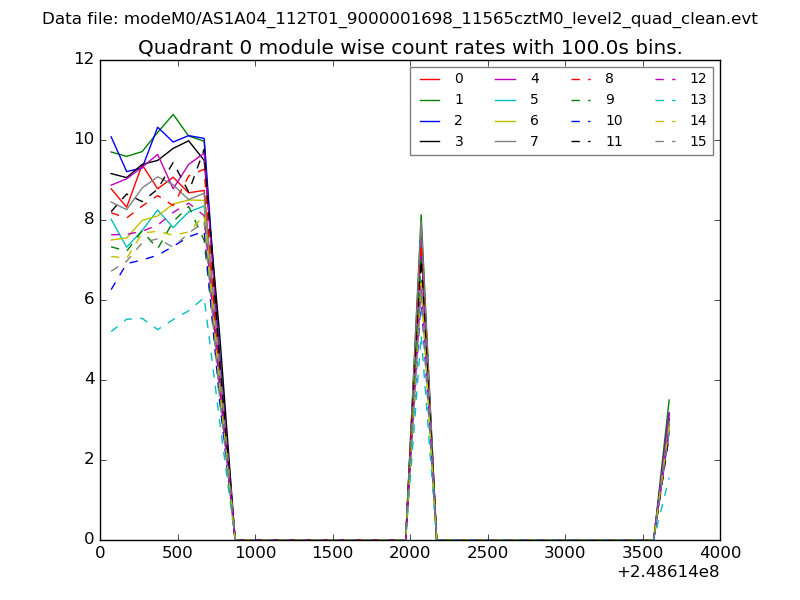 |
 |
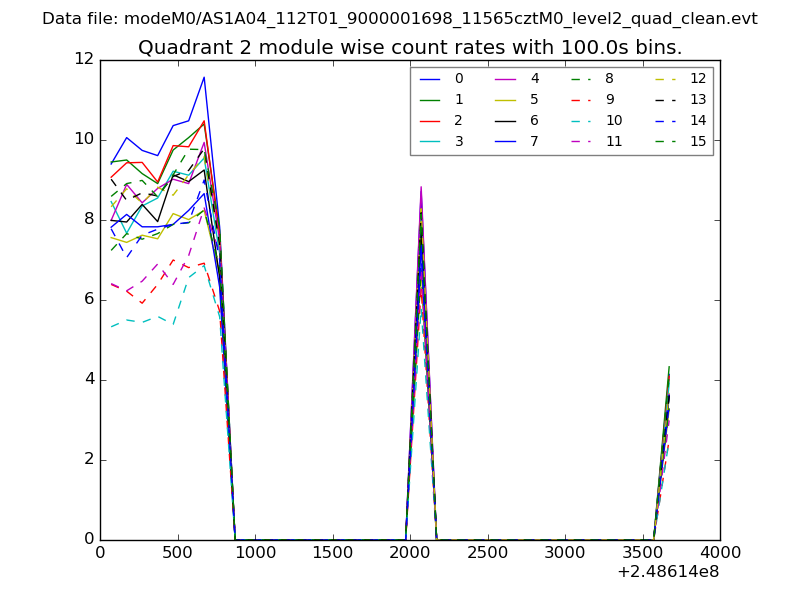
| Module-wise count rates for Quadrant B Data is divided into 100 sec bins |
 |
 |
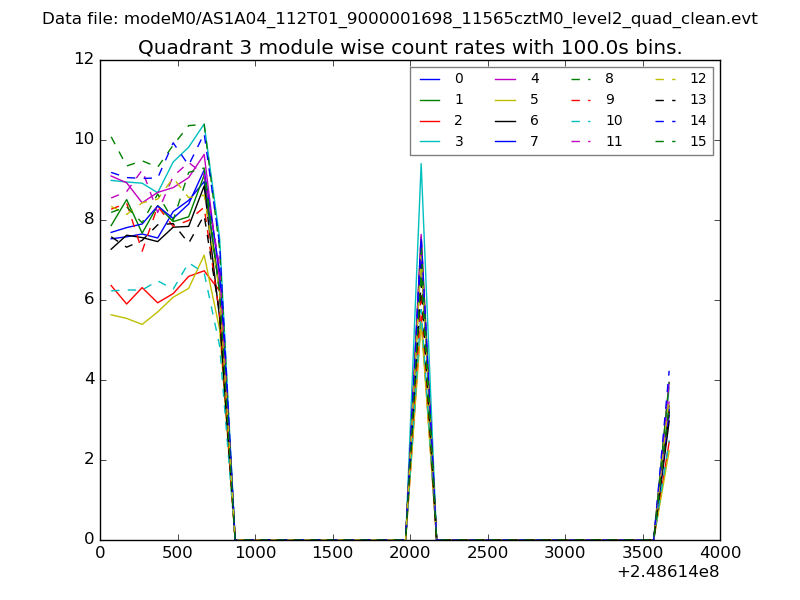
| Module-wise count rates for Quadrant C Data is divided into 100 sec bins |
 |
 |
| Module-wise count rates for Quadrant D Data is divided into 100 sec bins |
 |
 |
| Parameter | Plot |
|---|---|
| CZT HV Monitor | 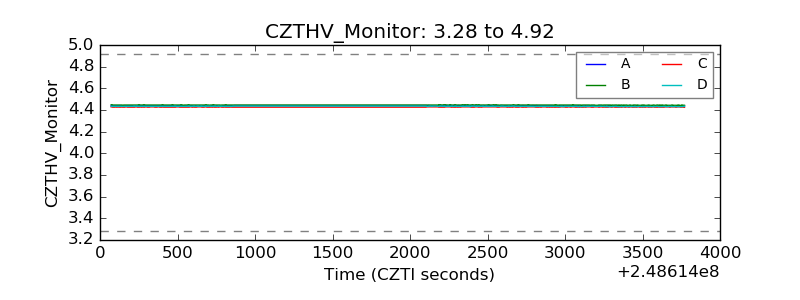 |
| D_VDD | 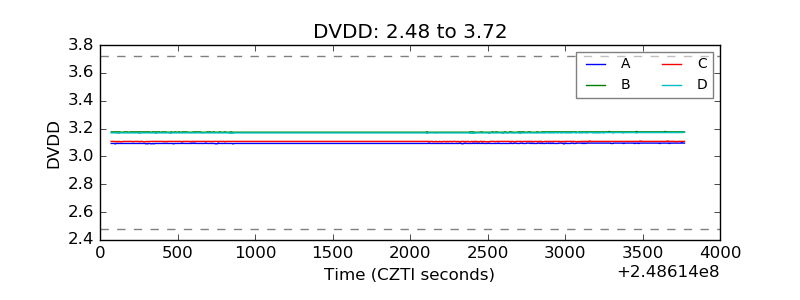 |
| Temperature 1 | 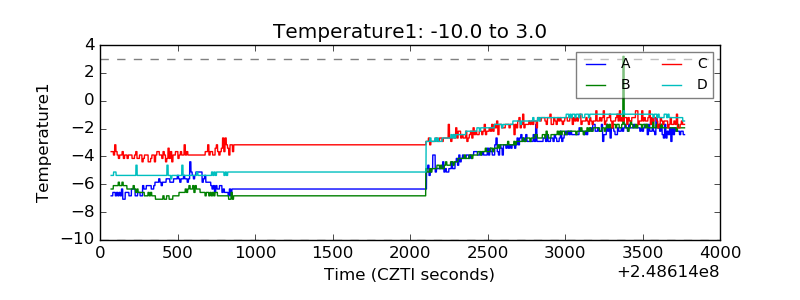 |
| Veto HV Monitor | 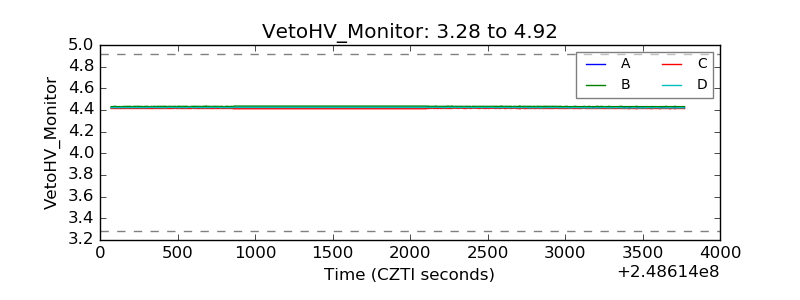 |
| Veto LLD | 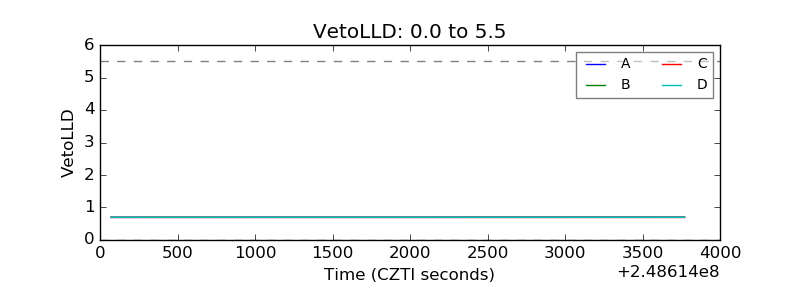 |
| Alpha Counter | 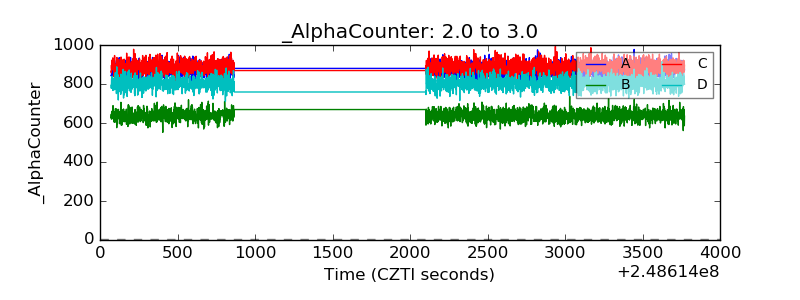 |
| _CPM_Rate | 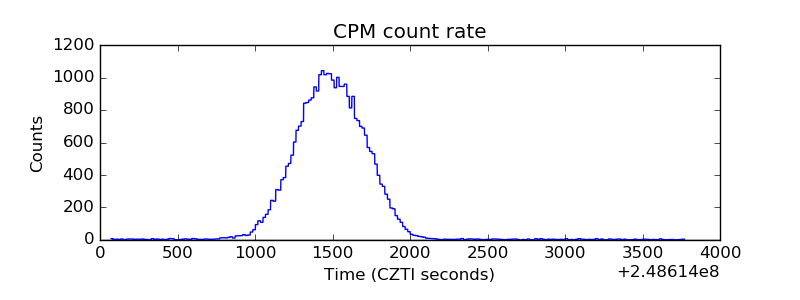 |
| CZT Counter | 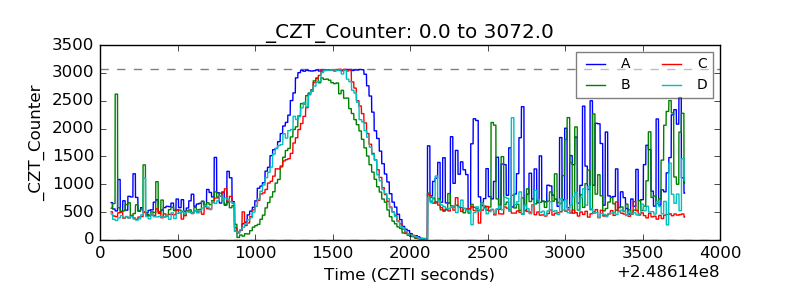 |
| +2.5 Volts monitor | 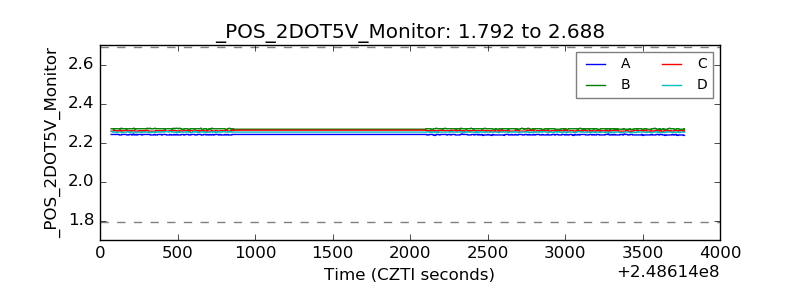 |
| +5 Volts monitor |  |
| _ROLL_ROT | 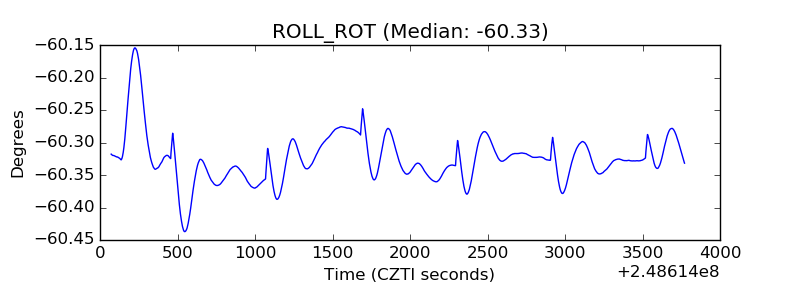 |
| _Roll_DEC | 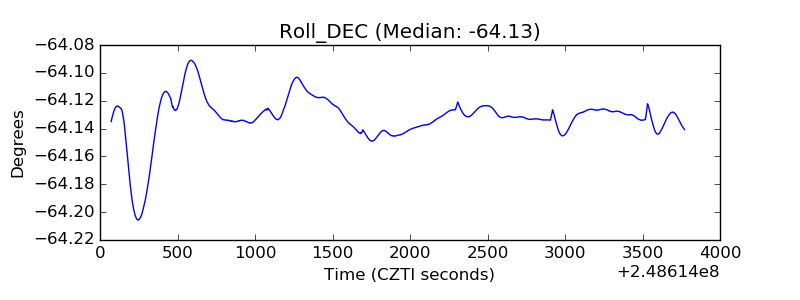 |
| _Roll_RA | 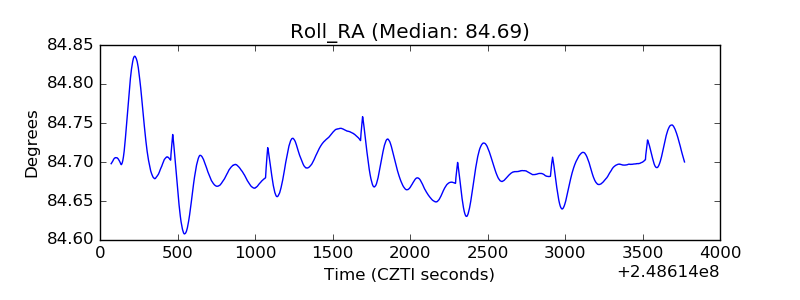 |
| Veto Counter | 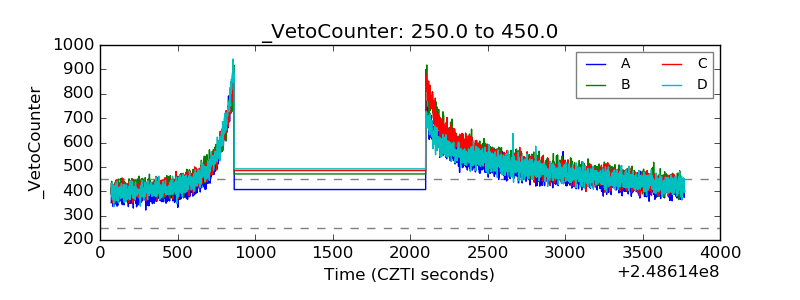 |