| Param | Original file | Final file |
|---|---|---|
| Filename | modeM0/AS1A04_112T01_9000001698_11566cztM0_level2.evt | modeM0/AS1A04_112T01_9000001698_11566cztM0_level2_quad_clean.evt |
| Size (bytes) | 658,788,480 | 79,876,800 |
| Size | 628.3 MB | 76.2 MB |
| Events in quadrant A | 7,359,132 | 468,370 |
| Events in quadrant B | 5,148,421 | 496,226 |
| Events in quadrant C | 3,171,580 | 500,696 |
| Events in quadrant D | 3,816,167 | 483,176 |
| Mode SS | |||
|---|---|---|---|
| Quadrant | BADHDUFLAG | Total packets | Discarded packets |
| A | 0 | 136 | 0 |
| B | 0 | 136 | 0 |
| C | 0 | 136 | 0 |
| D | 0 | 136 | 0 |
| Mode M0 | |||
|---|---|---|---|
| Quadrant | BADHDUFLAG | Total packets | Discarded packets |
| A | 0 | 26519 | 3 |
| B | 0 | 19765 | 2 |
| C | 0 | 13947 | 2 |
| D | 0 | 15981 | 2 |
| Mode M9 | |||
|---|---|---|---|
| Quadrant | BADHDUFLAG | Total packets | Discarded packets |
| A | 0 | 11 | 0 |
| B | 0 | 11 | 0 |
| C | 0 | 11 | 0 |
| D | 0 | 11 | 0 |
| Quadrant | Total seconds | Saturated seconds | Saturation percentage |
|---|---|---|---|
| A | 6740 | 1398 | 20.741840% |
| B | 6740 | 620 | 9.198813% |
| C | 6740 | 112 | 1.661721% |
| D | 6740 | 181 | 2.685460% |
Noise dominated data is calculated using 1-second bins in cleaned event files. If a bin has >2000 counts, and if more than 50% of those come from <1% of pixels, then it is considered to be noise-dominated and hence unusable.
| Quadrant | # 1 sec bins | Bins with >0 counts | Bins with >2000 counts | High rate bins dominated by noise | Noise dominated (total time) | Noise dominated (detector-on time) | Marked lightcurve |
|---|---|---|---|---|---|---|---|
| A | 7876 | 6742 | 868 | 868 | 11.02% | 12.87% | 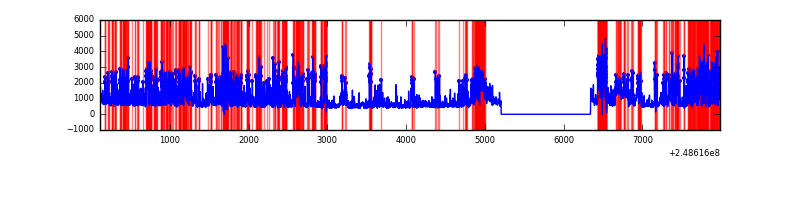 |
| B | 7876 | 6742 | 324 | 324 | 4.11% | 4.81% |  |
| C | 7876 | 6742 | 0 | 0 | 0.00% | 0.00% |  |
| D | 7876 | 6742 | 82 | 82 | 1.04% | 1.22% | 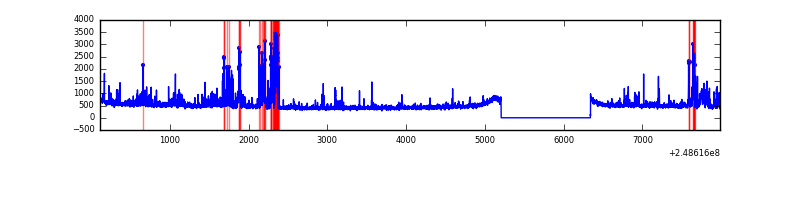 |
Top three noisy pixels from each quadrant. If the there are fewer than three noisy pixels in the level2.evt file, extra rows are filled as -1
| Pixel properties | Quadrant properties | ||||||
|---|---|---|---|---|---|---|---|
| Quadrant | DetID | PixID | Counts | Sigma | Mean | Median | Sigma |
| A | 8 | 5 | 3932593 | 25695.55 | 766 | 749 | 153.0 |
| A | 15 | 174 | 173774 | 1130.76 | 766 | 749 | 153.0 |
| A | 1 | 162 | 90898 | 589.15 | 766 | 749 | 153.0 |
| B | 4 | 239 | 1430641 | 9452.24 | 812 | 793 | 151.3 |
| B | 15 | 204 | 245631 | 1618.54 | 812 | 793 | 151.3 |
| B | 11 | 51 | 102288 | 670.95 | 812 | 793 | 151.3 |
| C | 0 | 10 | 32752 | 174.34 | 805 | 807 | 183.2 |
| C | 13 | 61 | 5972 | 28.19 | 805 | 807 | 183.2 |
| C | 3 | 202 | 2050 | 6.78 | 805 | 807 | 183.2 |
| D | 1 | 52 | 372647 | 1942.36 | 806 | 781 | 191.5 |
| D | 2 | 120 | 131937 | 685.07 | 806 | 781 | 191.5 |
| D | 13 | 137 | 104809 | 543.37 | 806 | 781 | 191.5 |
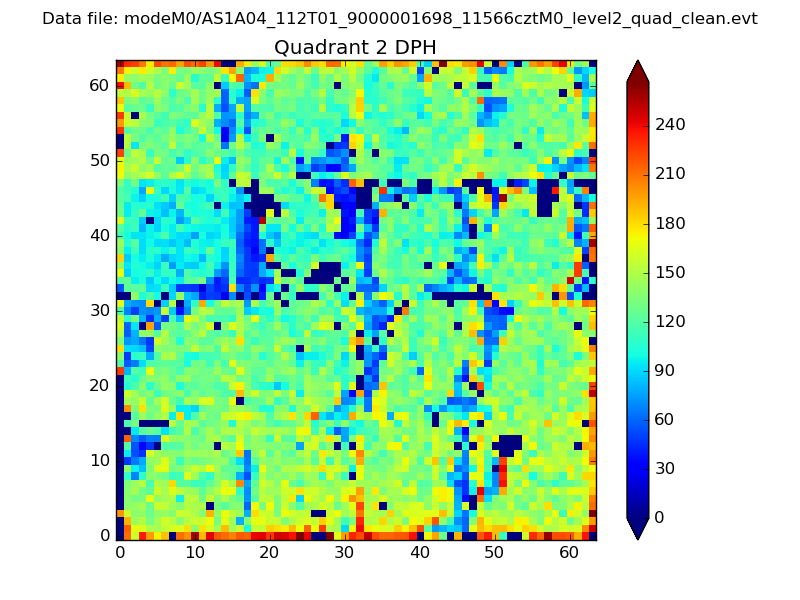
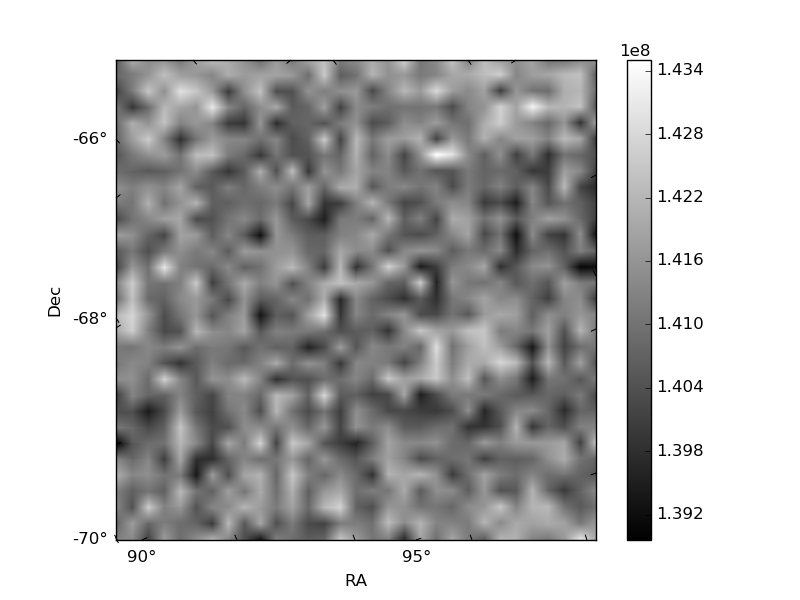
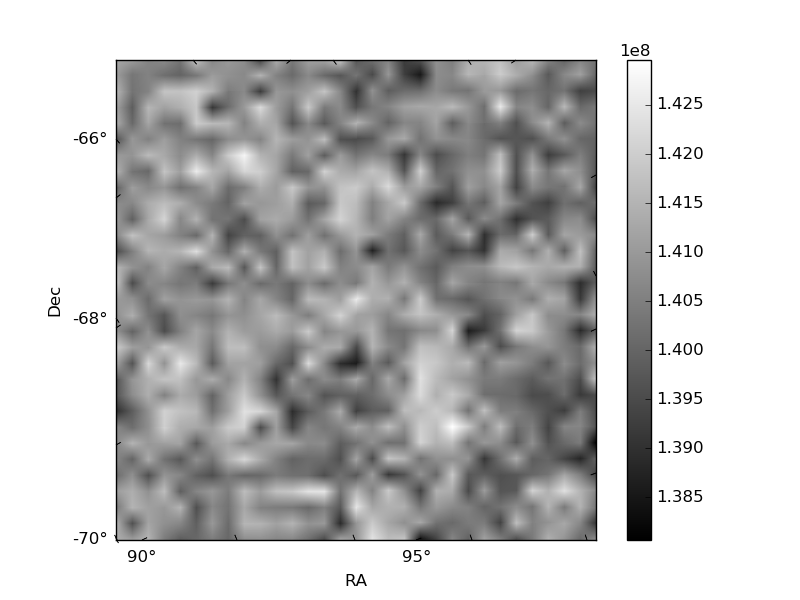
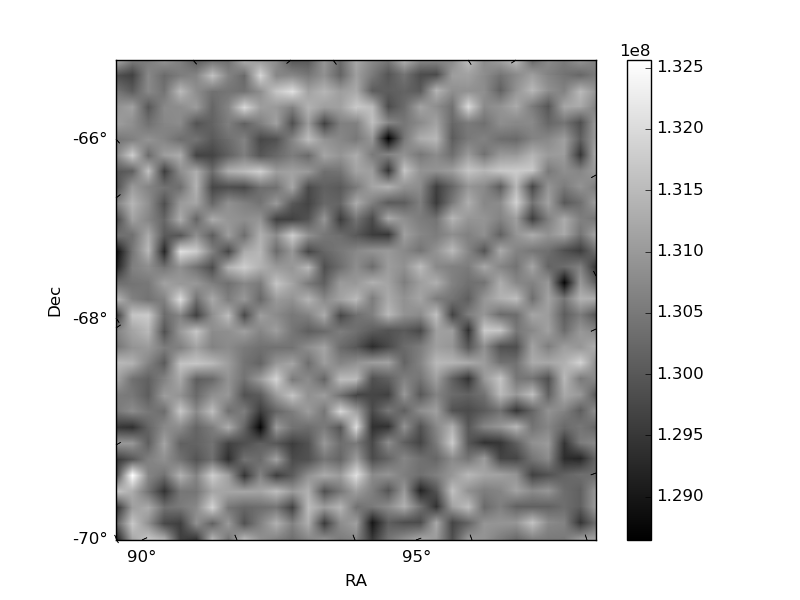
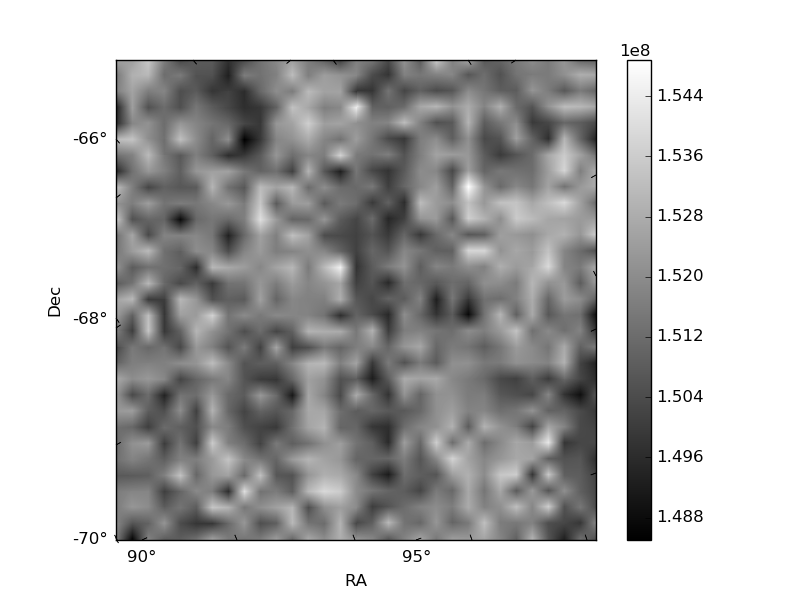
Histogram calculated using DETX and DETY for each event in the final _common_clean file
| Quadrant A | 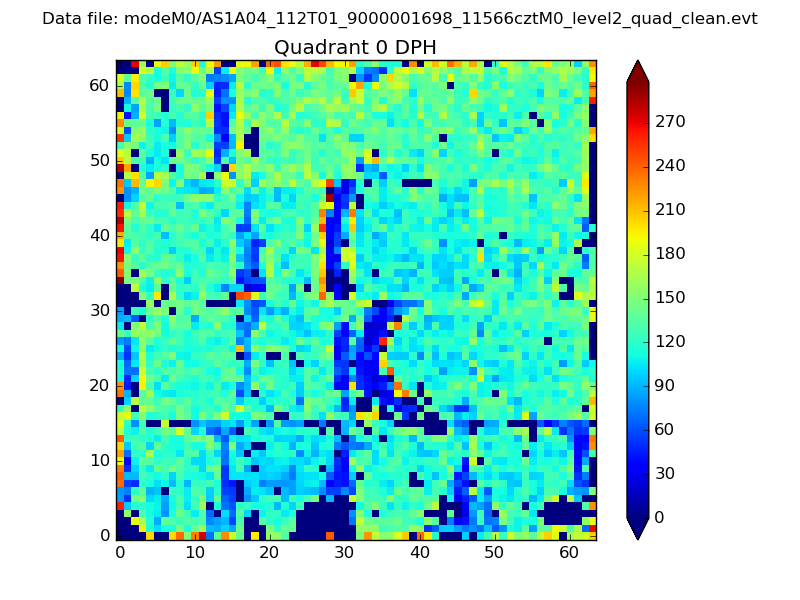 |
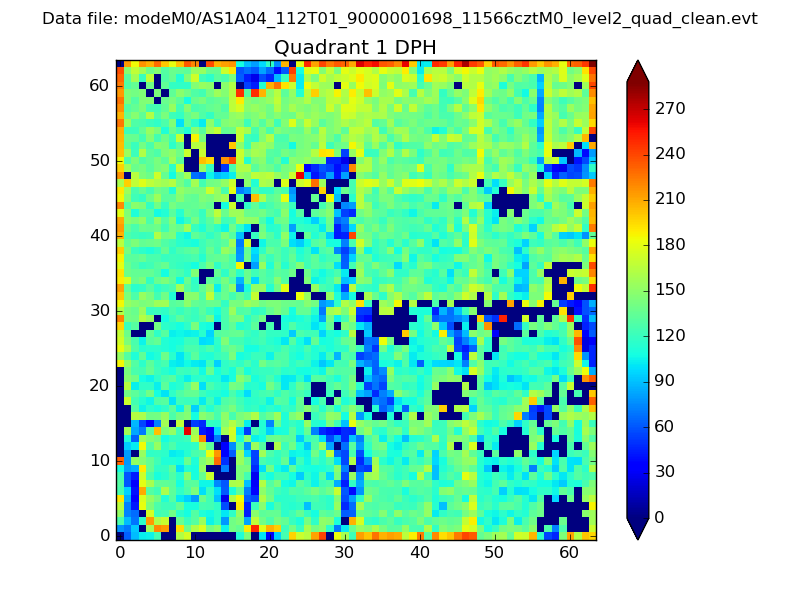 |
Quadrant B |
|---|---|---|---|
| Quadrant D | 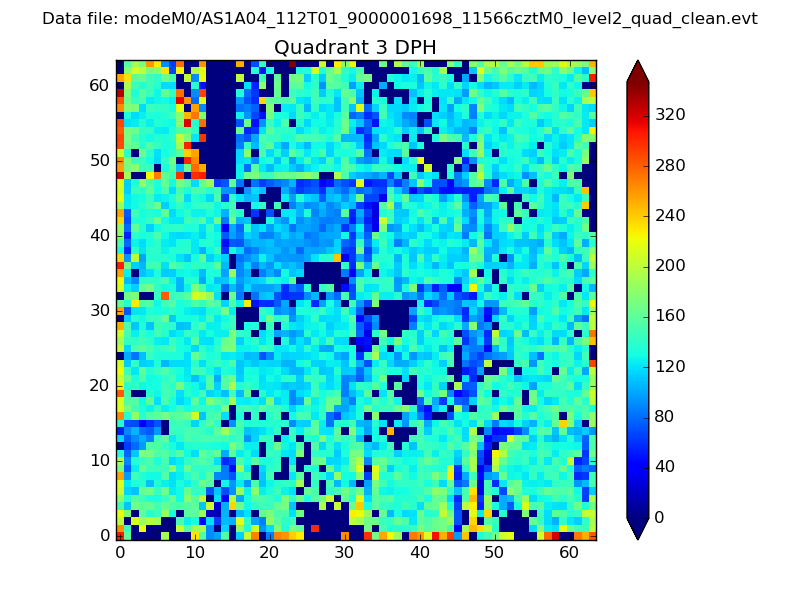 |
 |
Quadrant C |
| Plot type | Count rate plots | Images |
|---|---|---|
| Comparison with Poisson distribution Blue bars denote a histogram of data divided into 1 sec bins. Red curve is a Poisson curve with rate = median count rate of data. |
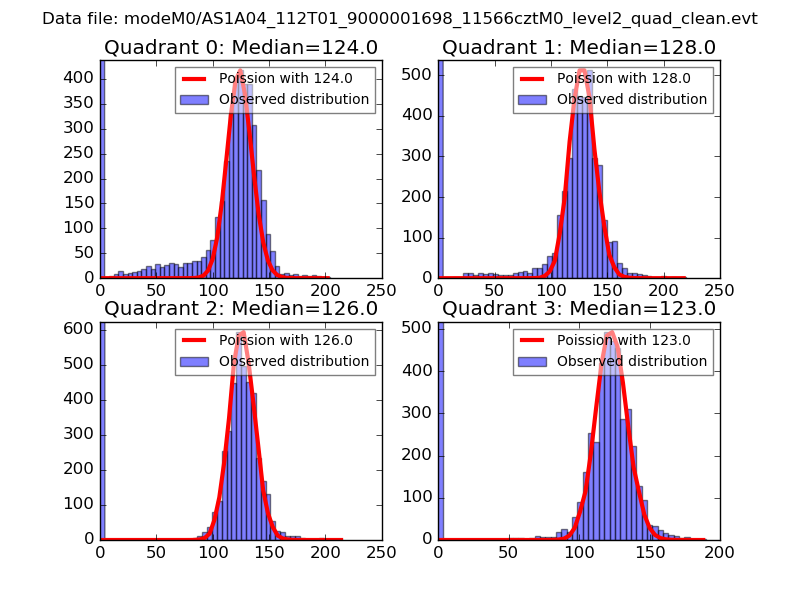 |
 |
| Quadrant-wise count rates Data is divided into 100 sec bins |
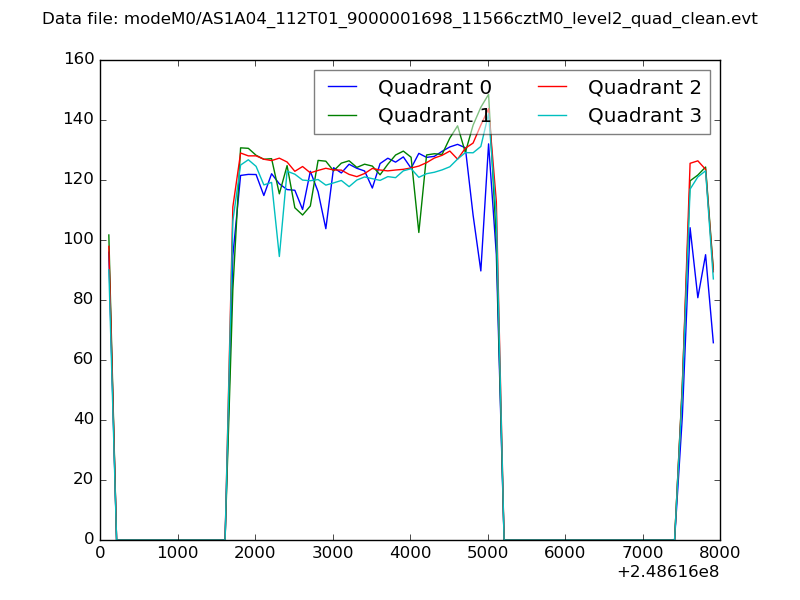 |
|
| Module-wise count rates for Quadrant A Data is divided into 100 sec bins |
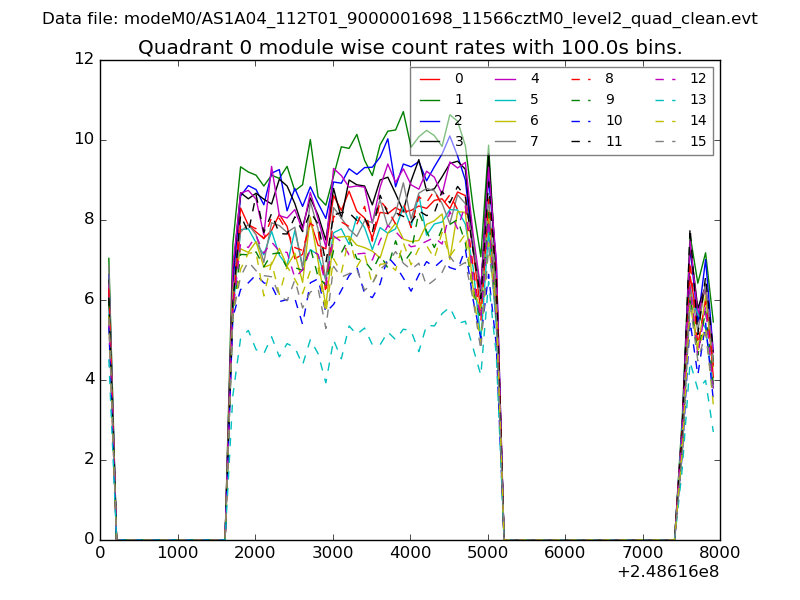 |
 |
| Module-wise count rates for Quadrant B Data is divided into 100 sec bins |
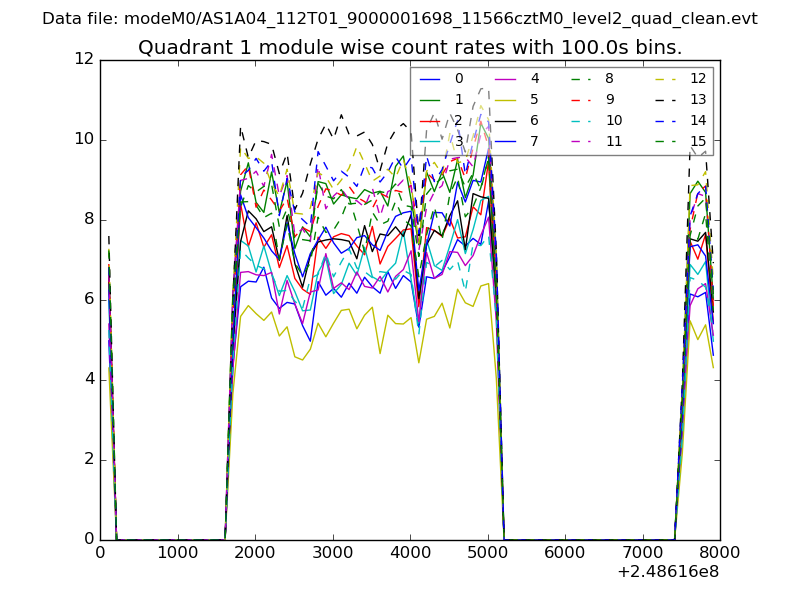 |
 |
| Module-wise count rates for Quadrant C Data is divided into 100 sec bins |
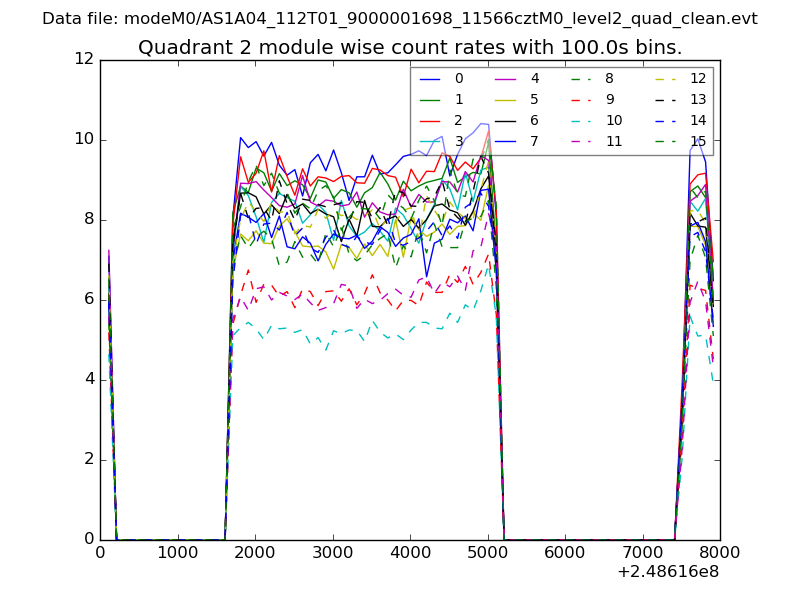 |
 |
| Module-wise count rates for Quadrant D Data is divided into 100 sec bins |
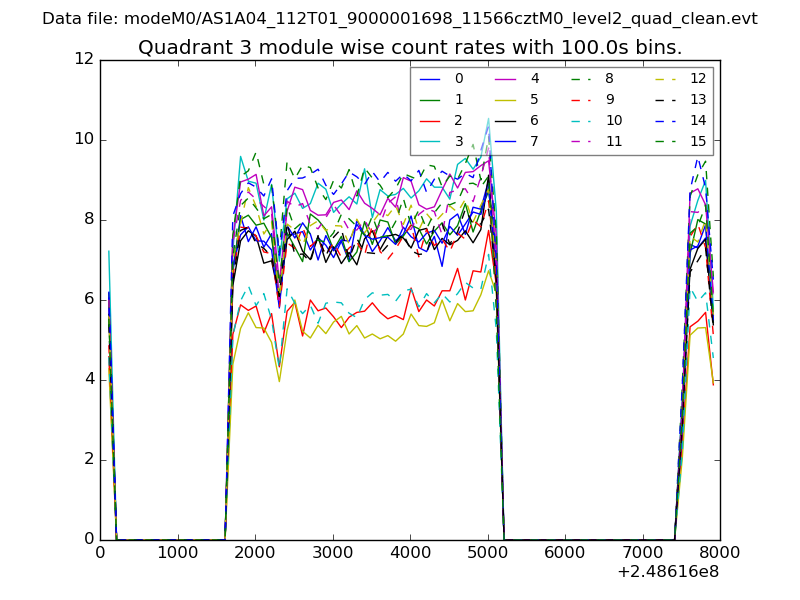 |
 |
| Parameter | Plot |
|---|---|
| CZT HV Monitor | 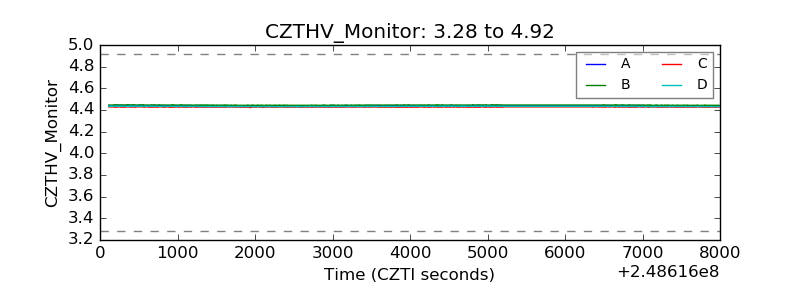 |
| D_VDD | 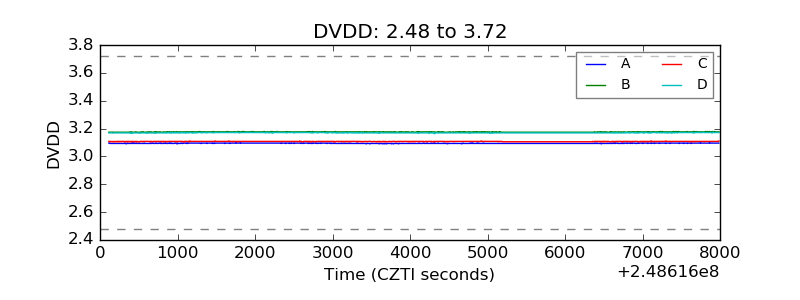 |
| Temperature 1 | 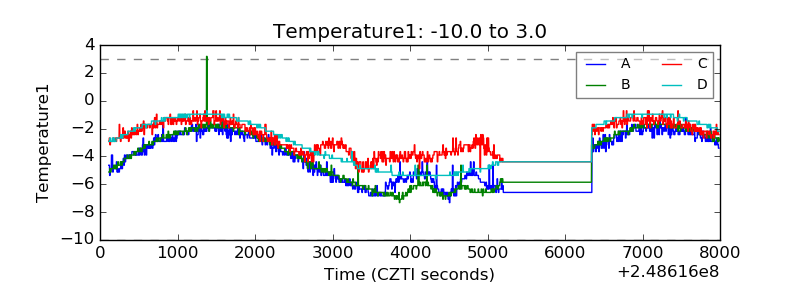 |
| Veto HV Monitor | 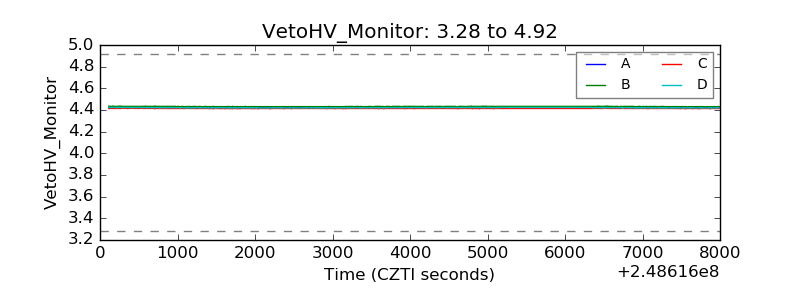 |
| Veto LLD | 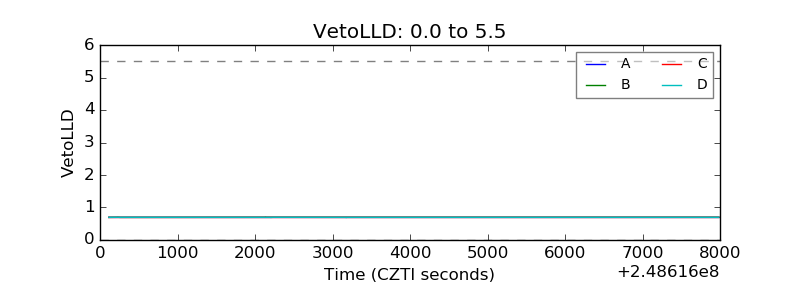 |
| Alpha Counter | 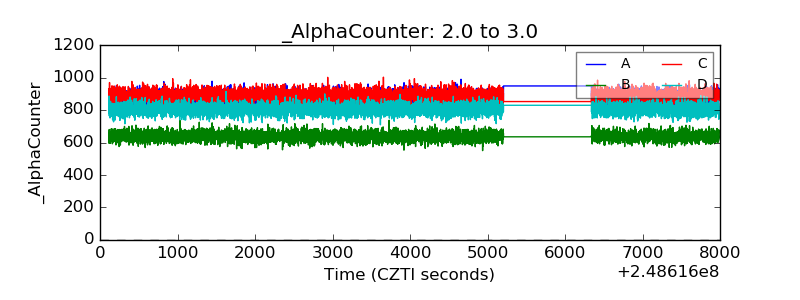 |
| _CPM_Rate | 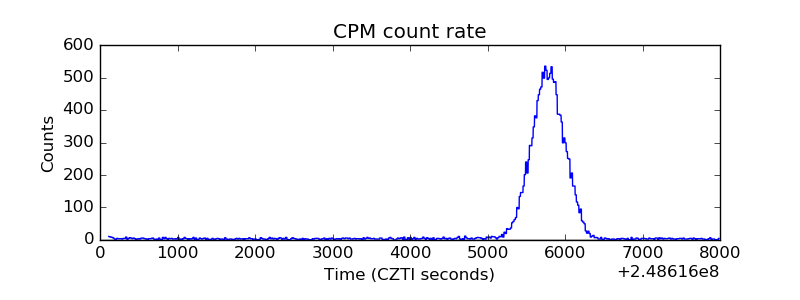 |
| CZT Counter | 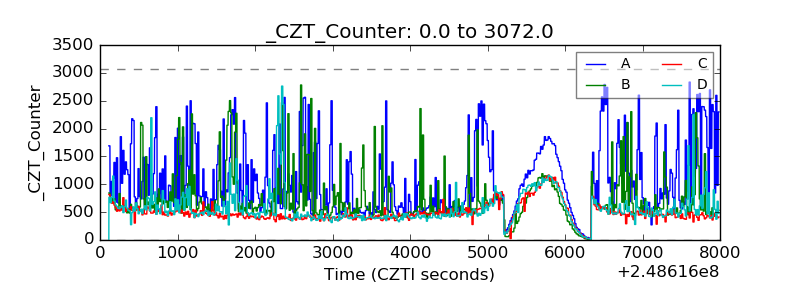 |
| +2.5 Volts monitor |  |
| +5 Volts monitor |  |
| _ROLL_ROT | 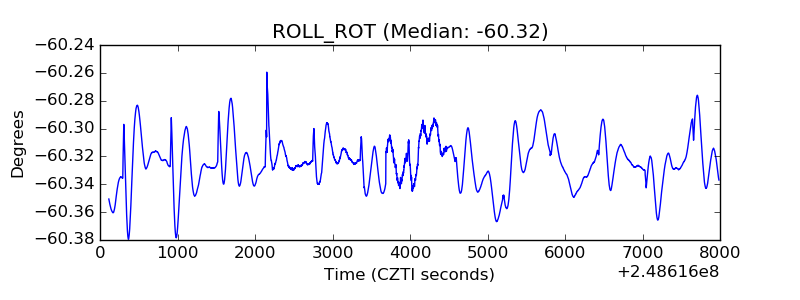 |
| _Roll_DEC | 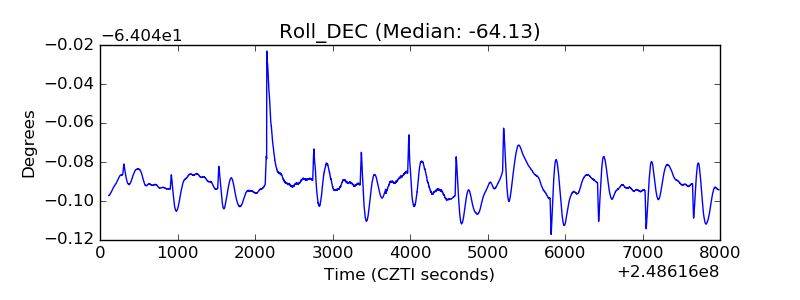 |
| _Roll_RA | 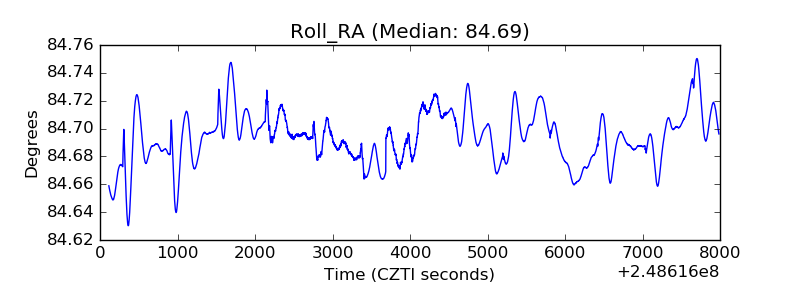 |
| Veto Counter | 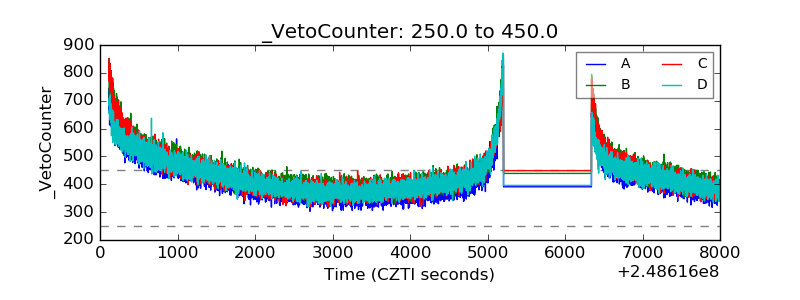 |