| Param | Original file | Final file |
|---|---|---|
| Filename | modeM0/AS1A04_112T01_9000001698_11567cztM0_level2.evt | modeM0/AS1A04_112T01_9000001698_11567cztM0_level2_quad_clean.evt |
| Size (bytes) | 638,740,800 | 93,432,960 |
| Size | 609.2 MB | 89.1 MB |
| Events in quadrant A | 7,081,646 | 562,858 |
| Events in quadrant B | 4,622,725 | 612,438 |
| Events in quadrant C | 2,914,165 | 609,492 |
| Events in quadrant D | 4,278,782 | 583,696 |
| Mode SS | |||
|---|---|---|---|
| Quadrant | BADHDUFLAG | Total packets | Discarded packets |
| A | 0 | 134 | 0 |
| B | 0 | 134 | 0 |
| C | 0 | 134 | 0 |
| D | 0 | 134 | 0 |
| Mode M0 | |||
|---|---|---|---|
| Quadrant | BADHDUFLAG | Total packets | Discarded packets |
| A | 0 | 25674 | 2 |
| B | 0 | 17974 | 1 |
| C | 0 | 13454 | 1 |
| D | 0 | 17247 | 1 |
| Mode M9 | |||
|---|---|---|---|
| Quadrant | BADHDUFLAG | Total packets | Discarded packets |
| A | 0 | 9 | 0 |
| B | 0 | 9 | 0 |
| C | 0 | 9 | 0 |
| D | 0 | 9 | 0 |
| Quadrant | Total seconds | Saturated seconds | Saturation percentage |
|---|---|---|---|
| A | 6604 | 1095 | 16.580860% |
| B | 6604 | 451 | 6.829194% |
| C | 6604 | 56 | 0.847971% |
| D | 6604 | 317 | 4.800121% |
Noise dominated data is calculated using 1-second bins in cleaned event files. If a bin has >2000 counts, and if more than 50% of those come from <1% of pixels, then it is considered to be noise-dominated and hence unusable.
| Quadrant | # 1 sec bins | Bins with >0 counts | Bins with >2000 counts | High rate bins dominated by noise | Noise dominated (total time) | Noise dominated (detector-on time) | Marked lightcurve |
|---|---|---|---|---|---|---|---|
| A | 7505 | 6606 | 640 | 640 | 8.53% | 9.69% | 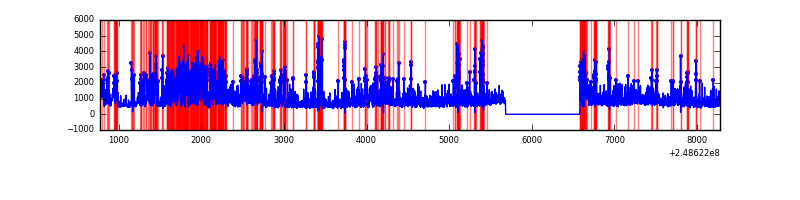 |
| B | 7505 | 6606 | 234 | 234 | 3.12% | 3.54% | 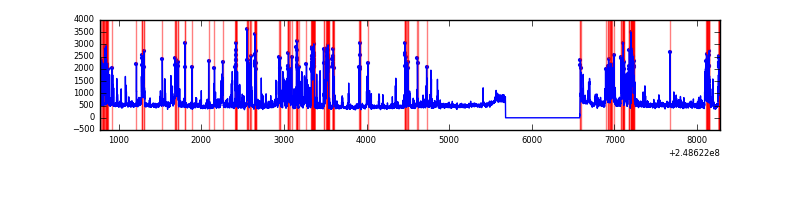 |
| C | 7505 | 6606 | 0 | 0 | 0.00% | 0.00% | 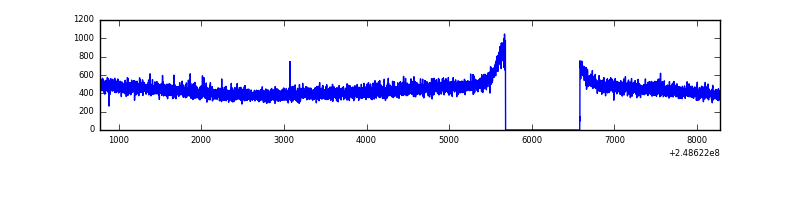 |
| D | 7505 | 6606 | 166 | 166 | 2.21% | 2.51% | 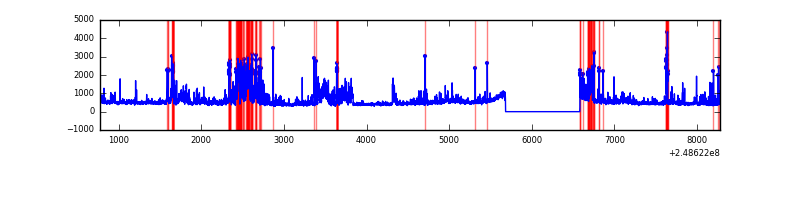 |
Top three noisy pixels from each quadrant. If the there are fewer than three noisy pixels in the level2.evt file, extra rows are filled as -1
| Pixel properties | Quadrant properties | ||||||
|---|---|---|---|---|---|---|---|
| Quadrant | DetID | PixID | Counts | Sigma | Mean | Median | Sigma |
| A | 8 | 5 | 3782690 | 25871.53 | 721 | 705 | 146.2 |
| A | 1 | 162 | 144893 | 986.35 | 721 | 705 | 146.2 |
| A | 15 | 174 | 102581 | 696.91 | 721 | 705 | 146.2 |
| B | 4 | 239 | 1162444 | 8004.32 | 764 | 745 | 145.1 |
| B | 15 | 255 | 170847 | 1172.03 | 764 | 745 | 145.1 |
| B | 15 | 204 | 144054 | 987.42 | 764 | 745 | 145.1 |
| C | 13 | 61 | 5620 | 28.5 | 747 | 750 | 170.9 |
| C | 3 | 202 | 1929 | 6.9 | 747 | 750 | 170.9 |
| C | 7 | 247 | 1711 | 5.62 | 747 | 750 | 170.9 |
| D | 13 | 137 | 1073745 | 6051.54 | 739 | 717 | 177.3 |
| D | 2 | 120 | 171739 | 964.51 | 739 | 717 | 177.3 |
| D | 10 | 253 | 74905 | 418.4 | 739 | 717 | 177.3 |
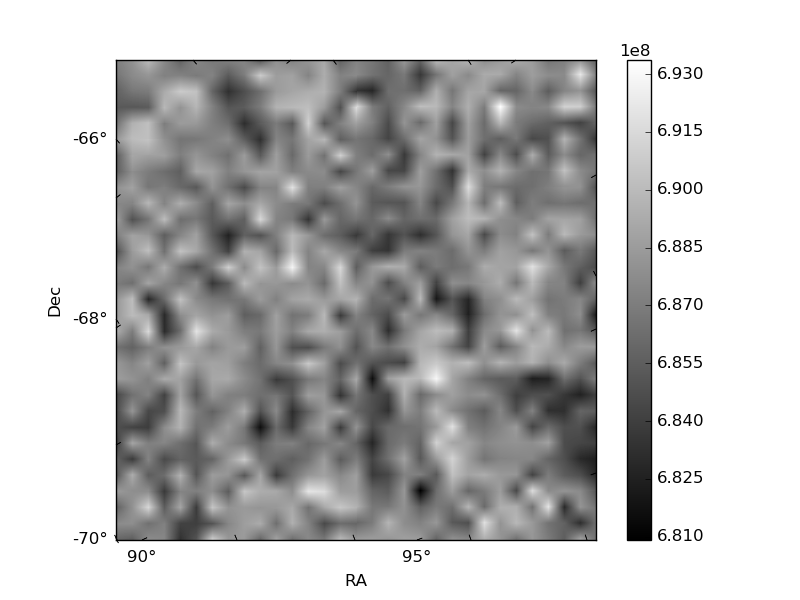
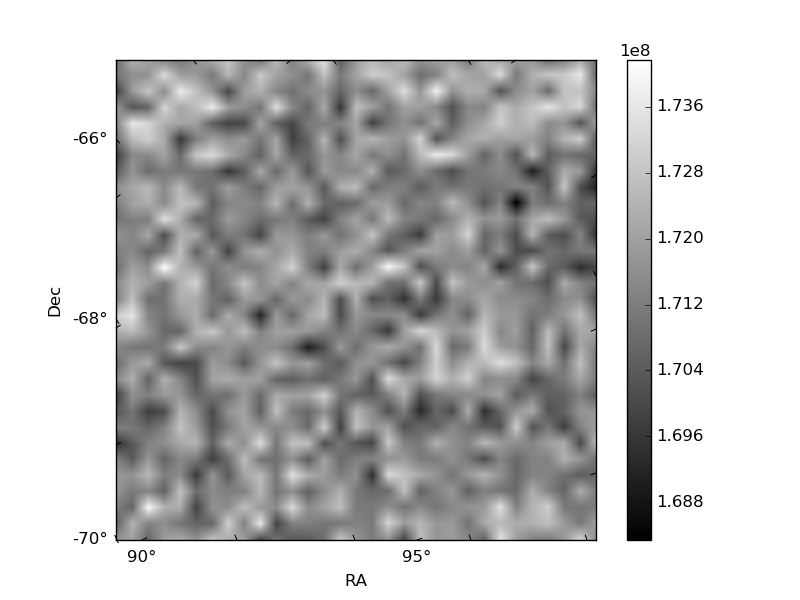
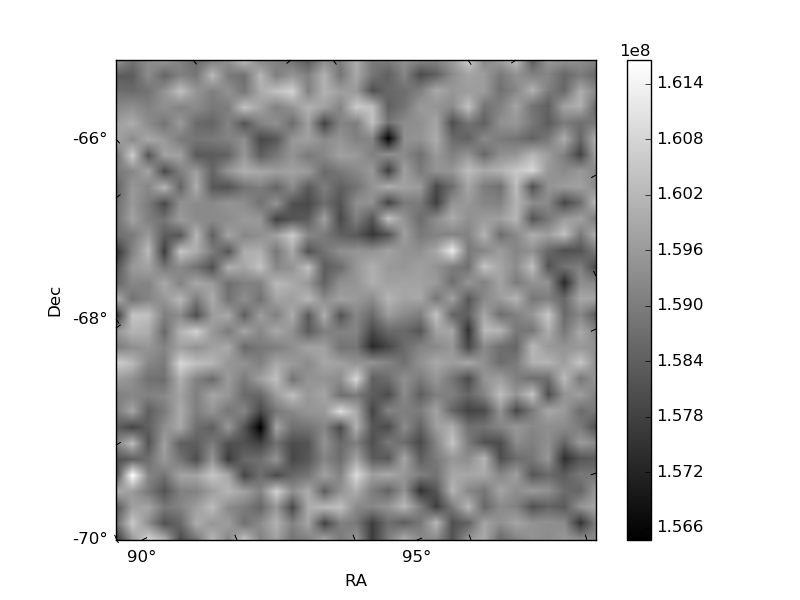
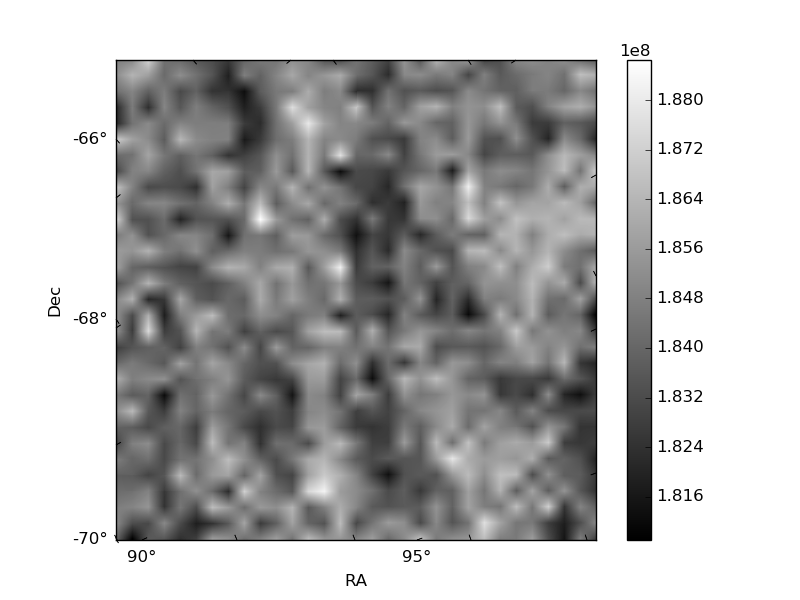
Histogram calculated using DETX and DETY for each event in the final _common_clean file
| Quadrant A | 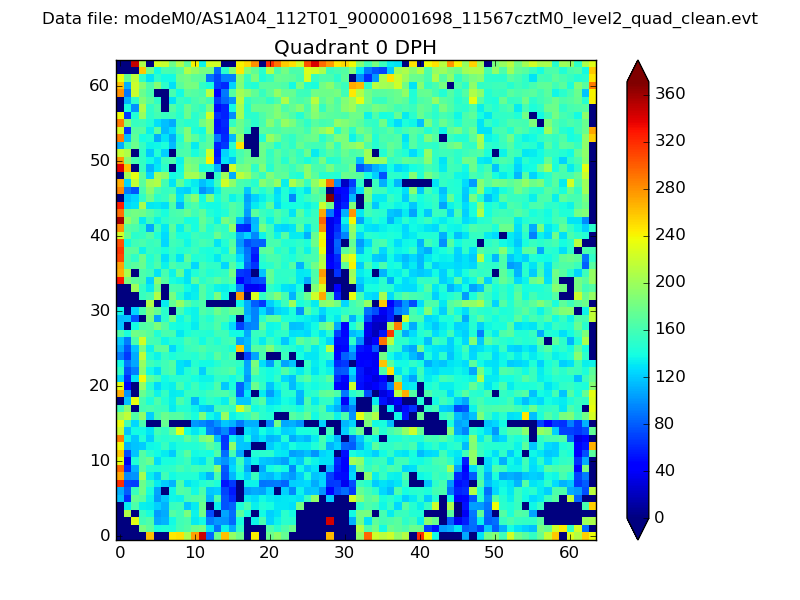 |
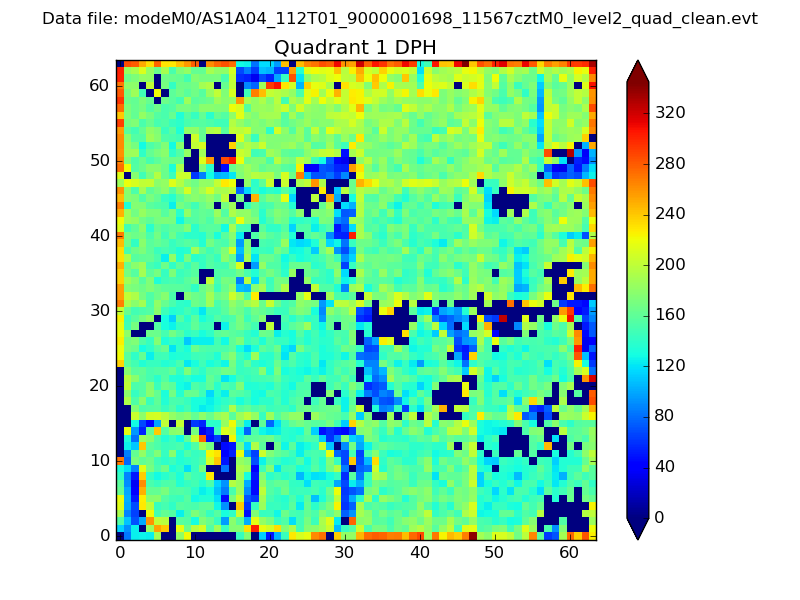 |
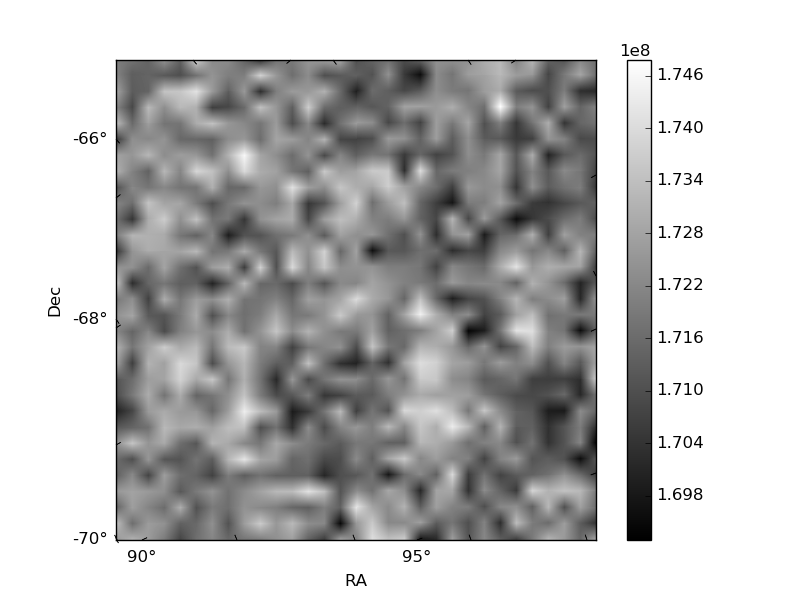
Quadrant B |
|---|---|---|---|
| Quadrant D | 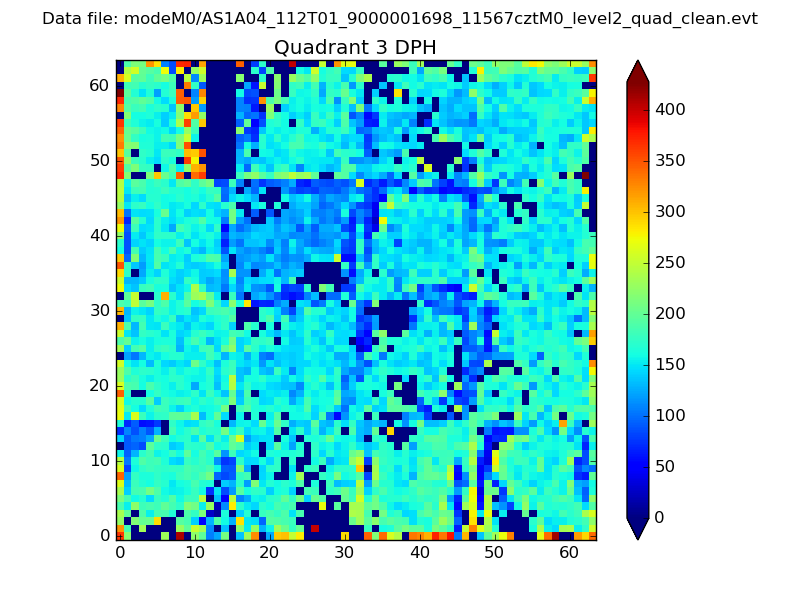 |
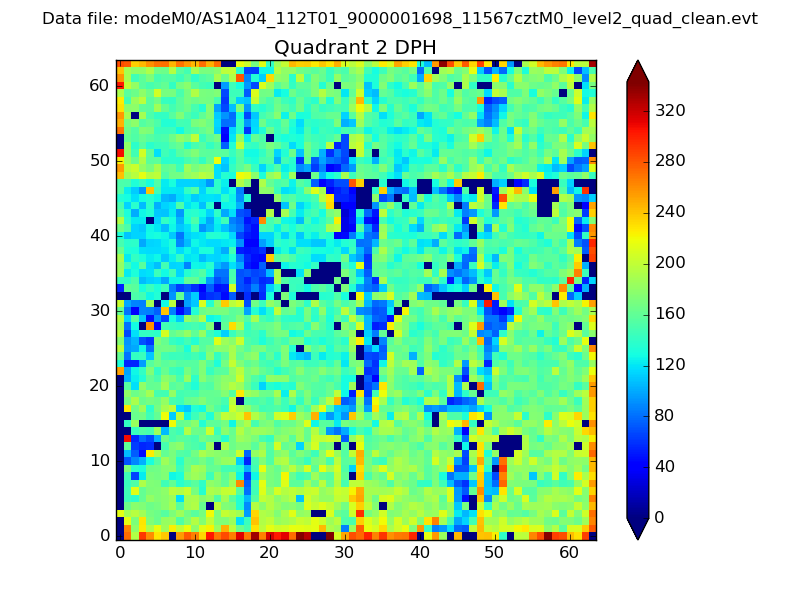 |
Quadrant C |
| Plot type | Count rate plots | Images |
|---|---|---|
| Comparison with Poisson distribution Blue bars denote a histogram of data divided into 1 sec bins. Red curve is a Poisson curve with rate = median count rate of data. |
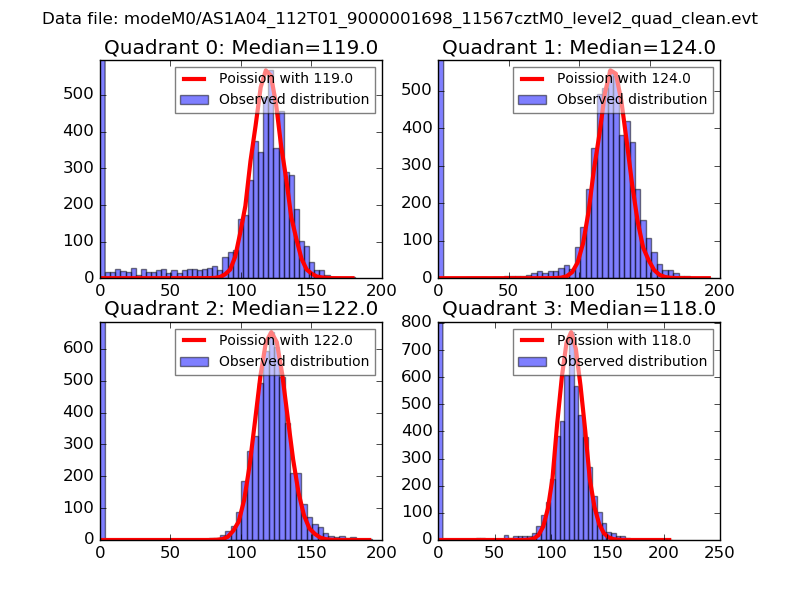 |
 |
| Quadrant-wise count rates Data is divided into 100 sec bins |
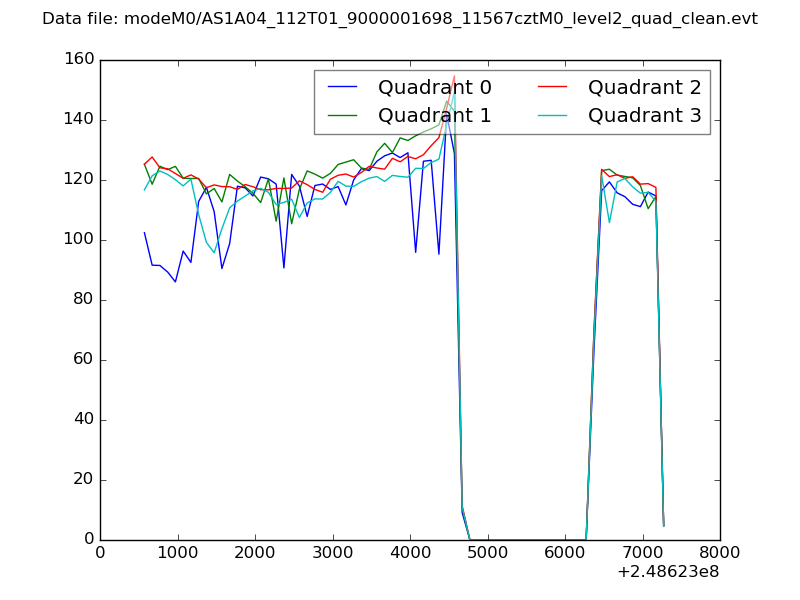 |
|
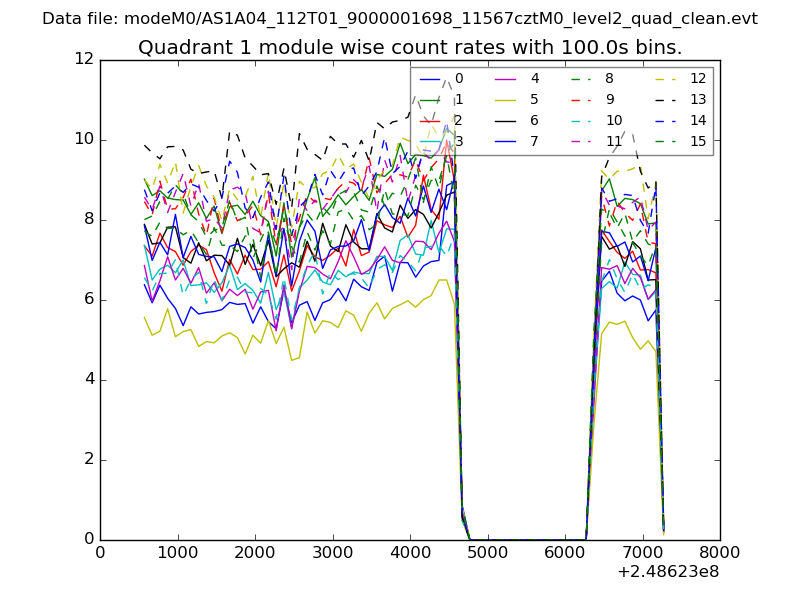
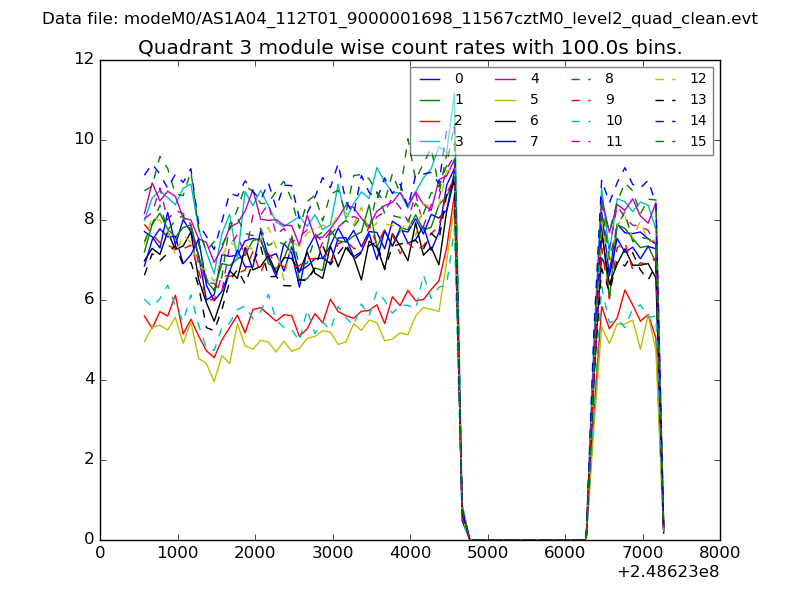
| Module-wise count rates for Quadrant A Data is divided into 100 sec bins |
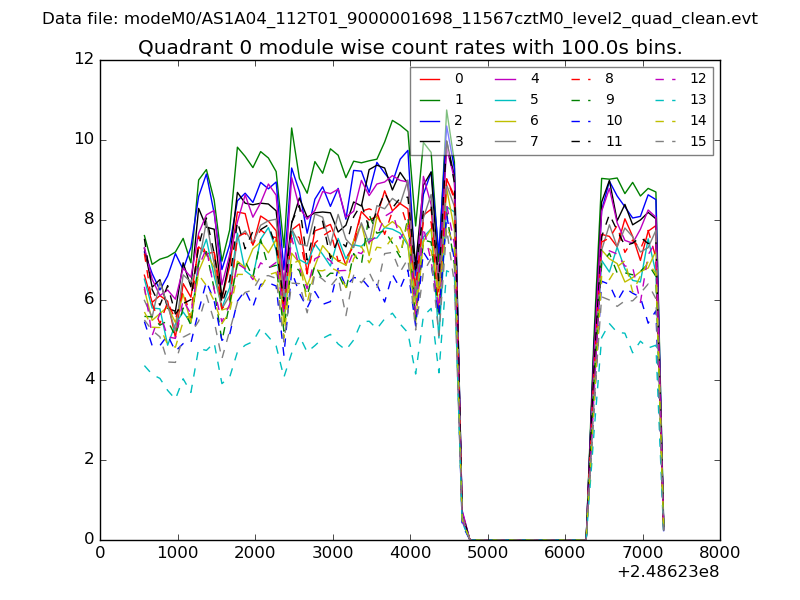 |
 |
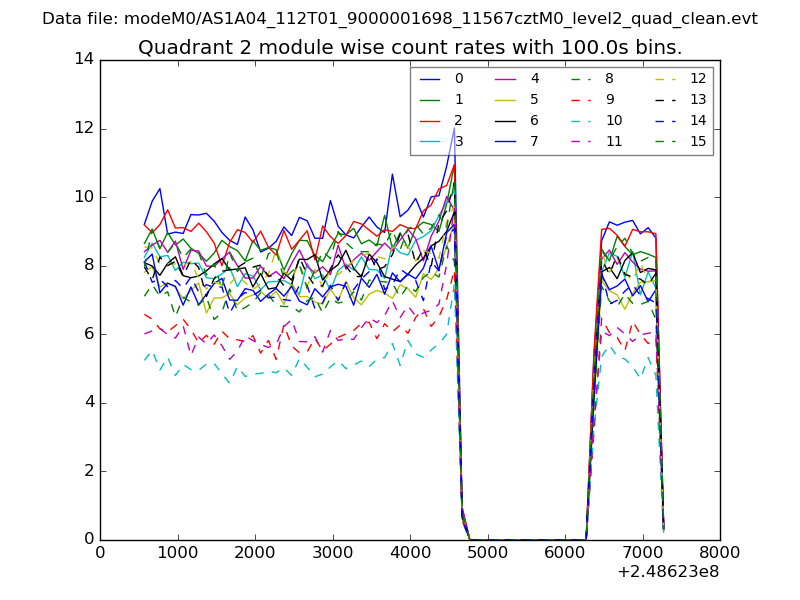
| Module-wise count rates for Quadrant B Data is divided into 100 sec bins |
 |
 |
| Module-wise count rates for Quadrant C Data is divided into 100 sec bins |
 |
 |
| Module-wise count rates for Quadrant D Data is divided into 100 sec bins |
 |
 |
| Parameter | Plot |
|---|---|
| CZT HV Monitor | 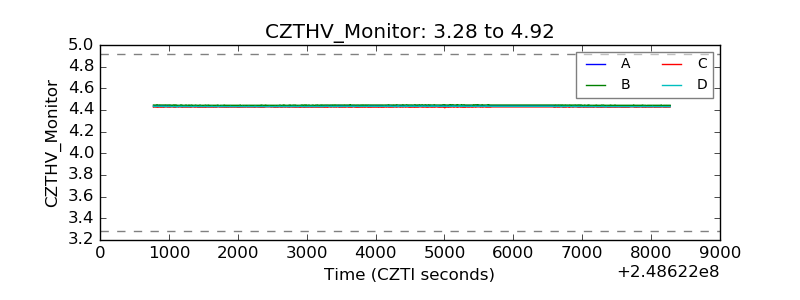 |
| D_VDD |  |
| Temperature 1 | 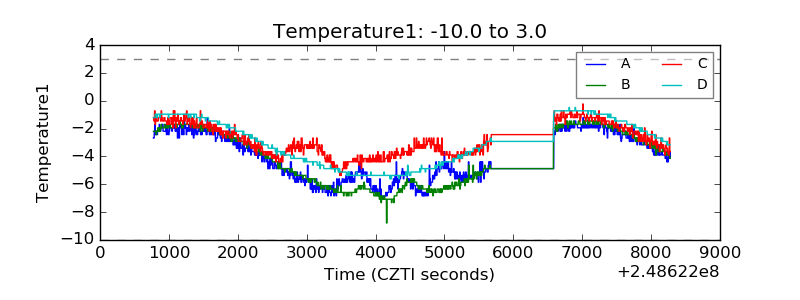 |
| Veto HV Monitor | 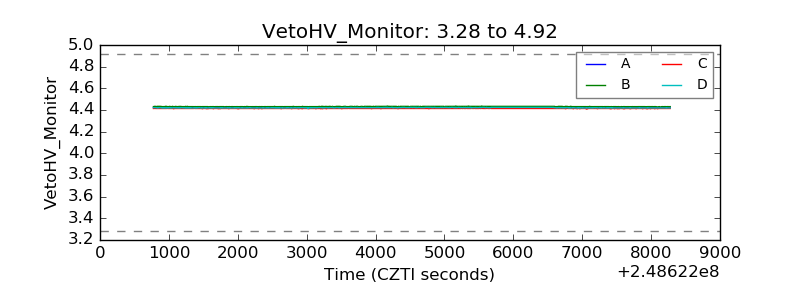 |
| Veto LLD | 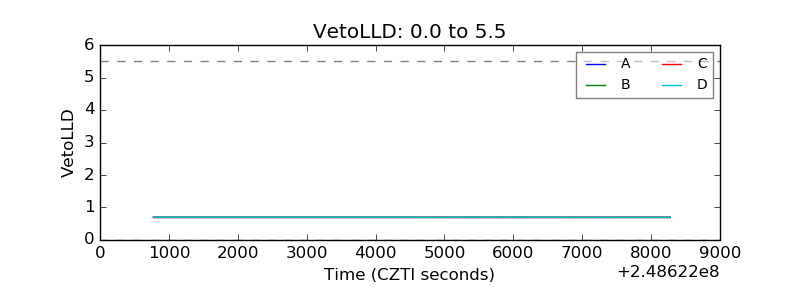 |
| Alpha Counter | 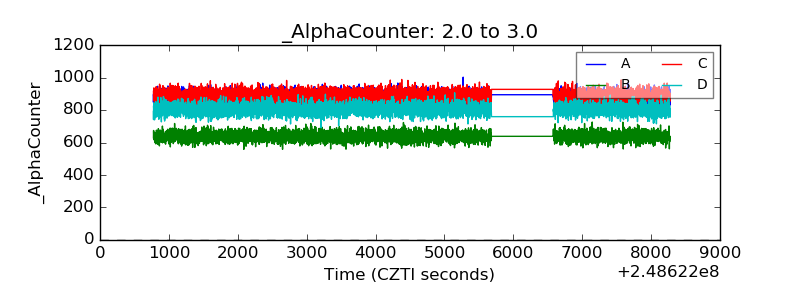 |
| _CPM_Rate | 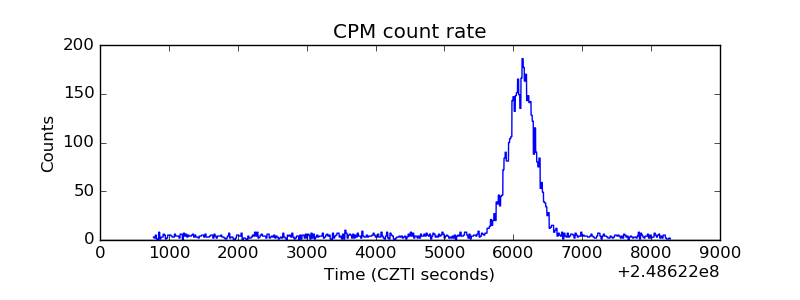 |
| CZT Counter | 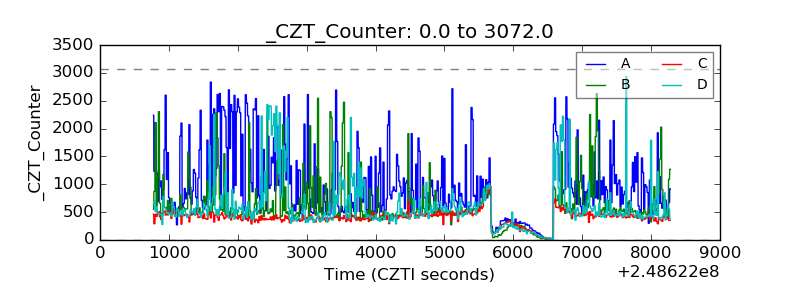 |
| +2.5 Volts monitor |  |
| +5 Volts monitor |  |
| _ROLL_ROT | 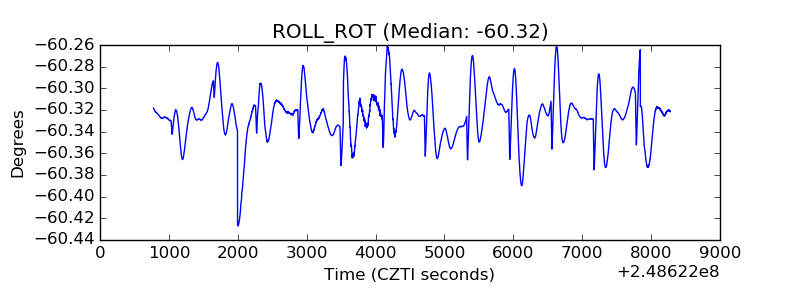 |
| _Roll_DEC | 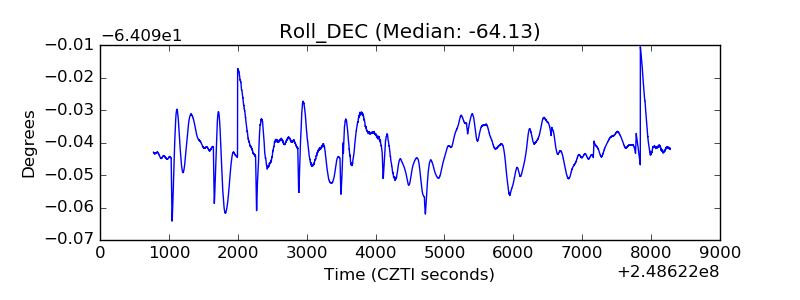 |
| _Roll_RA | 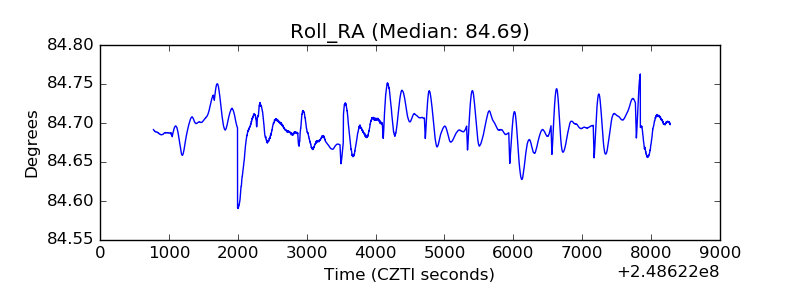 |
| Veto Counter | 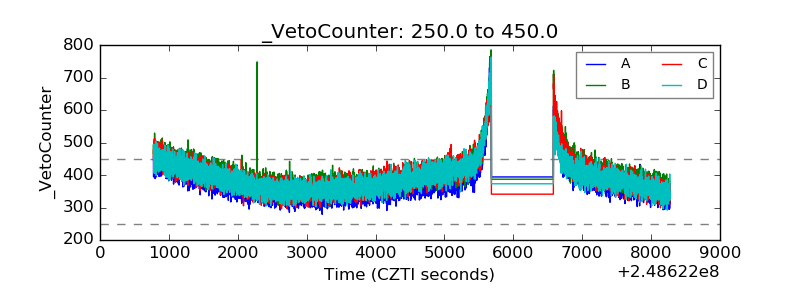 |