| Param | Original file | Final file |
|---|---|---|
| Filename | modeM0/AS1A04_112T01_9000001698_11568cztM0_level2.evt | modeM0/AS1A04_112T01_9000001698_11568cztM0_level2_quad_clean.evt |
| Size (bytes) | 626,227,200 | 106,346,880 |
| Size | 597.2 MB | 101.4 MB |
| Events in quadrant A | 5,799,279 | 671,182 |
| Events in quadrant B | 5,164,515 | 681,719 |
| Events in quadrant C | 3,392,915 | 682,285 |
| Events in quadrant D | 4,095,453 | 658,632 |
| Mode SS | |||
|---|---|---|---|
| Quadrant | BADHDUFLAG | Total packets | Discarded packets |
| A | 0 | 154 | 0 |
| B | 0 | 154 | 0 |
| C | 0 | 154 | 0 |
| D | 0 | 154 | 0 |
| Mode M0 | |||
|---|---|---|---|
| Quadrant | BADHDUFLAG | Total packets | Discarded packets |
| A | 0 | 22414 | 3 |
| B | 0 | 20378 | 2 |
| C | 0 | 15619 | 2 |
| D | 0 | 17619 | 2 |
| Mode M9 | |||
|---|---|---|---|
| Quadrant | BADHDUFLAG | Total packets | Discarded packets |
| A | 0 | 15 | 0 |
| B | 0 | 15 | 0 |
| C | 0 | 15 | 0 |
| D | 0 | 15 | 0 |
| Quadrant | Total seconds | Saturated seconds | Saturation percentage |
|---|---|---|---|
| A | 7576 | 536 | 7.074974% |
| B | 7576 | 554 | 7.312566% |
| C | 7576 | 99 | 1.306758% |
| D | 7576 | 265 | 3.497888% |
Noise dominated data is calculated using 1-second bins in cleaned event files. If a bin has >2000 counts, and if more than 50% of those come from <1% of pixels, then it is considered to be noise-dominated and hence unusable.
| Quadrant | # 1 sec bins | Bins with >0 counts | Bins with >2000 counts | High rate bins dominated by noise | Noise dominated (total time) | Noise dominated (detector-on time) | Marked lightcurve |
|---|---|---|---|---|---|---|---|
| A | 9012 | 7579 | 168 | 168 | 1.86% | 2.22% | 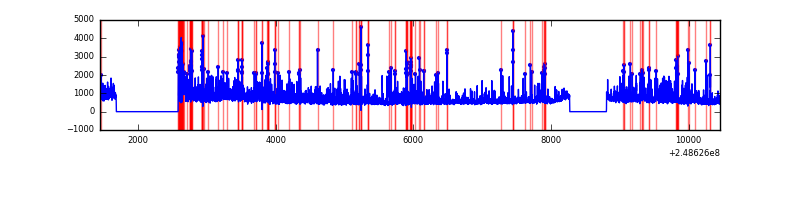 |
| B | 9012 | 7579 | 241 | 241 | 2.67% | 3.18% | 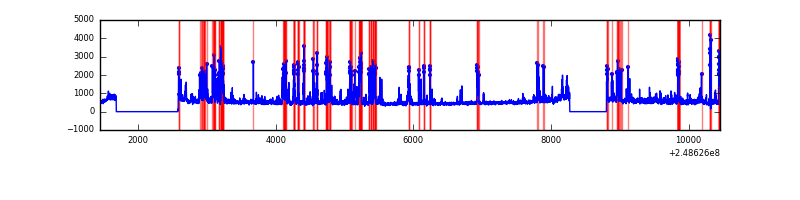 |
| C | 9012 | 7579 | 0 | 0 | 0.00% | 0.00% | 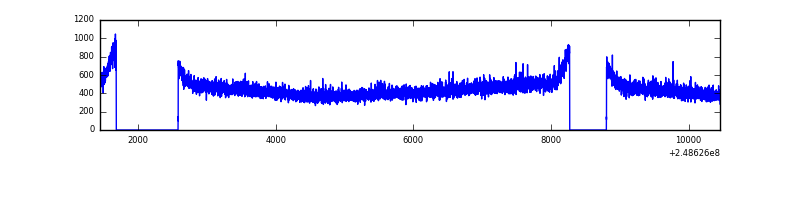 |
| D | 9012 | 7579 | 103 | 103 | 1.14% | 1.36% | 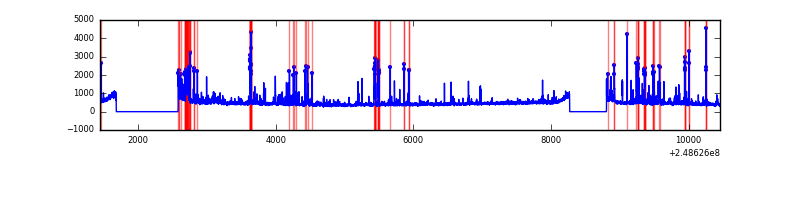 |
Top three noisy pixels from each quadrant. If the there are fewer than three noisy pixels in the level2.evt file, extra rows are filled as -1
| Pixel properties | Quadrant properties | ||||||
|---|---|---|---|---|---|---|---|
| Quadrant | DetID | PixID | Counts | Sigma | Mean | Median | Sigma |
| A | 8 | 5 | 1936105 | 10884.24 | 877 | 859 | 177.8 |
| A | 1 | 162 | 154875 | 866.22 | 877 | 859 | 177.8 |
| A | 1 | 178 | 96904 | 540.18 | 877 | 859 | 177.8 |
| B | 4 | 239 | 1243015 | 7403.8 | 882 | 859 | 167.8 |
| B | 15 | 204 | 202731 | 1203.25 | 882 | 859 | 167.8 |
| B | 11 | 51 | 143212 | 848.49 | 882 | 859 | 167.8 |
| C | 13 | 61 | 6644 | 28.83 | 870 | 870 | 200.3 |
| C | 3 | 202 | 2248 | 6.88 | 870 | 870 | 200.3 |
| C | 7 | 247 | 1884 | 5.06 | 870 | 870 | 200.3 |
| D | 13 | 137 | 307032 | 1494.15 | 862 | 835 | 204.9 |
| D | 2 | 120 | 153153 | 743.27 | 862 | 835 | 204.9 |
| D | 10 | 253 | 150965 | 732.59 | 862 | 835 | 204.9 |
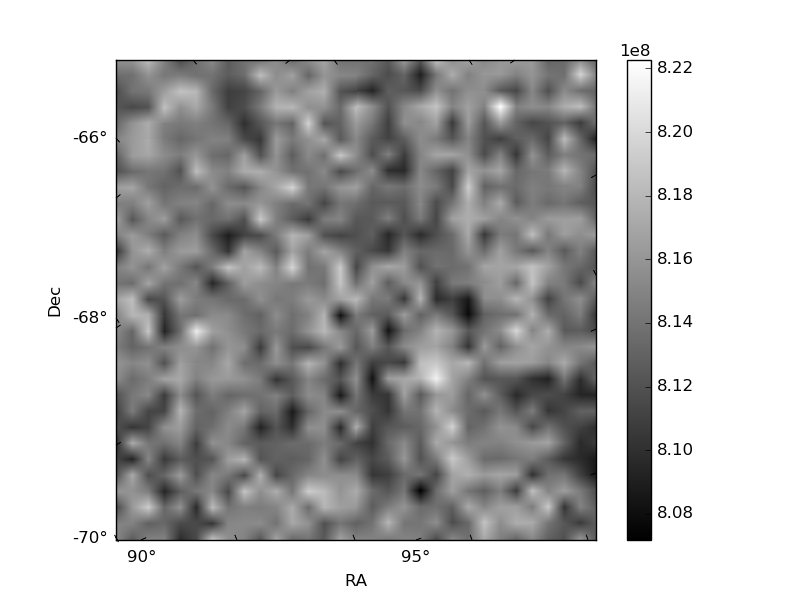
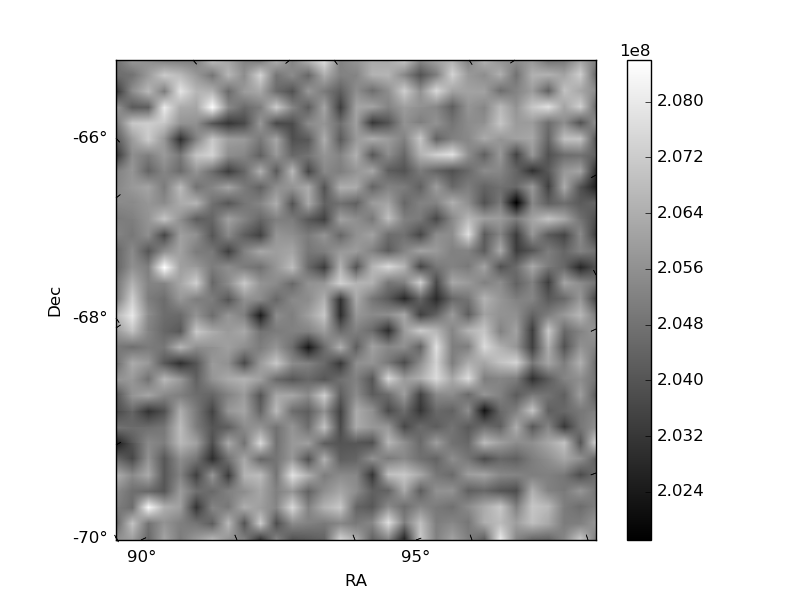
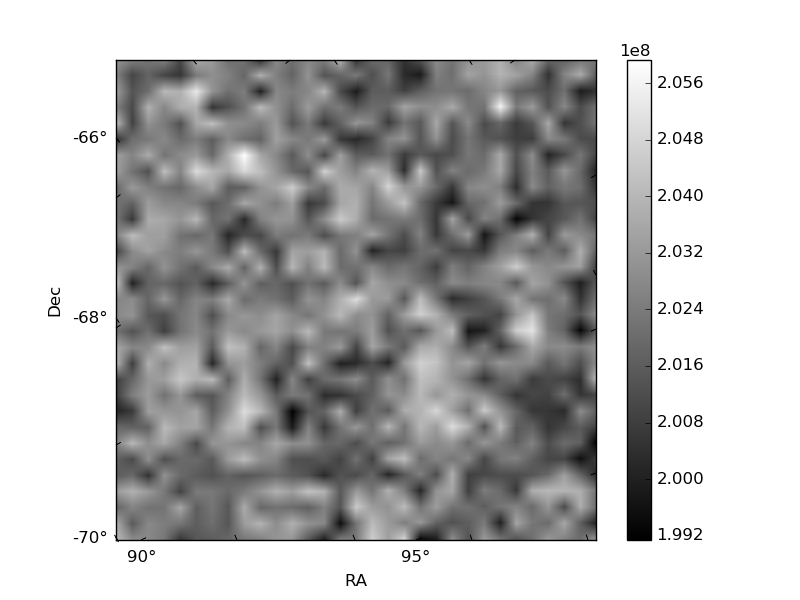
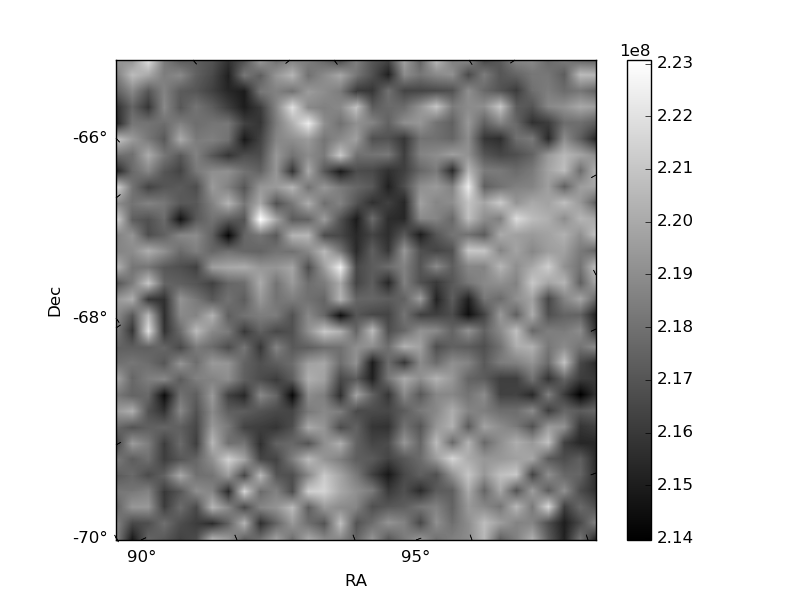
Histogram calculated using DETX and DETY for each event in the final _common_clean file
| Quadrant A | 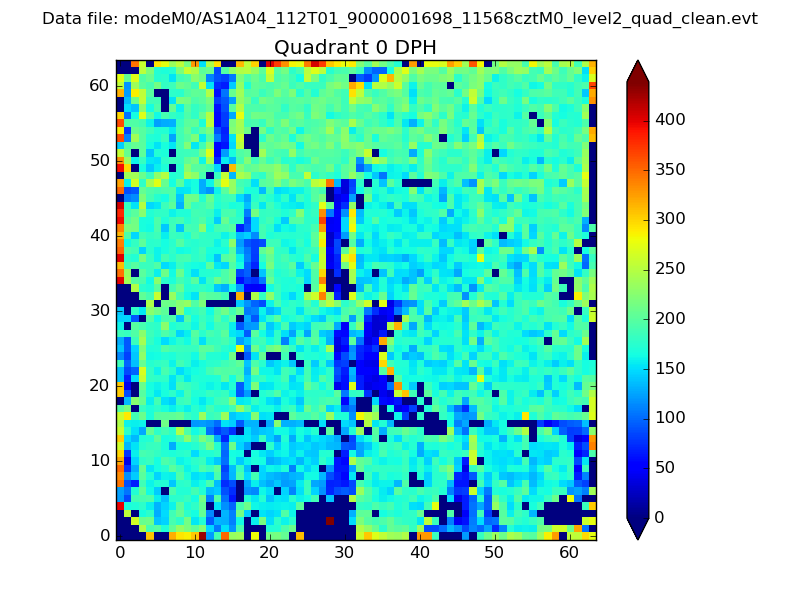 |
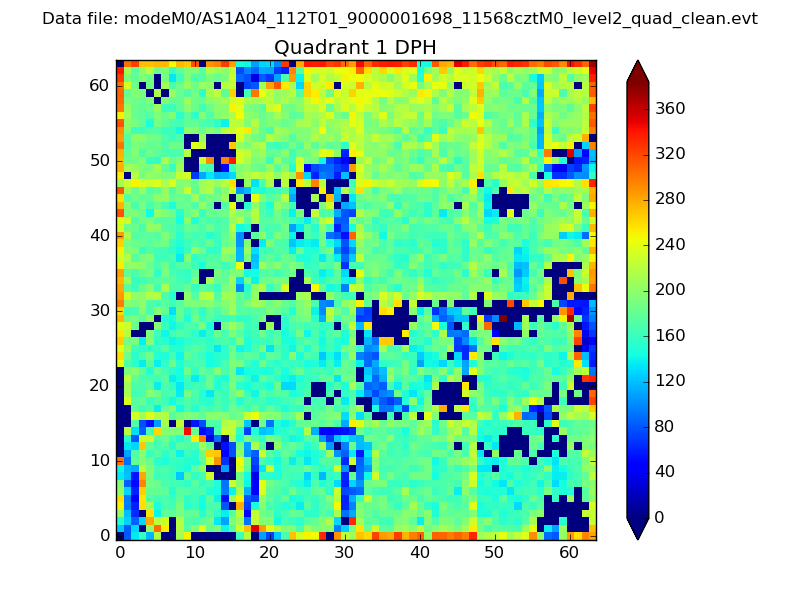 |
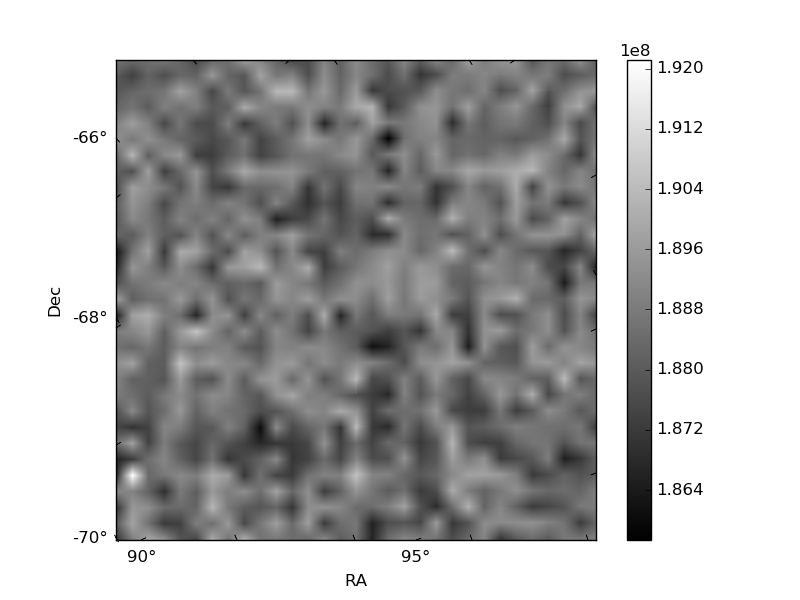
Quadrant B |
|---|---|---|---|
| Quadrant D | 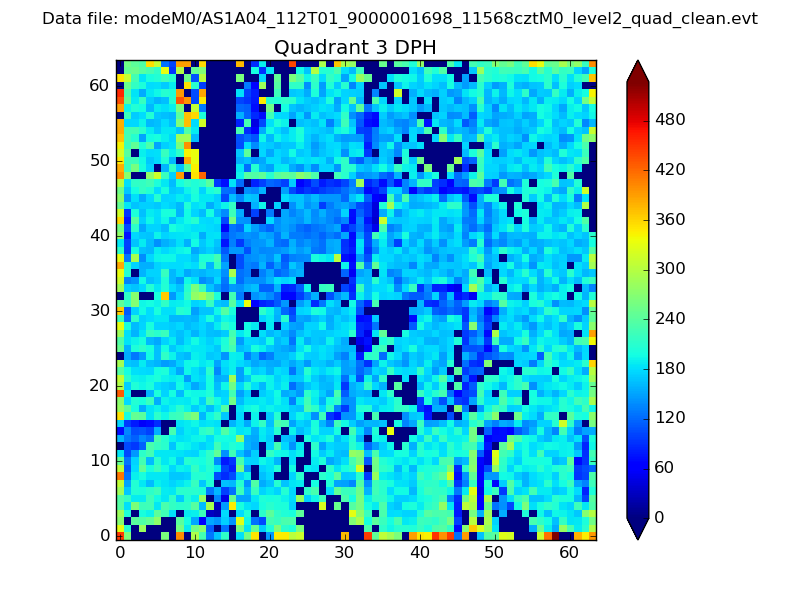 |
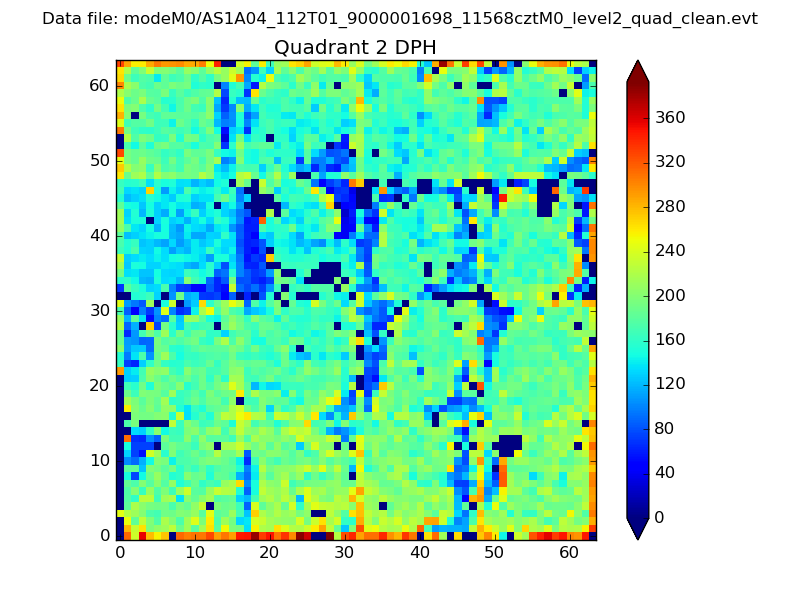 |
Quadrant C |
| Plot type | Count rate plots | Images |
|---|---|---|
| Comparison with Poisson distribution Blue bars denote a histogram of data divided into 1 sec bins. Red curve is a Poisson curve with rate = median count rate of data. |
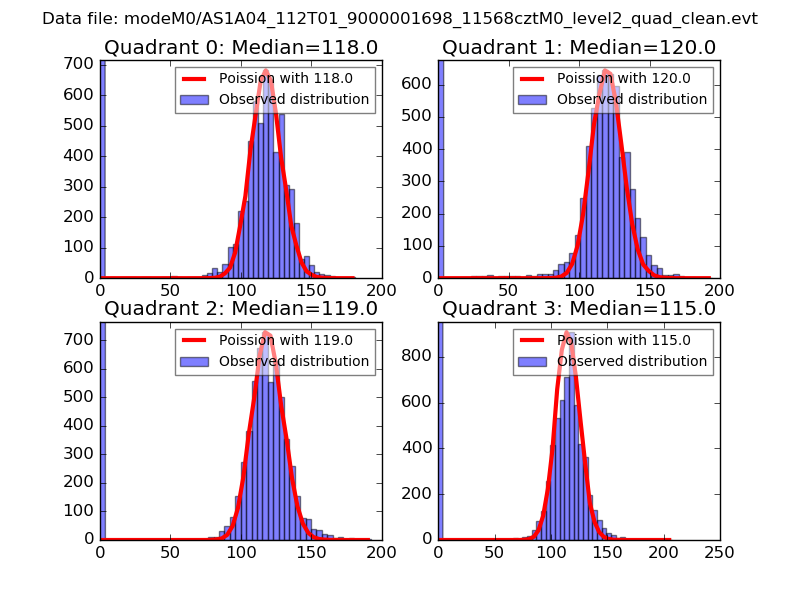 |
 |
| Quadrant-wise count rates Data is divided into 100 sec bins |
 |
|
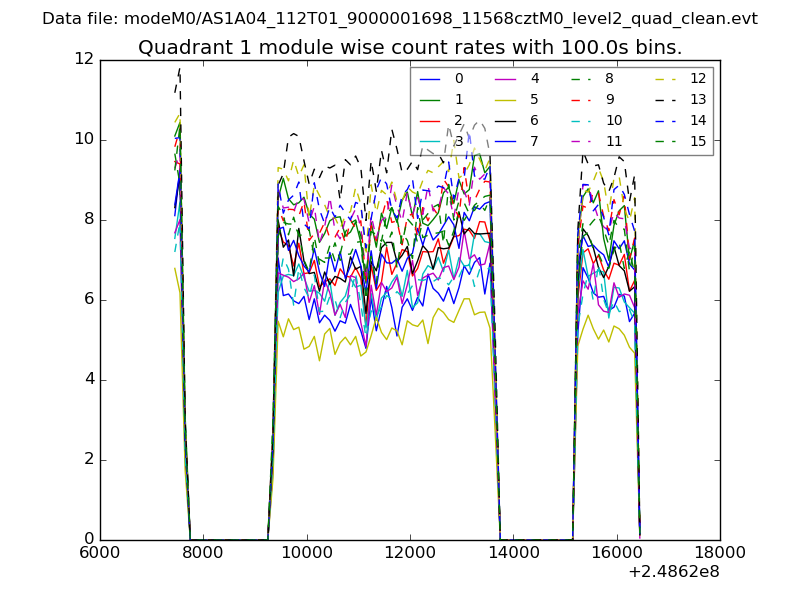
| Module-wise count rates for Quadrant A Data is divided into 100 sec bins |
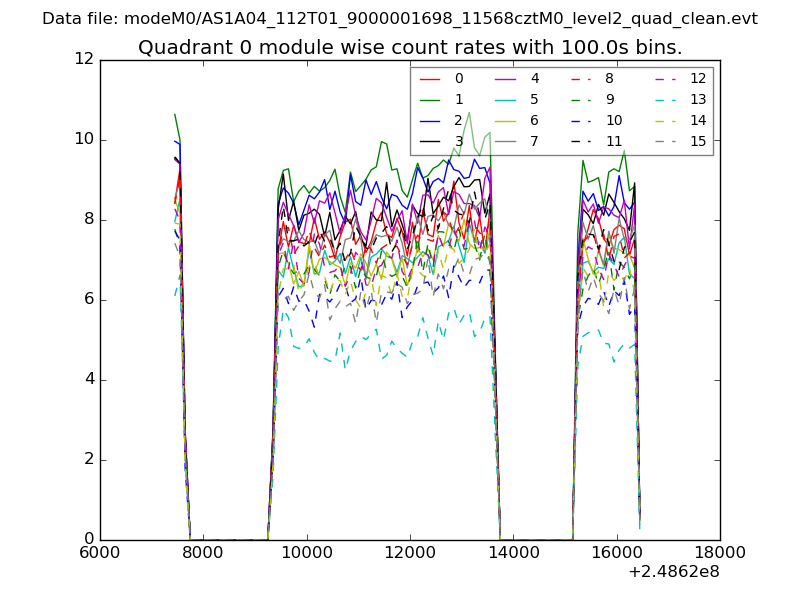 |
 |
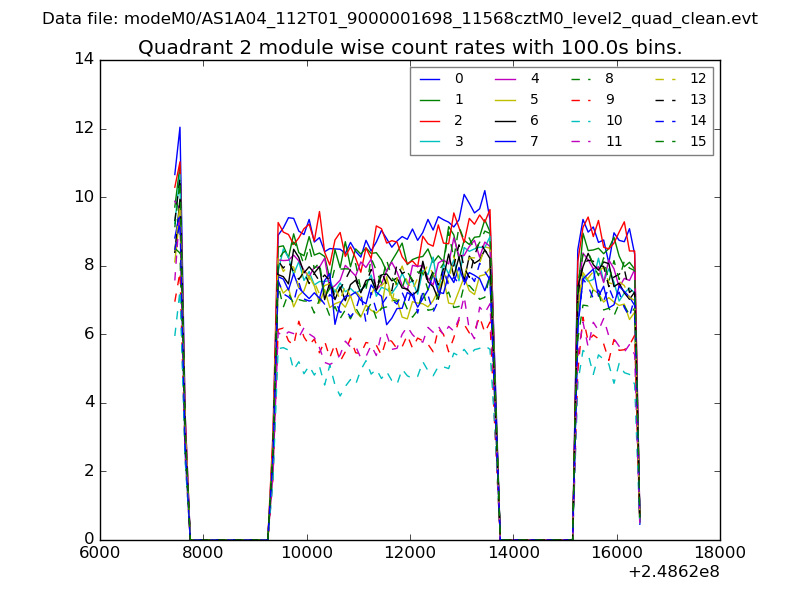
| Module-wise count rates for Quadrant B Data is divided into 100 sec bins |
 |
 |
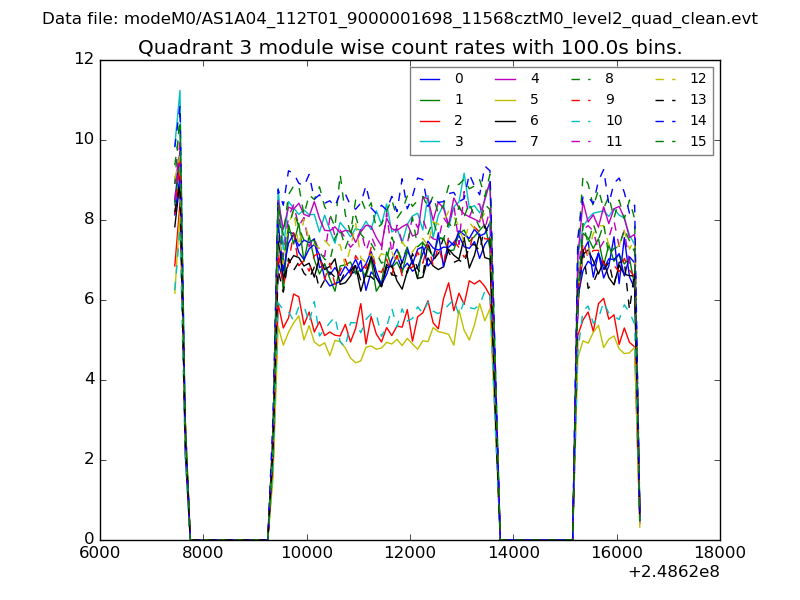
| Module-wise count rates for Quadrant C Data is divided into 100 sec bins |
 |
 |
| Module-wise count rates for Quadrant D Data is divided into 100 sec bins |
 |
 |
| Parameter | Plot |
|---|---|
| CZT HV Monitor | 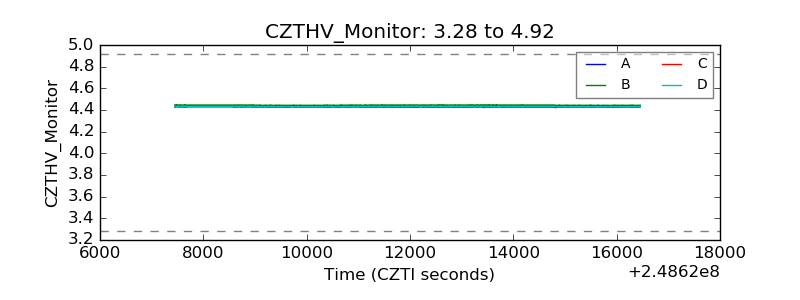 |
| D_VDD | 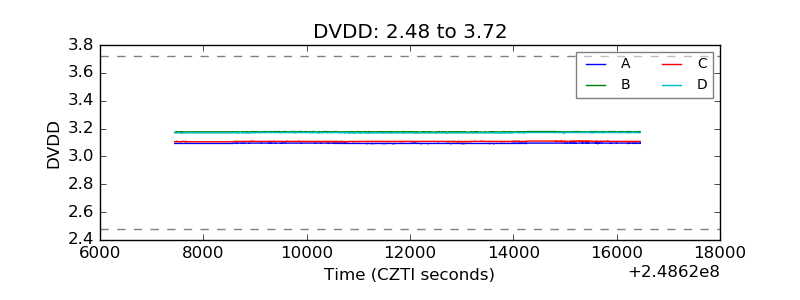 |
| Temperature 1 | 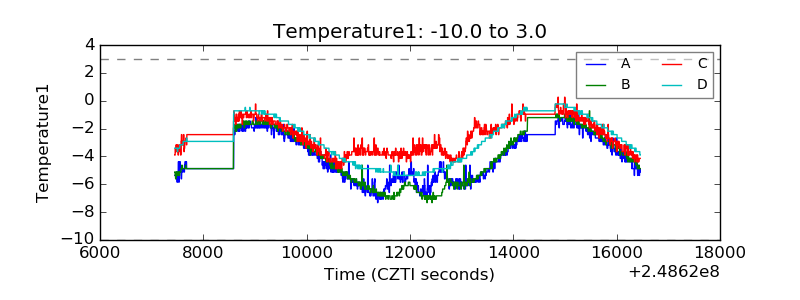 |
| Veto HV Monitor | 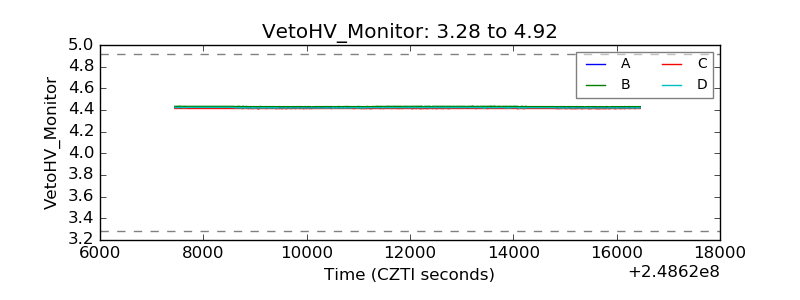 |
| Veto LLD | 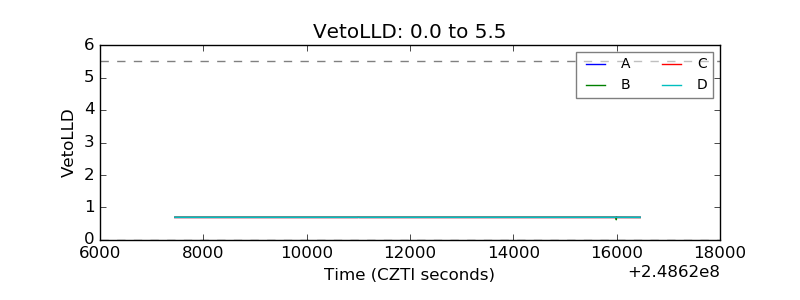 |
| Alpha Counter | 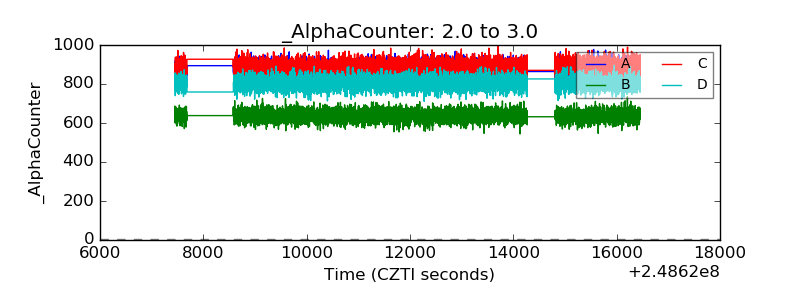 |
| _CPM_Rate | 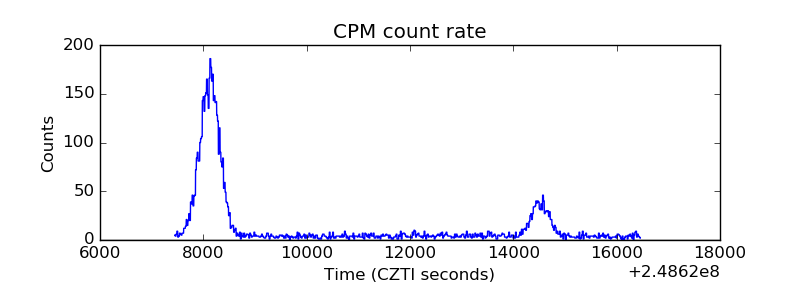 |
| CZT Counter | 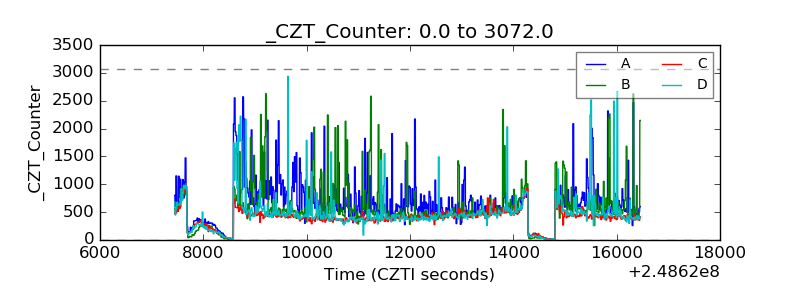 |
| +2.5 Volts monitor |  |
| +5 Volts monitor | 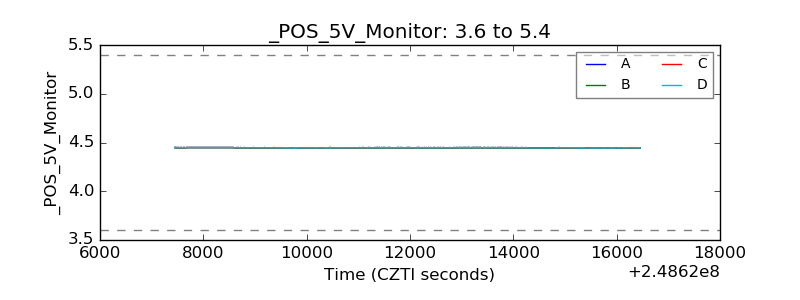 |
| _ROLL_ROT | 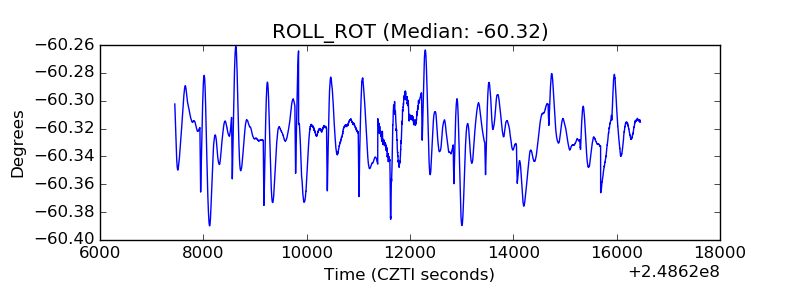 |
| _Roll_DEC | 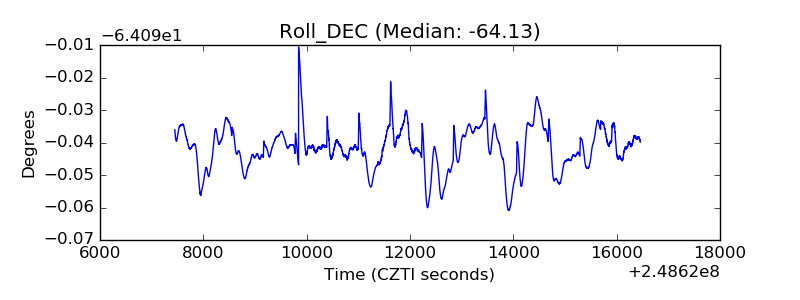 |
| _Roll_RA | 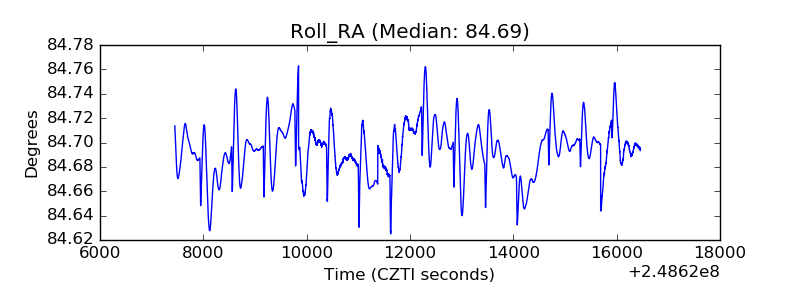 |
| Veto Counter | 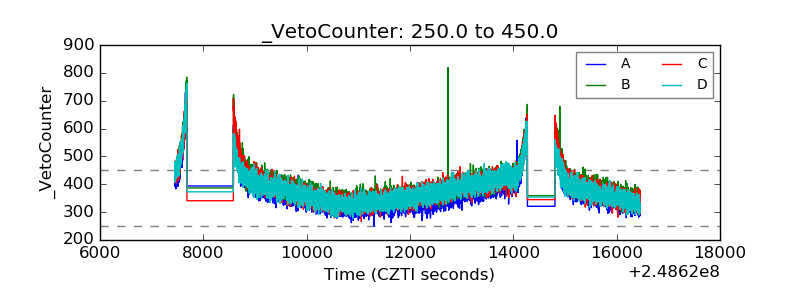 |