| Param | Original file | Final file |
|---|---|---|
| Filename | modeM0/AS1A04_112T01_9000001698_11569cztM0_level2.evt | modeM0/AS1A04_112T01_9000001698_11569cztM0_level2_quad_clean.evt |
| Size (bytes) | 665,997,120 | 103,677,120 |
| Size | 635.1 MB | 98.9 MB |
| Events in quadrant A | 6,541,760 | 638,335 |
| Events in quadrant B | 5,651,587 | 661,172 |
| Events in quadrant C | 3,392,822 | 667,512 |
| Events in quadrant D | 4,067,522 | 642,464 |
| Mode SS | |||
|---|---|---|---|
| Quadrant | BADHDUFLAG | Total packets | Discarded packets |
| A | 0 | 154 | 0 |
| B | 0 | 154 | 0 |
| C | 0 | 154 | 0 |
| D | 0 | 154 | 0 |
| Mode M0 | |||
|---|---|---|---|
| Quadrant | BADHDUFLAG | Total packets | Discarded packets |
| A | 0 | 24743 | 3 |
| B | 0 | 21947 | 2 |
| C | 0 | 15712 | 2 |
| D | 0 | 17559 | 2 |
| Mode M9 | |||
|---|---|---|---|
| Quadrant | BADHDUFLAG | Total packets | Discarded packets |
| A | 0 | 9 | 0 |
| B | 0 | 9 | 0 |
| C | 0 | 9 | 0 |
| D | 0 | 9 | 0 |
| Quadrant | Total seconds | Saturated seconds | Saturation percentage |
|---|---|---|---|
| A | 7627 | 920 | 12.062410% |
| B | 7627 | 744 | 9.754818% |
| C | 7627 | 65 | 0.852235% |
| D | 7627 | 159 | 2.084699% |
Noise dominated data is calculated using 1-second bins in cleaned event files. If a bin has >2000 counts, and if more than 50% of those come from <1% of pixels, then it is considered to be noise-dominated and hence unusable.
| Quadrant | # 1 sec bins | Bins with >0 counts | Bins with >2000 counts | High rate bins dominated by noise | Noise dominated (total time) | Noise dominated (detector-on time) | Marked lightcurve |
|---|---|---|---|---|---|---|---|
| A | 8373 | 7630 | 363 | 363 | 4.34% | 4.76% | 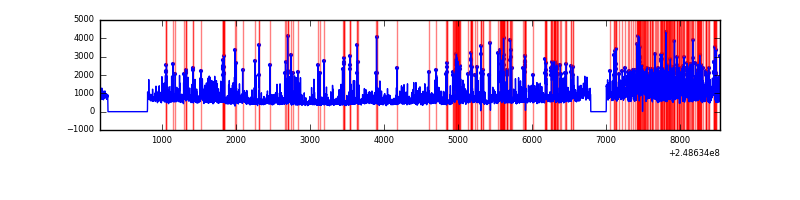 |
| B | 8373 | 7630 | 314 | 314 | 3.75% | 4.12% | 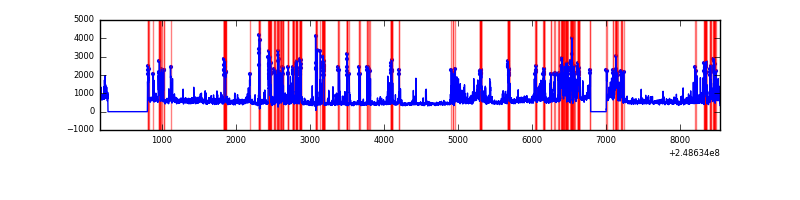 |
| C | 8373 | 7630 | 0 | 0 | 0.00% | 0.00% |  |
| D | 8373 | 7630 | 64 | 64 | 0.76% | 0.84% | 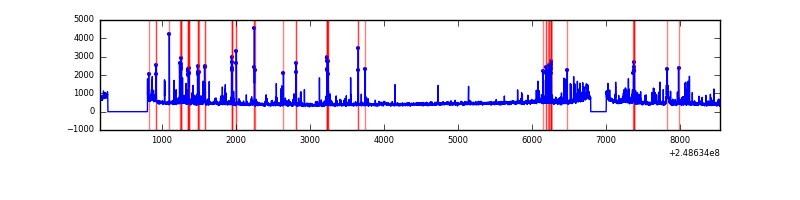 |
Top three noisy pixels from each quadrant. If the there are fewer than three noisy pixels in the level2.evt file, extra rows are filled as -1
| Pixel properties | Quadrant properties | ||||||
|---|---|---|---|---|---|---|---|
| Quadrant | DetID | PixID | Counts | Sigma | Mean | Median | Sigma |
| A | 8 | 5 | 2690630 | 15416.87 | 859 | 841 | 174.5 |
| A | 1 | 162 | 190468 | 1086.87 | 859 | 841 | 174.5 |
| A | 1 | 178 | 114333 | 650.49 | 859 | 841 | 174.5 |
| B | 4 | 239 | 1614412 | 9712.79 | 870 | 847 | 166.1 |
| B | 15 | 204 | 199688 | 1196.92 | 870 | 847 | 166.1 |
| B | 11 | 51 | 182197 | 1091.63 | 870 | 847 | 166.1 |
| C | 13 | 61 | 6519 | 28.14 | 869 | 871 | 200.7 |
| C | 12 | 4 | 2918 | 10.2 | 869 | 871 | 200.7 |
| C | 3 | 202 | 2211 | 6.68 | 869 | 871 | 200.7 |
| D | 10 | 253 | 233857 | 1117.94 | 862 | 833 | 208.4 |
| D | 2 | 120 | 228324 | 1091.4 | 862 | 833 | 208.4 |
| D | 13 | 122 | 61972 | 293.32 | 862 | 833 | 208.4 |
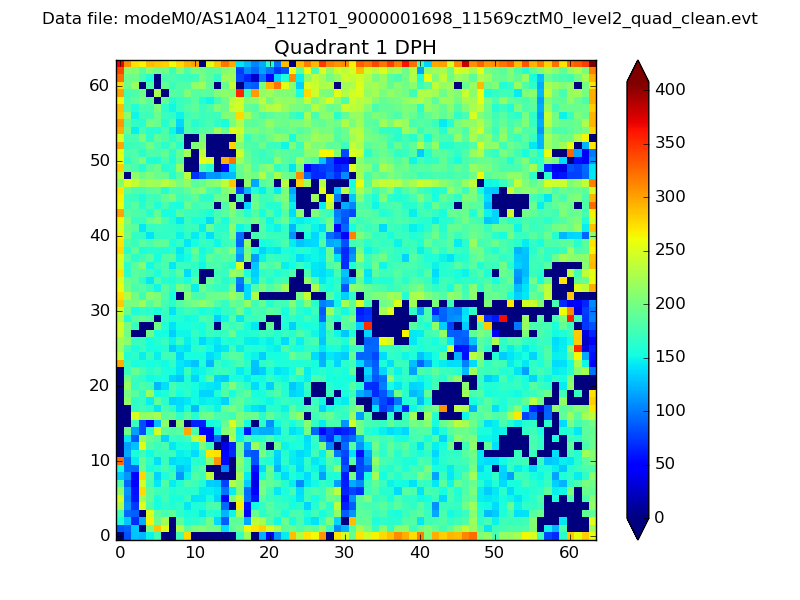
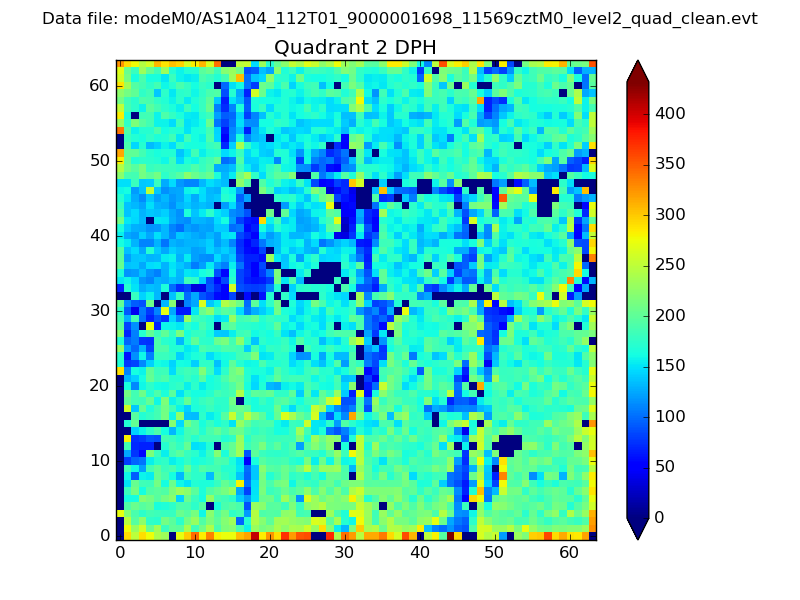
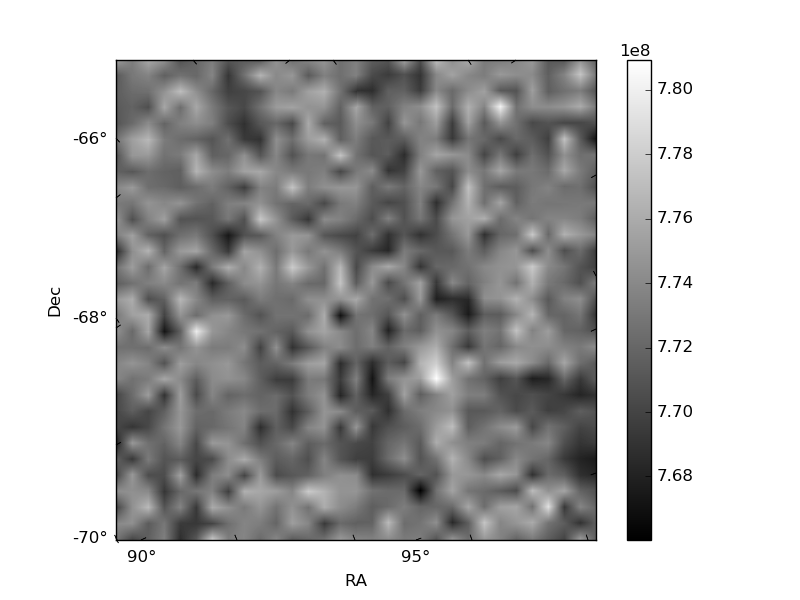
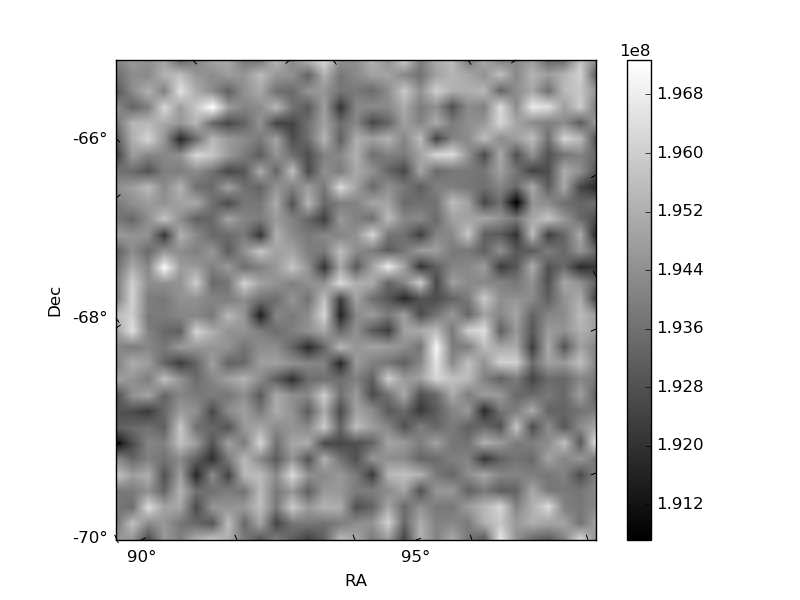
Histogram calculated using DETX and DETY for each event in the final _common_clean file
| Quadrant A | 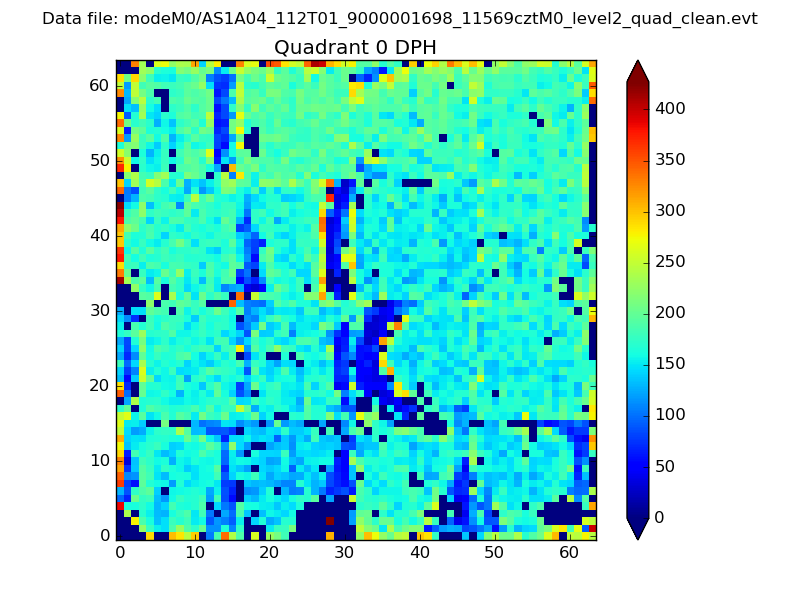 |
 |
Quadrant B |
|---|---|---|---|
| Quadrant D | 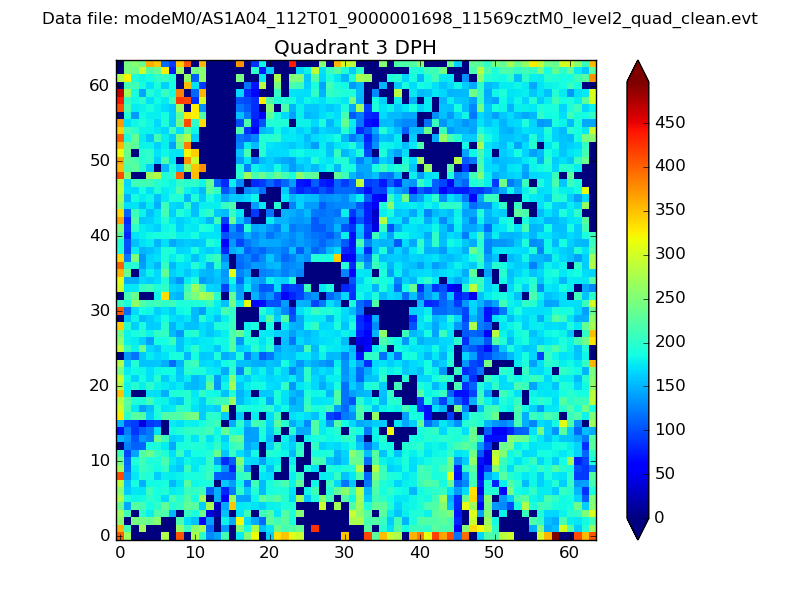 |
 |
Quadrant C |
| Plot type | Count rate plots | Images |
|---|---|---|
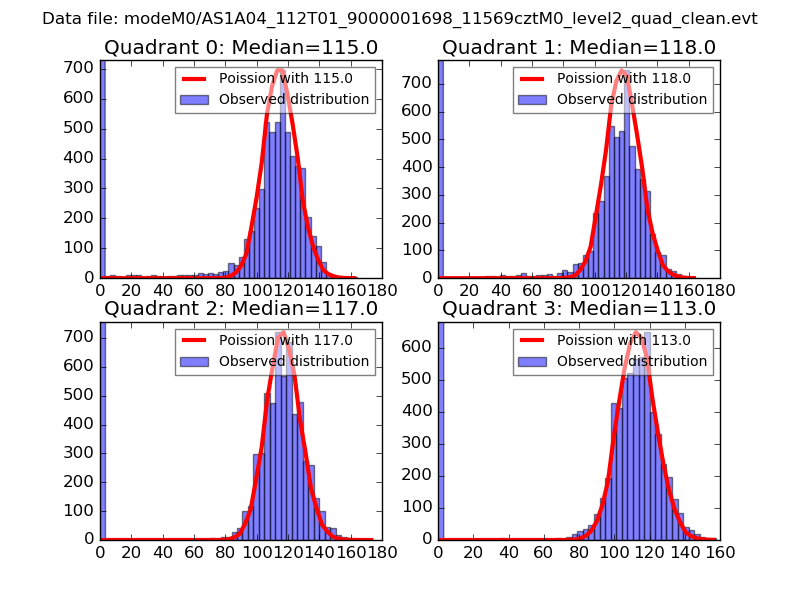
| Comparison with Poisson distribution Blue bars denote a histogram of data divided into 1 sec bins. Red curve is a Poisson curve with rate = median count rate of data. |
 |
 |
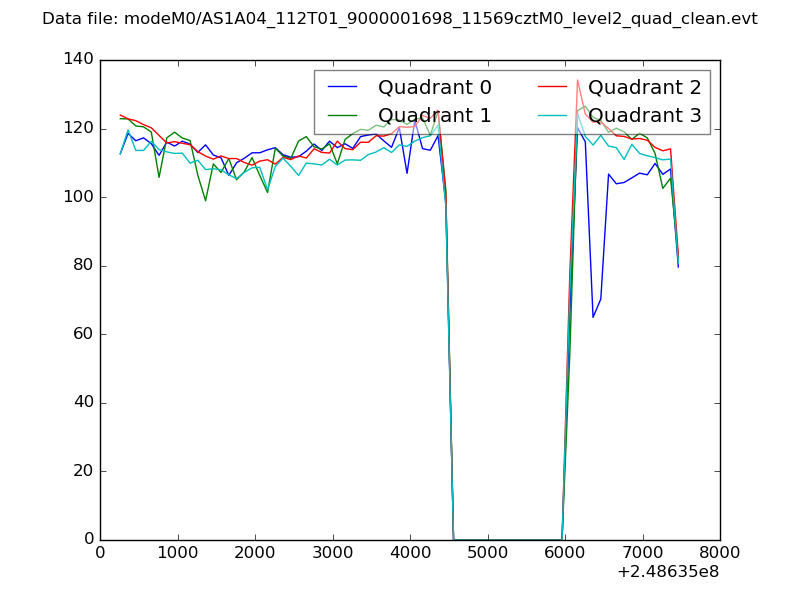
| Quadrant-wise count rates Data is divided into 100 sec bins |
 |
|
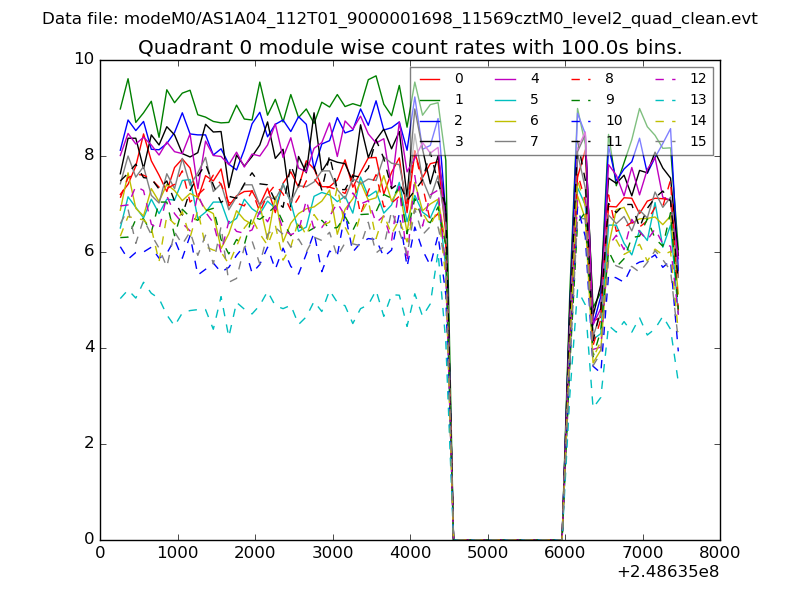
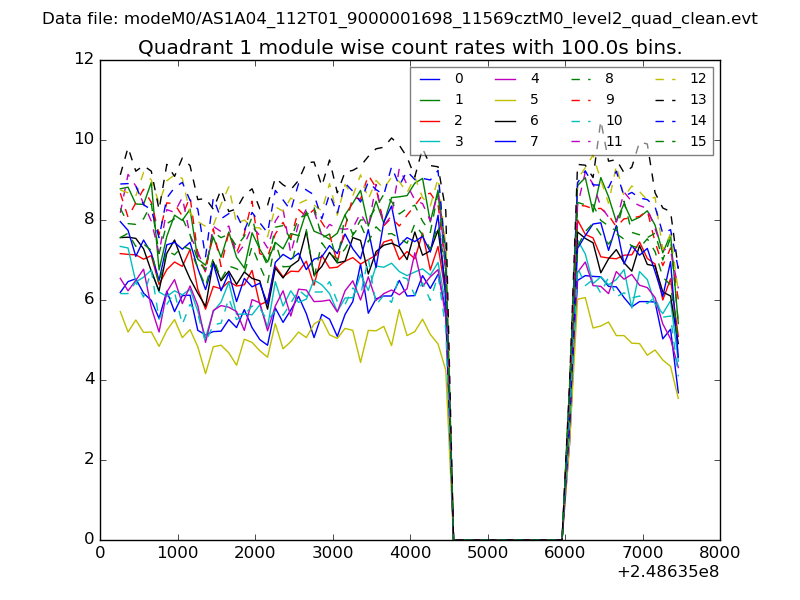
| Module-wise count rates for Quadrant A Data is divided into 100 sec bins |
 |
 |
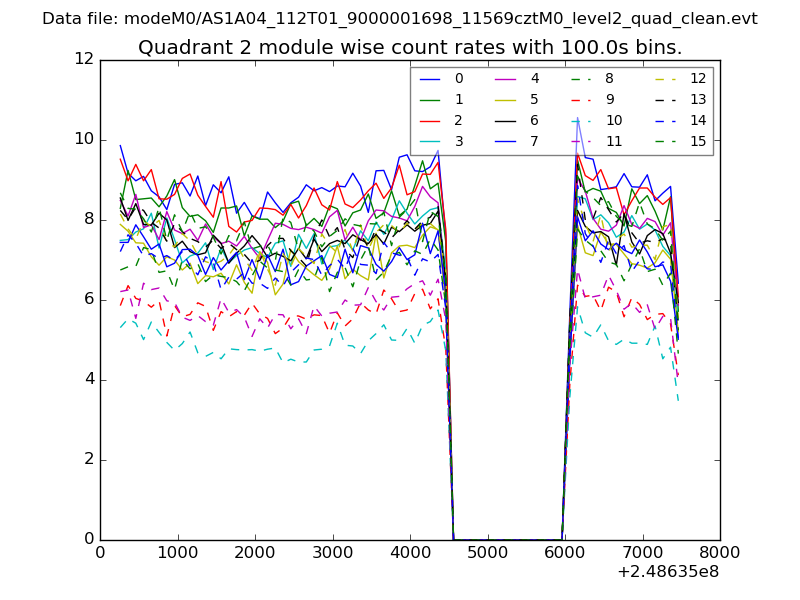
| Module-wise count rates for Quadrant B Data is divided into 100 sec bins |
 |
 |
| Module-wise count rates for Quadrant C Data is divided into 100 sec bins |
 |
 |
| Module-wise count rates for Quadrant D Data is divided into 100 sec bins |
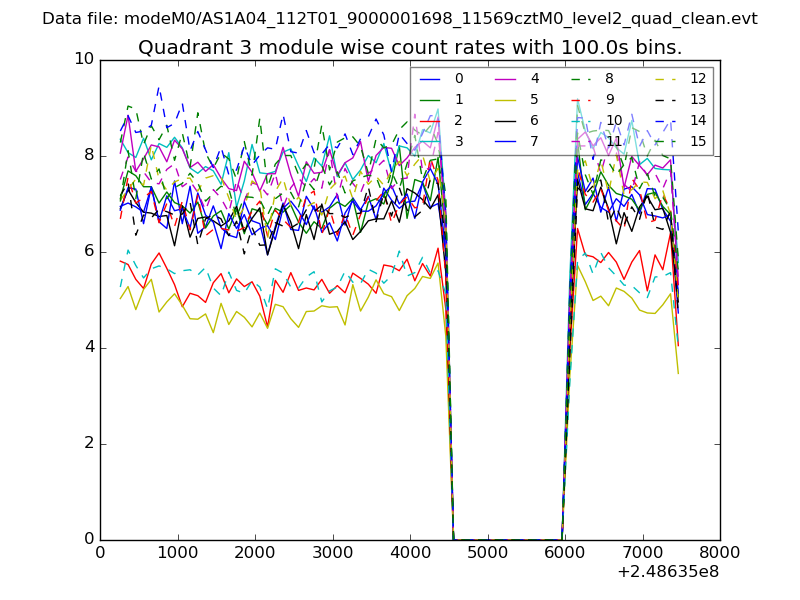 |
 |
| Parameter | Plot |
|---|---|
| CZT HV Monitor | 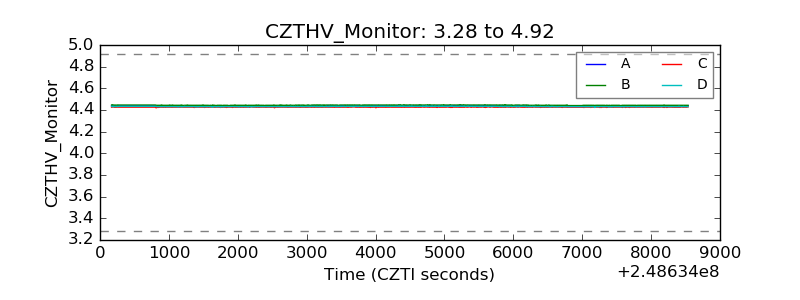 |
| D_VDD | 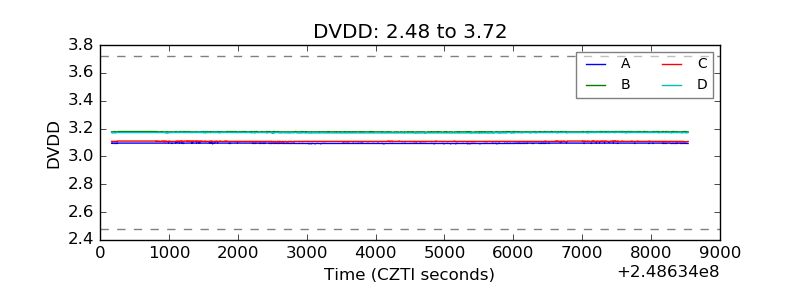 |
| Temperature 1 | 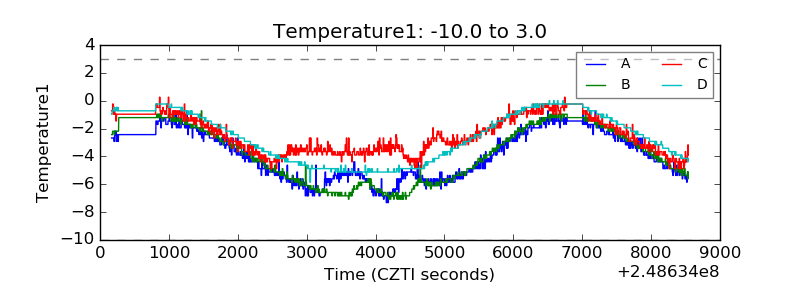 |
| Veto HV Monitor | 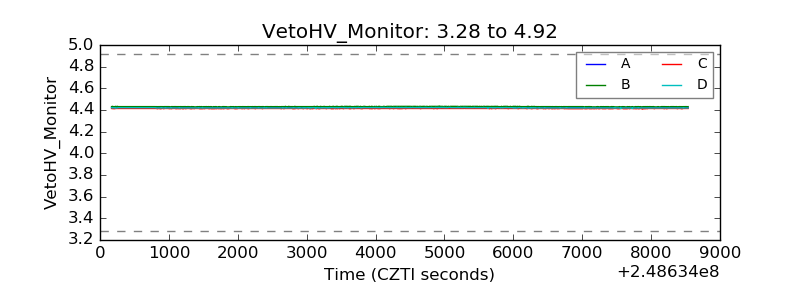 |
| Veto LLD | 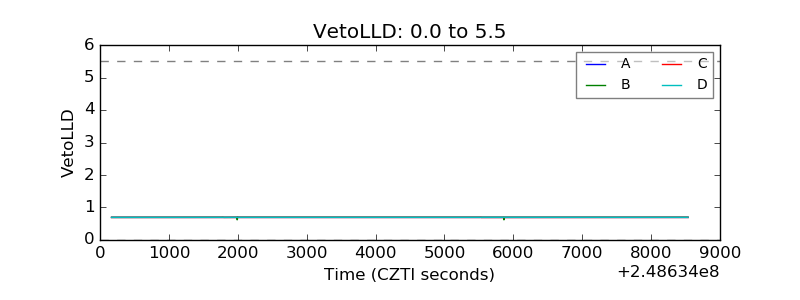 |
| Alpha Counter | 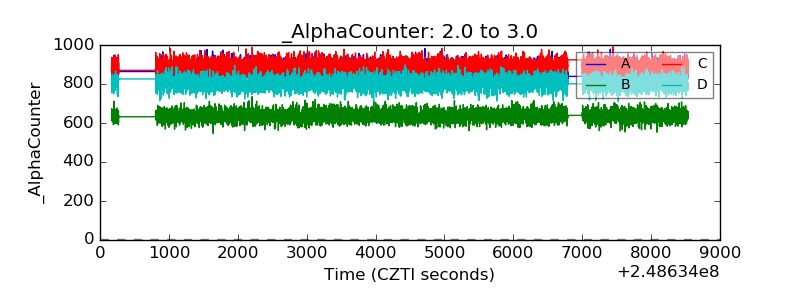 |
| _CPM_Rate | 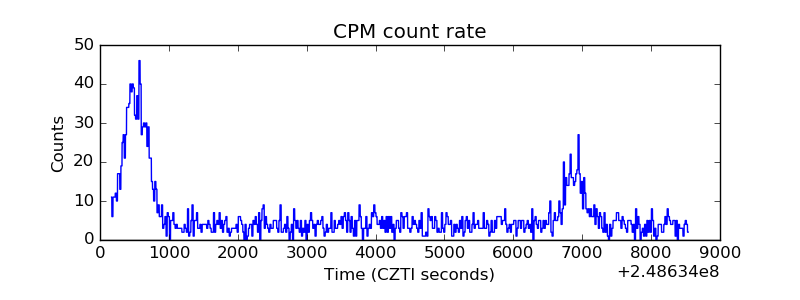 |
| CZT Counter | 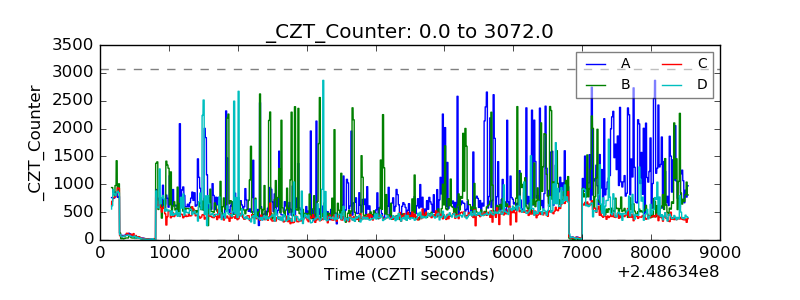 |
| +2.5 Volts monitor | 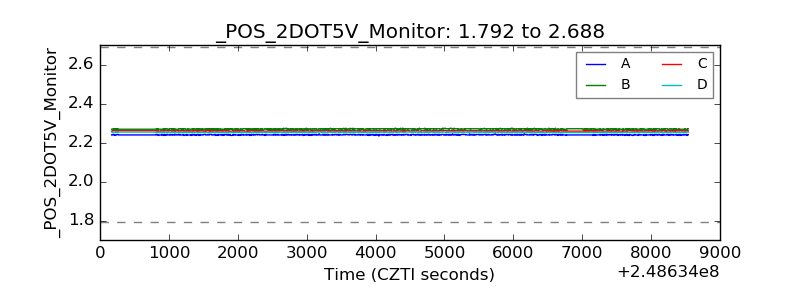 |
| +5 Volts monitor |  |
| _ROLL_ROT | 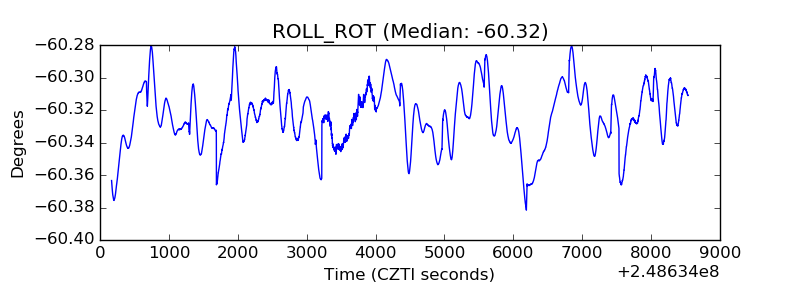 |
| _Roll_DEC | 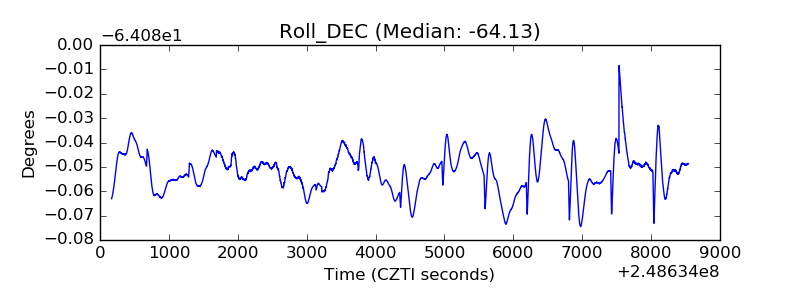 |
| _Roll_RA | 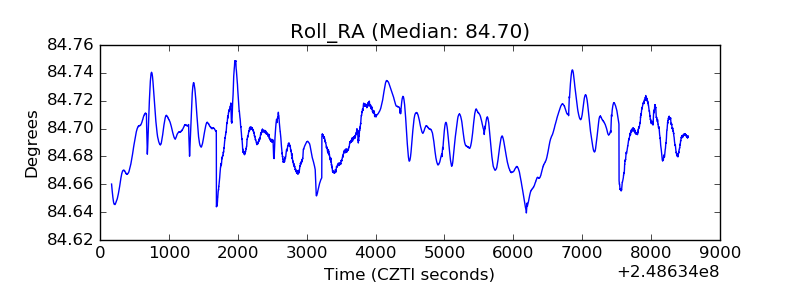 |
| Veto Counter | 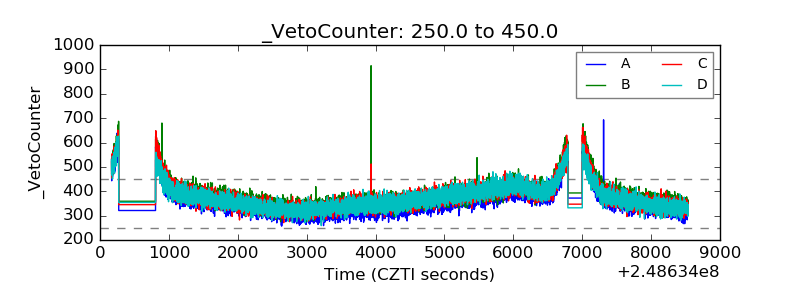 |