| Param | Original file | Final file |
|---|---|---|
| Filename | modeM0/AS1A04_112T01_9000001698_11570cztM0_level2.evt | modeM0/AS1A04_112T01_9000001698_11570cztM0_level2_quad_clean.evt |
| Size (bytes) | 683,974,080 | 104,722,560 |
| Size | 652.3 MB | 99.9 MB |
| Events in quadrant A | 6,932,865 | 634,616 |
| Events in quadrant B | 5,658,692 | 673,740 |
| Events in quadrant C | 3,301,661 | 682,952 |
| Events in quadrant D | 4,310,132 | 654,768 |
| Mode SS | |||
|---|---|---|---|
| Quadrant | BADHDUFLAG | Total packets | Discarded packets |
| A | 0 | 154 | 0 |
| B | 0 | 154 | 0 |
| C | 0 | 154 | 0 |
| D | 0 | 154 | 0 |
| Mode M0 | |||
|---|---|---|---|
| Quadrant | BADHDUFLAG | Total packets | Discarded packets |
| A | 0 | 25832 | 4 |
| B | 0 | 21918 | 3 |
| C | 0 | 15401 | 3 |
| D | 0 | 18314 | 3 |
| Mode M9 | |||
|---|---|---|---|
| Quadrant | BADHDUFLAG | Total packets | Discarded packets |
| A | 0 | 3 | 0 |
| B | 0 | 3 | 0 |
| C | 0 | 3 | 0 |
| D | 0 | 4 | 0 |
| Quadrant | Total seconds | Saturated seconds | Saturation percentage |
|---|---|---|---|
| A | 7542 | 960 | 12.728719% |
| B | 7542 | 718 | 9.520021% |
| C | 7542 | 38 | 0.503845% |
| D | 7542 | 158 | 2.094935% |
Noise dominated data is calculated using 1-second bins in cleaned event files. If a bin has >2000 counts, and if more than 50% of those come from <1% of pixels, then it is considered to be noise-dominated and hence unusable.
| Quadrant | # 1 sec bins | Bins with >0 counts | Bins with >2000 counts | High rate bins dominated by noise | Noise dominated (total time) | Noise dominated (detector-on time) | Marked lightcurve |
|---|---|---|---|---|---|---|---|
| A | 7823 | 7545 | 420 | 420 | 5.37% | 5.57% | 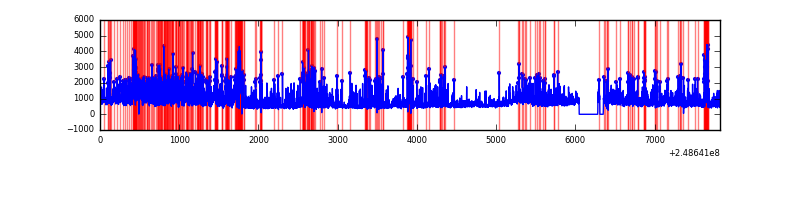 |
| B | 7823 | 7545 | 331 | 331 | 4.23% | 4.39% | 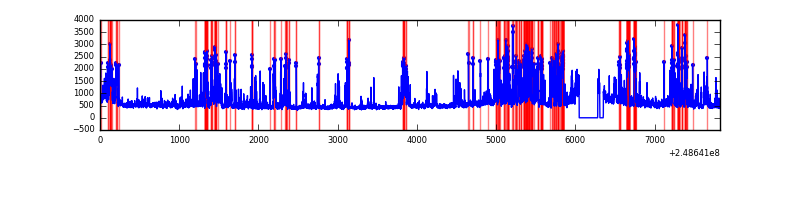 |
| C | 7823 | 7545 | 0 | 0 | 0.00% | 0.00% | 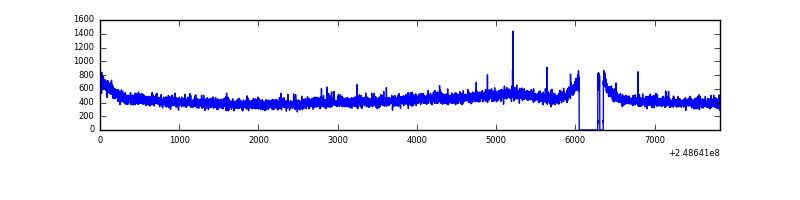 |
| D | 7823 | 7545 | 81 | 81 | 1.04% | 1.07% | 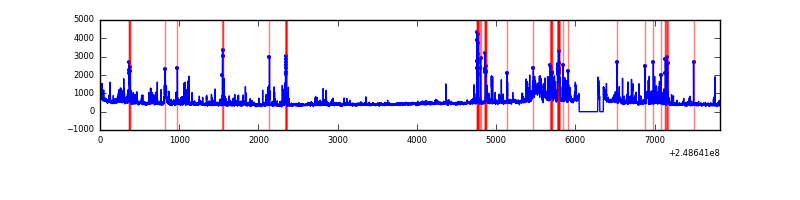 |
Top three noisy pixels from each quadrant. If the there are fewer than three noisy pixels in the level2.evt file, extra rows are filled as -1
| Pixel properties | Quadrant properties | ||||||
|---|---|---|---|---|---|---|---|
| Quadrant | DetID | PixID | Counts | Sigma | Mean | Median | Sigma |
| A | 8 | 5 | 3148192 | 18449.86 | 829 | 810 | 170.6 |
| A | 1 | 162 | 204067 | 1191.49 | 829 | 810 | 170.6 |
| A | 1 | 178 | 125844 | 732.95 | 829 | 810 | 170.6 |
| B | 4 | 239 | 1797710 | 11189.6 | 847 | 826 | 160.6 |
| B | 15 | 204 | 206789 | 1282.58 | 847 | 826 | 160.6 |
| B | 11 | 51 | 173777 | 1077.0 | 847 | 826 | 160.6 |
| C | 13 | 61 | 6261 | 27.71 | 845 | 849 | 195.3 |
| C | 0 | 207 | 3141 | 11.74 | 845 | 849 | 195.3 |
| C | 12 | 4 | 3098 | 11.52 | 845 | 849 | 195.3 |
| D | 2 | 120 | 358498 | 1798.67 | 834 | 809 | 198.9 |
| D | 5 | 222 | 258111 | 1293.87 | 834 | 809 | 198.9 |
| D | 10 | 253 | 230435 | 1154.7 | 834 | 809 | 198.9 |
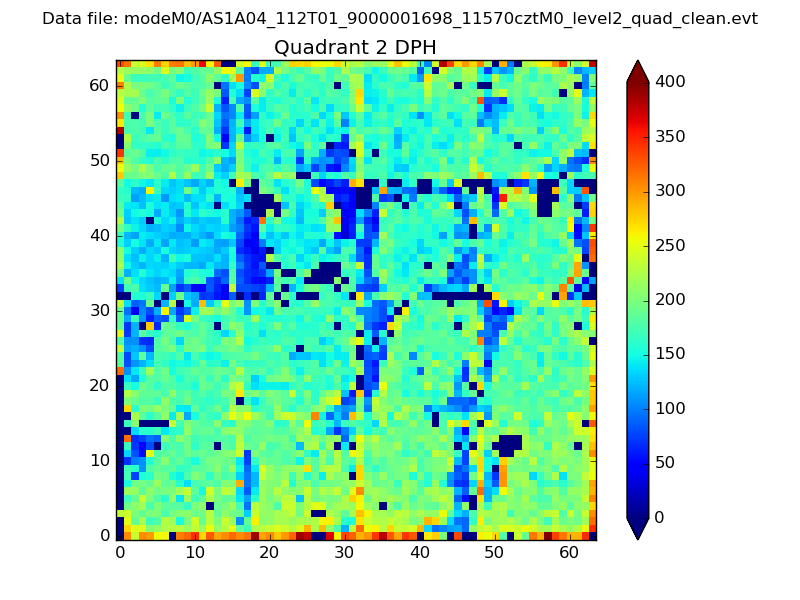
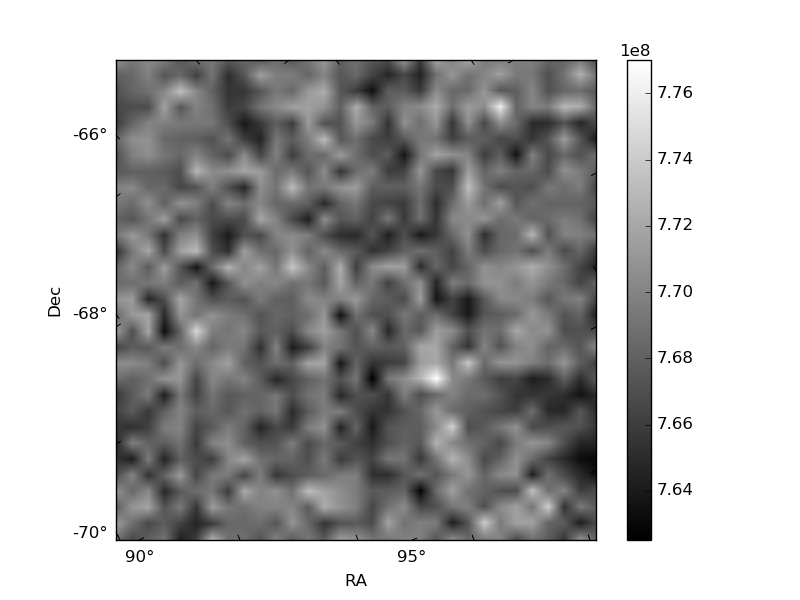
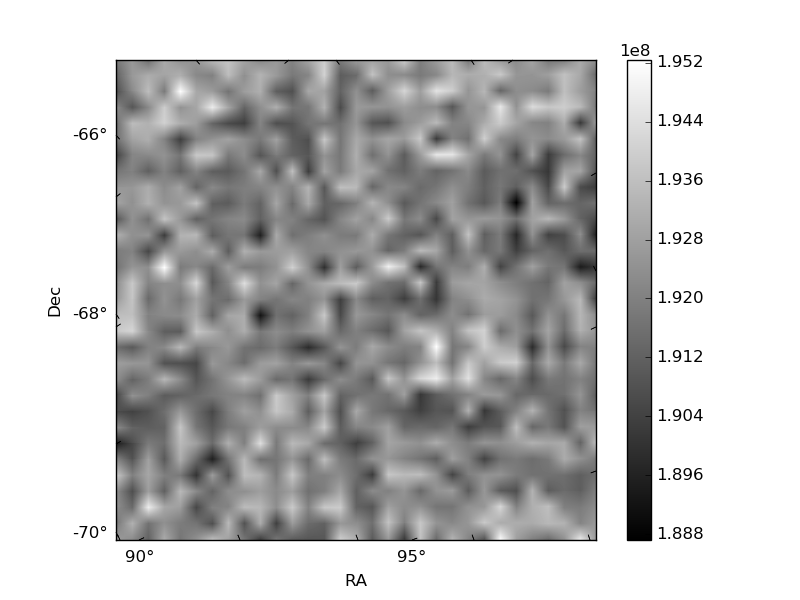
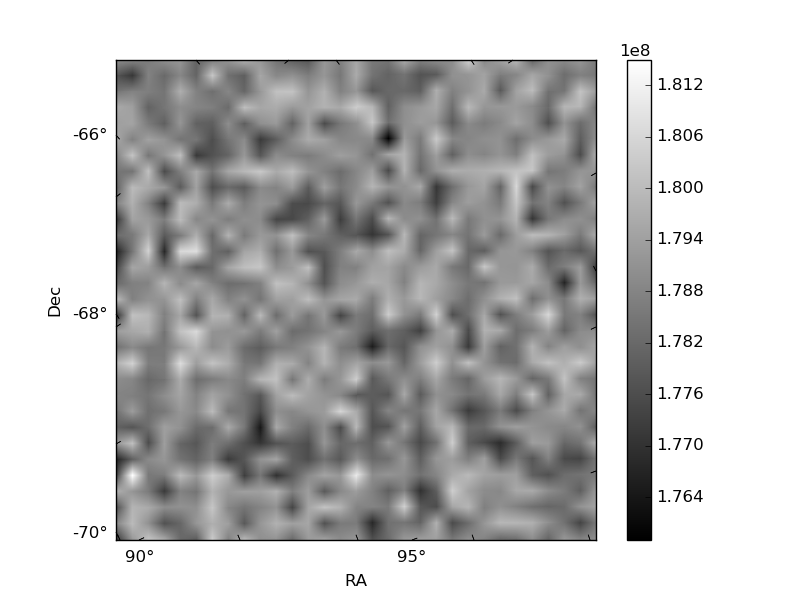
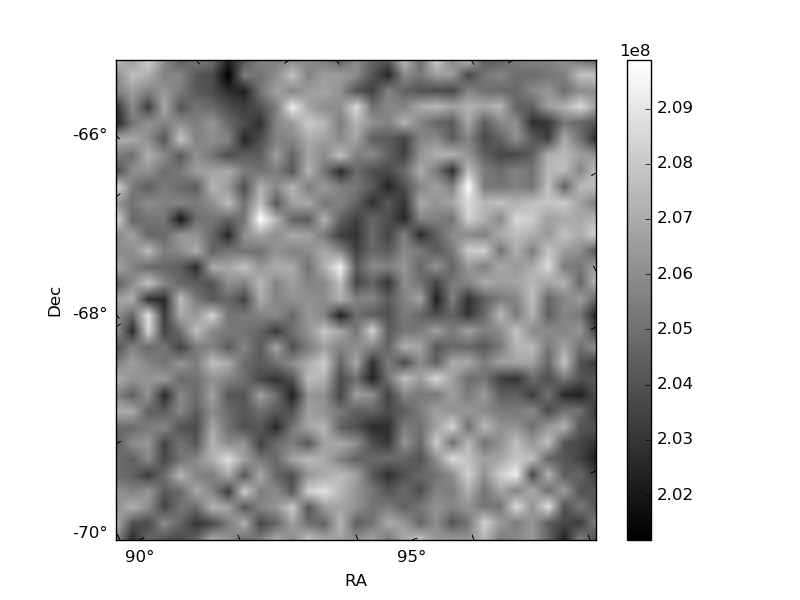
Histogram calculated using DETX and DETY for each event in the final _common_clean file
| Quadrant A | 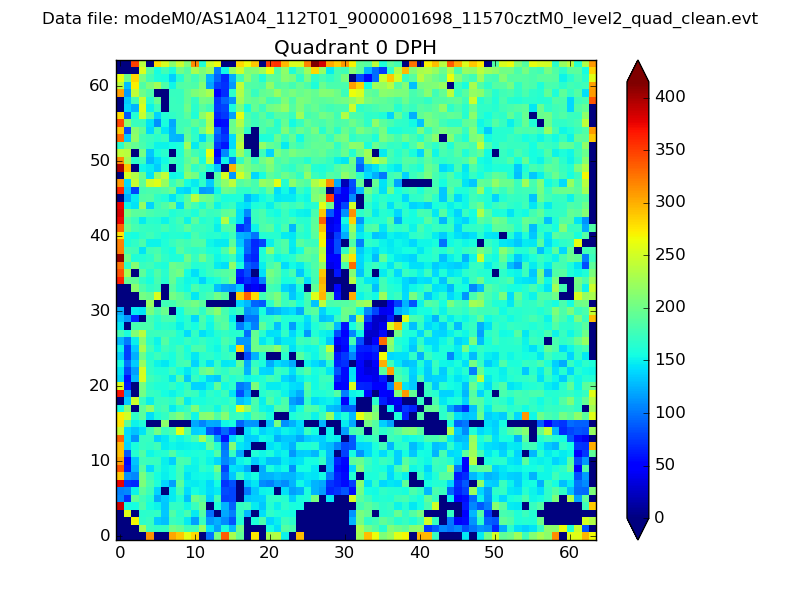 |
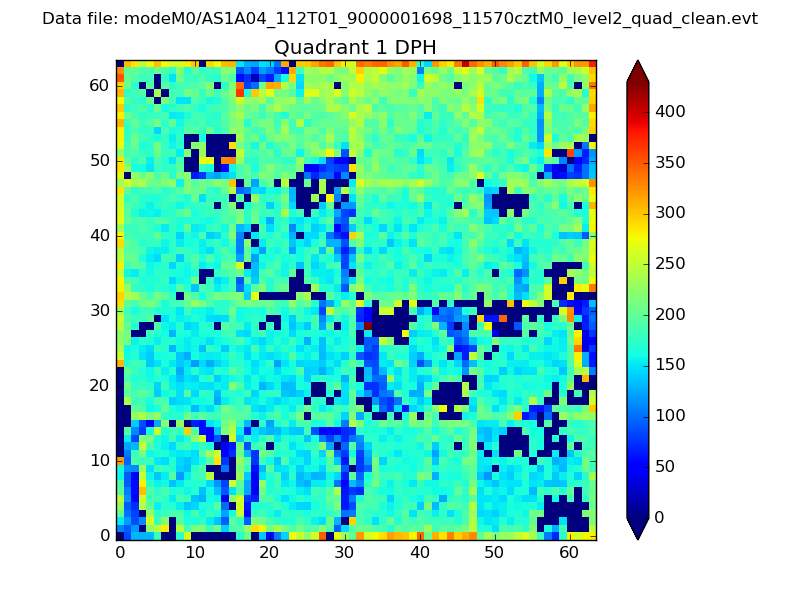 |
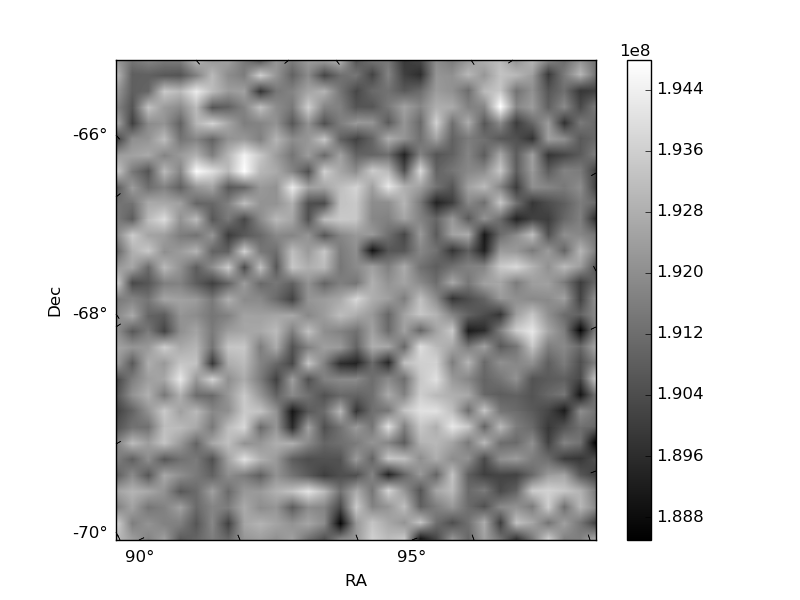
Quadrant B |
|---|---|---|---|
| Quadrant D | 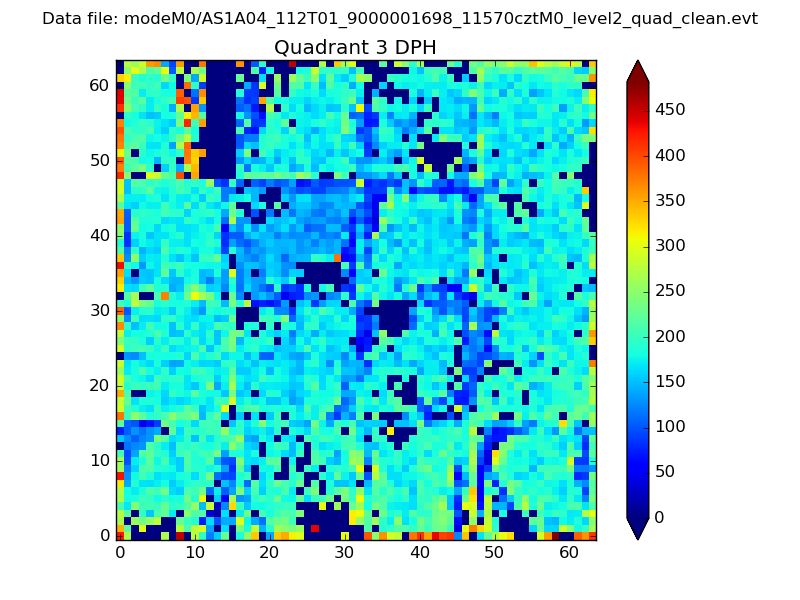 |
 |
Quadrant C |
| Plot type | Count rate plots | Images |
|---|---|---|
| Comparison with Poisson distribution Blue bars denote a histogram of data divided into 1 sec bins. Red curve is a Poisson curve with rate = median count rate of data. |
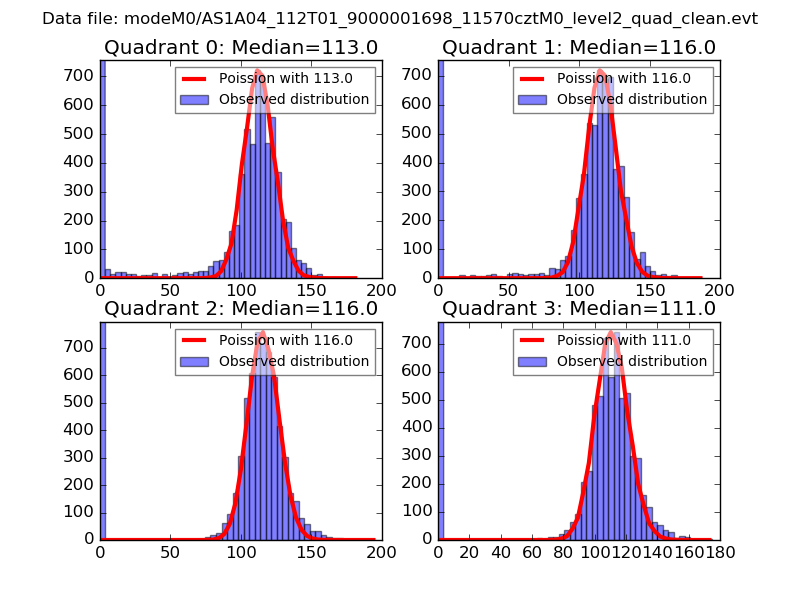 |
 |
| Quadrant-wise count rates Data is divided into 100 sec bins |
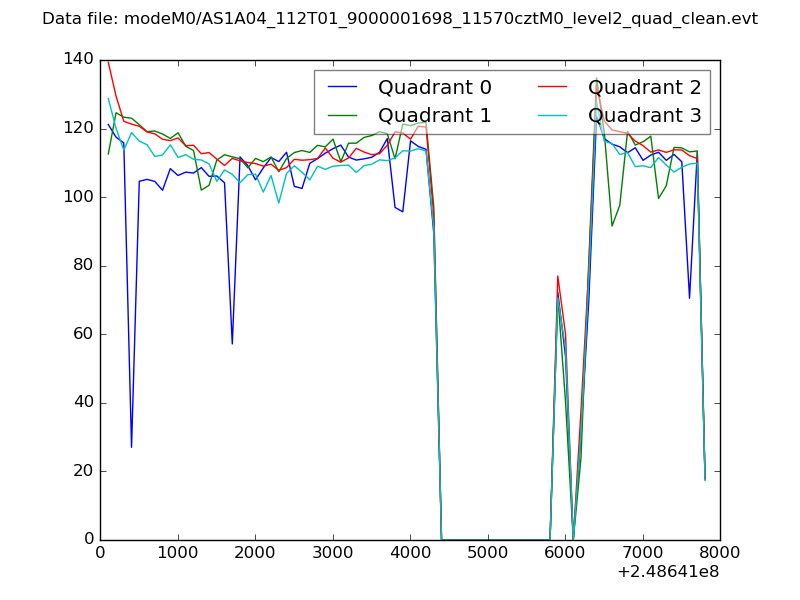 |
|
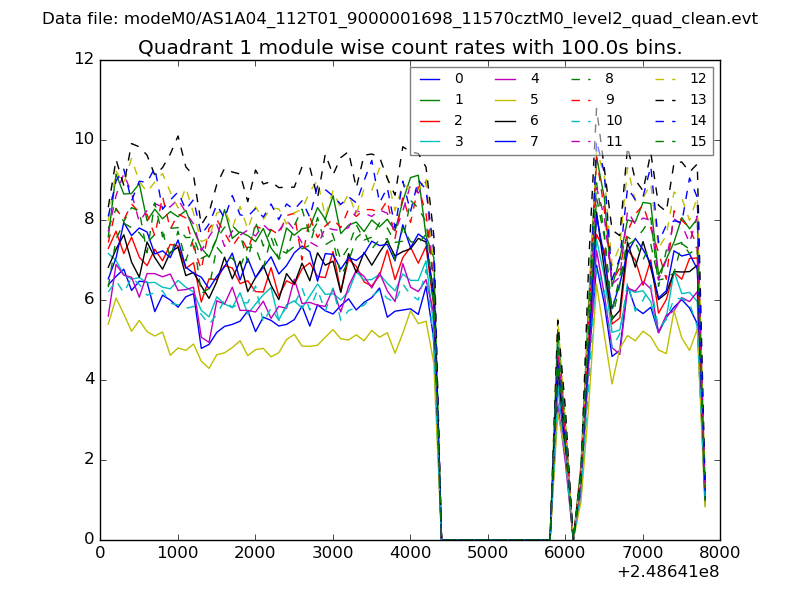
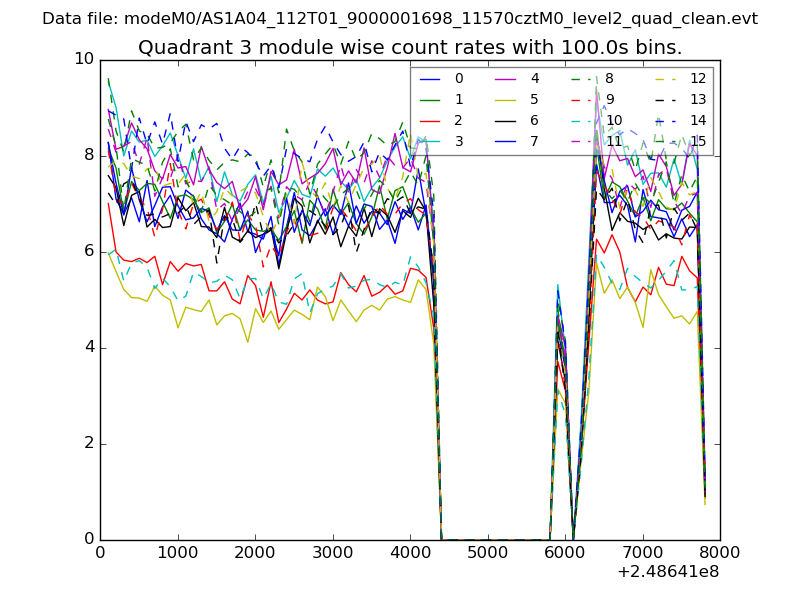
| Module-wise count rates for Quadrant A Data is divided into 100 sec bins |
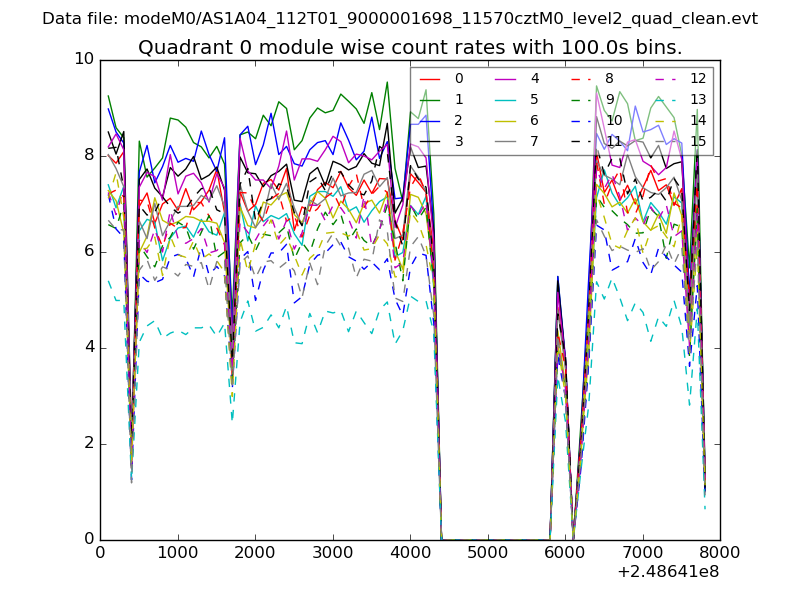 |
 |
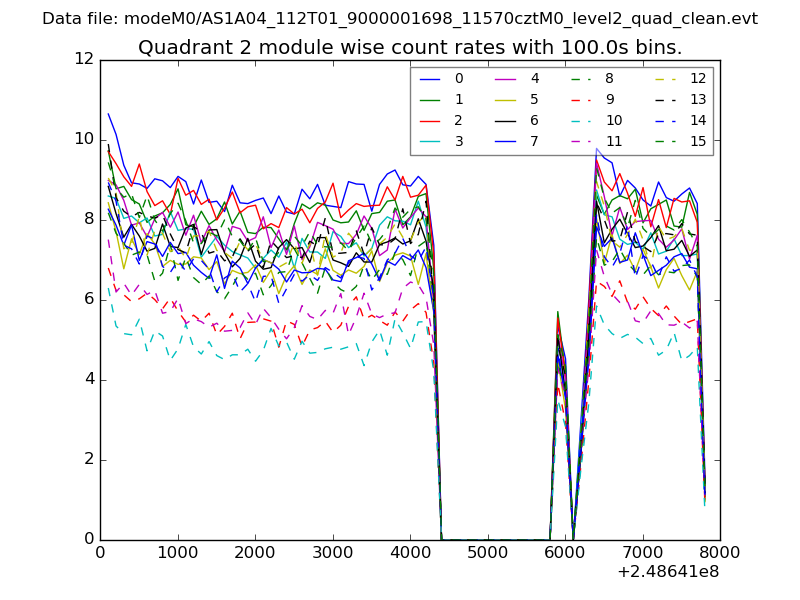
| Module-wise count rates for Quadrant B Data is divided into 100 sec bins |
 |
 |
| Module-wise count rates for Quadrant C Data is divided into 100 sec bins |
 |
 |
| Module-wise count rates for Quadrant D Data is divided into 100 sec bins |
 |
 |
| Parameter | Plot |
|---|---|
| CZT HV Monitor | 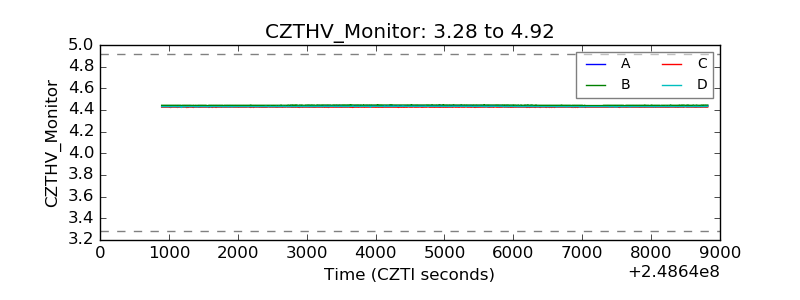 |
| D_VDD | 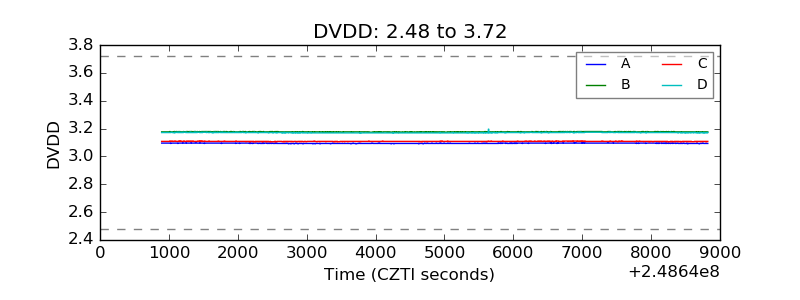 |
| Temperature 1 | 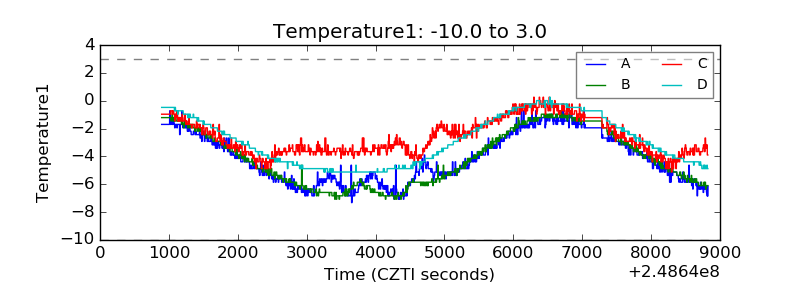 |
| Veto HV Monitor | 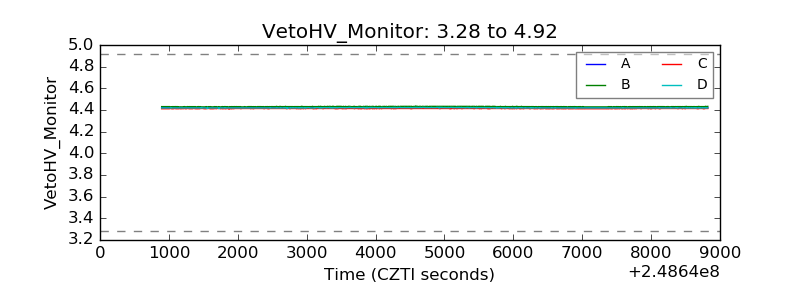 |
| Veto LLD | 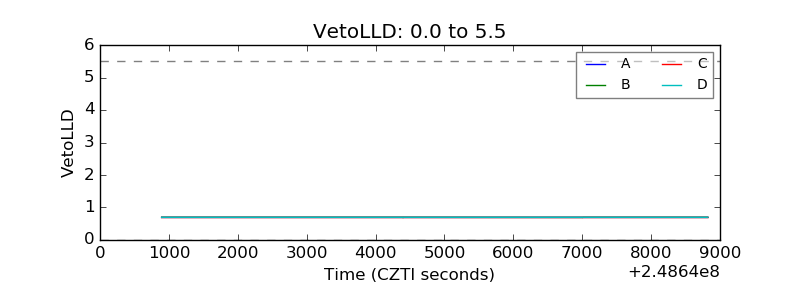 |
| Alpha Counter | 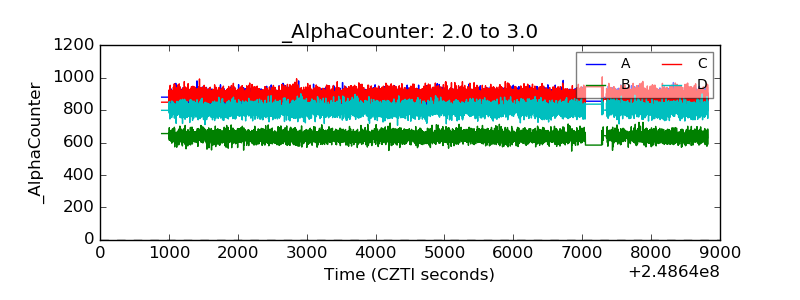 |
| _CPM_Rate | 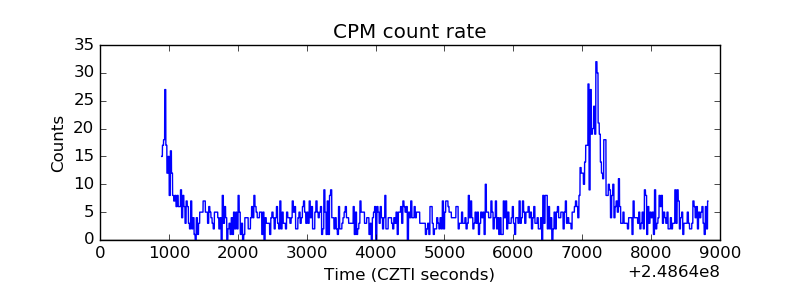 |
| CZT Counter | 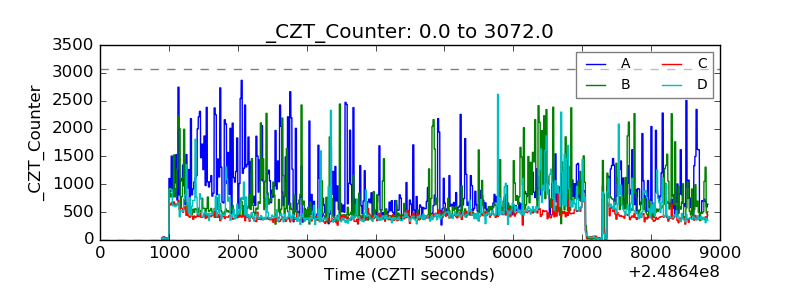 |
| +2.5 Volts monitor | 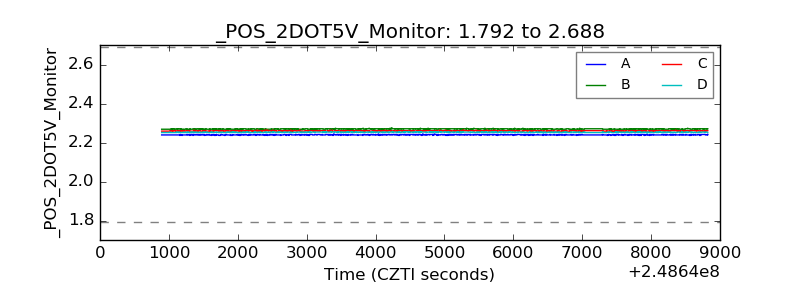 |
| +5 Volts monitor | 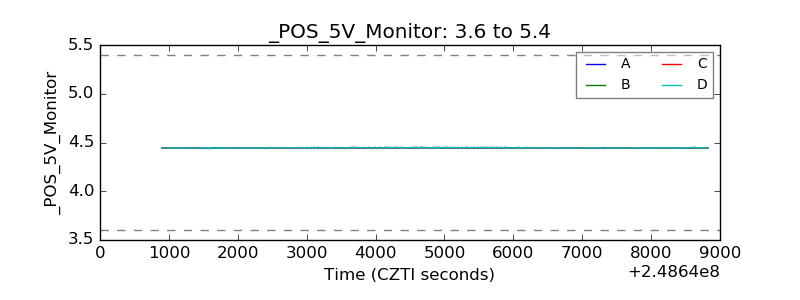 |
| _ROLL_ROT | 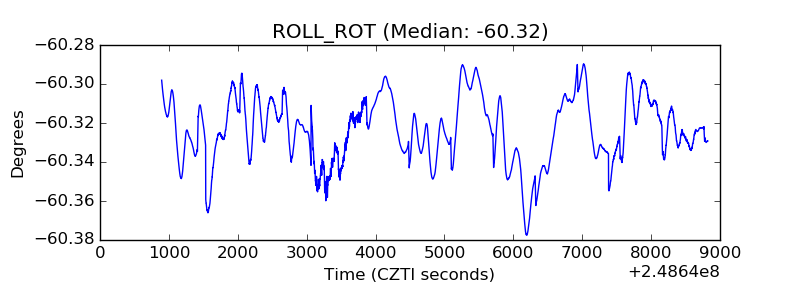 |
| _Roll_DEC | 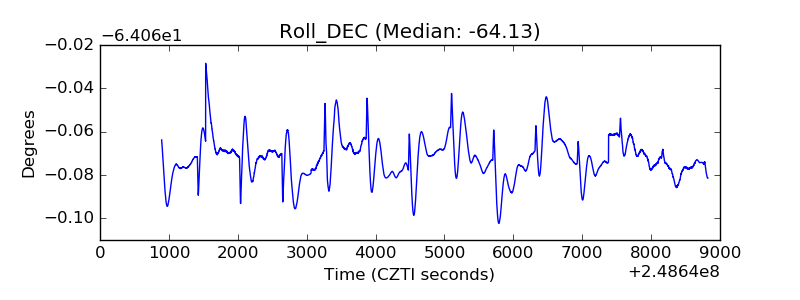 |
| _Roll_RA | 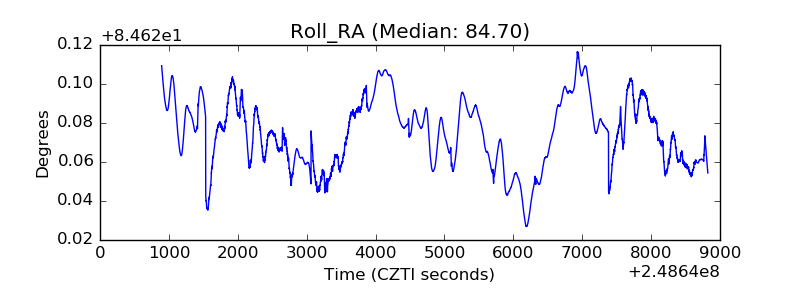 |
| Veto Counter | 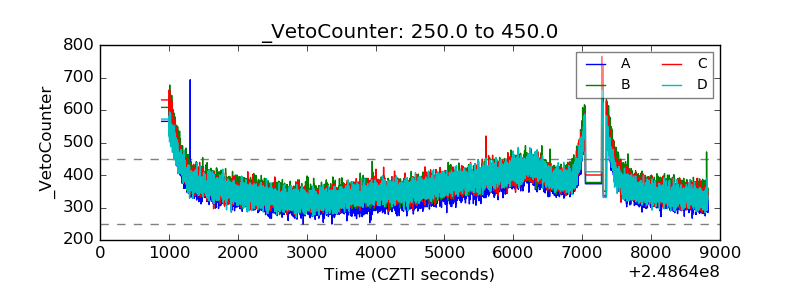 |