| Param | Original file | Final file |
|---|---|---|
| Filename | modeM0/AS1A04_112T01_9000001698_11573cztM0_level2.evt | modeM0/AS1A04_112T01_9000001698_11573cztM0_level2_quad_clean.evt |
| Size (bytes) | 1,431,141,120 | 217,728,000 |
| Size | 1.3 GB | 207.6 MB |
| Events in quadrant A | 13,660,679 | 1,347,970 |
| Events in quadrant B | 12,359,530 | 1,366,771 |
| Events in quadrant C | 7,285,537 | 1,388,508 |
| Events in quadrant D | 8,906,102 | 1,335,370 |
| Mode SS | |||
|---|---|---|---|
| Quadrant | BADHDUFLAG | Total packets | Discarded packets |
| A | 0 | 342 | 0 |
| B | 0 | 342 | 0 |
| C | 0 | 342 | 0 |
| D | 0 | 342 | 0 |
| Mode M0 | |||
|---|---|---|---|
| Quadrant | BADHDUFLAG | Total packets | Discarded packets |
| A | 0 | 52171 | 5 |
| B | 0 | 48455 | 4 |
| C | 0 | 33767 | 4 |
| D | 0 | 38681 | 4 |
| Mode M9 | |||
|---|---|---|---|
| Quadrant | BADHDUFLAG | Total packets | Discarded packets |
| A | 0 | 14 | 0 |
| B | 0 | 14 | 0 |
| C | 0 | 14 | 0 |
| D | 0 | 14 | 0 |
| Quadrant | Total seconds | Saturated seconds | Saturation percentage |
|---|---|---|---|
| A | 16748 | 1373 | 8.197994% |
| B | 16748 | 1579 | 9.427991% |
| C | 16748 | 47 | 0.280631% |
| D | 16748 | 308 | 1.839026% |
Noise dominated data is calculated using 1-second bins in cleaned event files. If a bin has >2000 counts, and if more than 50% of those come from <1% of pixels, then it is considered to be noise-dominated and hence unusable.
| Quadrant | # 1 sec bins | Bins with >0 counts | Bins with >2000 counts | High rate bins dominated by noise | Noise dominated (total time) | Noise dominated (detector-on time) | Marked lightcurve |
|---|---|---|---|---|---|---|---|
| A | 18199 | 16753 | 767 | 767 | 4.21% | 4.58% | 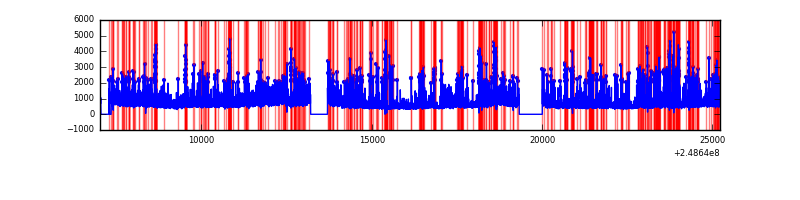 |
| B | 18199 | 16753 | 908 | 908 | 4.99% | 5.42% | 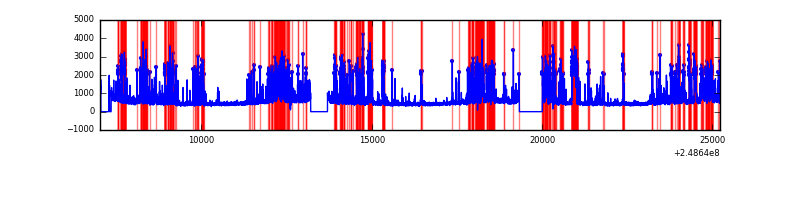 |
| C | 18199 | 16753 | 0 | 0 | 0.00% | 0.00% |  |
| D | 18199 | 16753 | 177 | 177 | 0.97% | 1.06% | 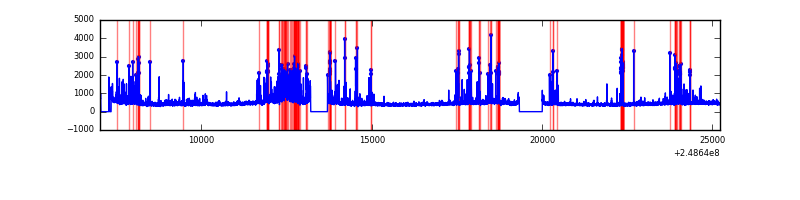 |
Top three noisy pixels from each quadrant. If the there are fewer than three noisy pixels in the level2.evt file, extra rows are filled as -1
| Pixel properties | Quadrant properties | ||||||
|---|---|---|---|---|---|---|---|
| Quadrant | DetID | PixID | Counts | Sigma | Mean | Median | Sigma |
| A | 8 | 5 | 5818743 | 15746.12 | 1833 | 1791 | 369.4 |
| A | 1 | 162 | 247405 | 664.86 | 1833 | 1791 | 369.4 |
| A | 1 | 178 | 139572 | 372.96 | 1833 | 1791 | 369.4 |
| B | 4 | 239 | 3217957 | 9076.88 | 1850 | 1800 | 354.3 |
| B | 3 | 64 | 909474 | 2561.7 | 1850 | 1800 | 354.3 |
| B | 15 | 255 | 444344 | 1248.98 | 1850 | 1800 | 354.3 |
| C | 13 | 61 | 13921 | 27.98 | 1861 | 1866 | 430.9 |
| C | 8 | 128 | 12163 | 23.9 | 1861 | 1866 | 430.9 |
| C | 9 | 54 | 7836 | 13.86 | 1861 | 1866 | 430.9 |
| D | 5 | 222 | 463479 | 1054.19 | 1841 | 1786 | 438.0 |
| D | 10 | 253 | 395614 | 899.23 | 1841 | 1786 | 438.0 |
| D | 2 | 120 | 371714 | 844.66 | 1841 | 1786 | 438.0 |
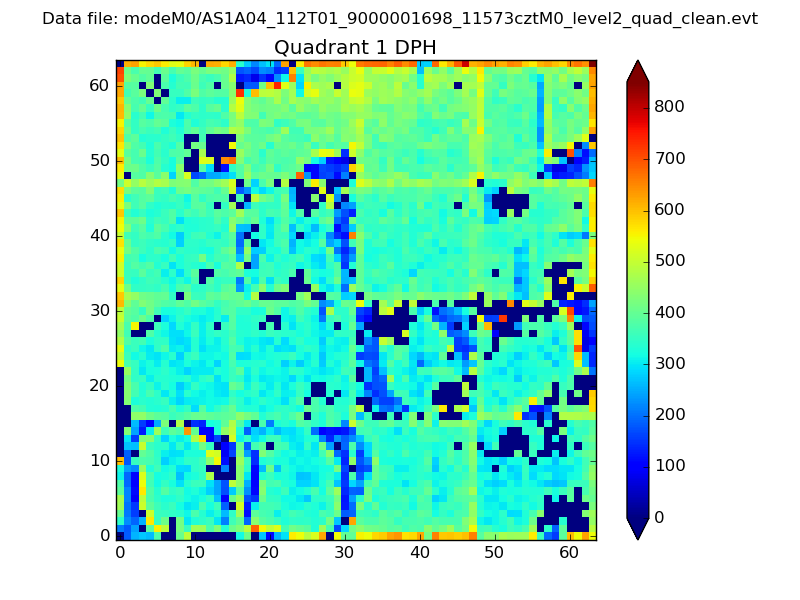
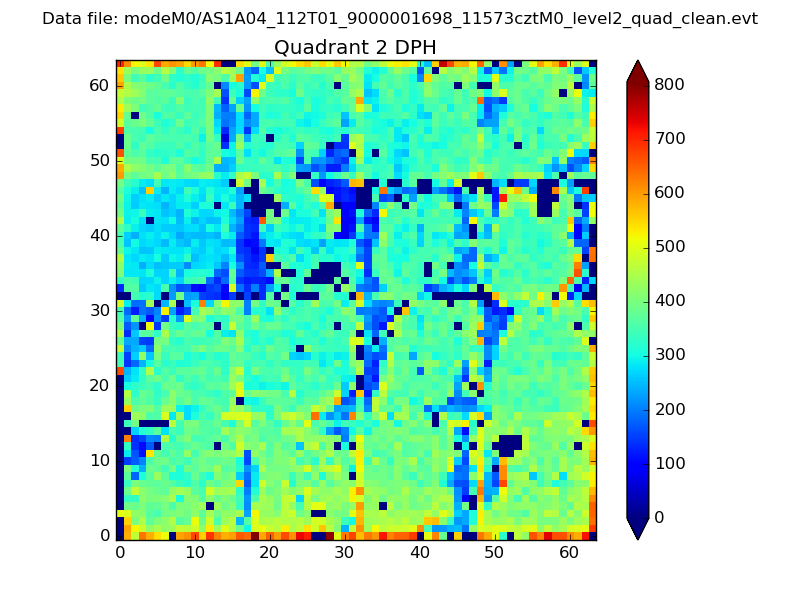
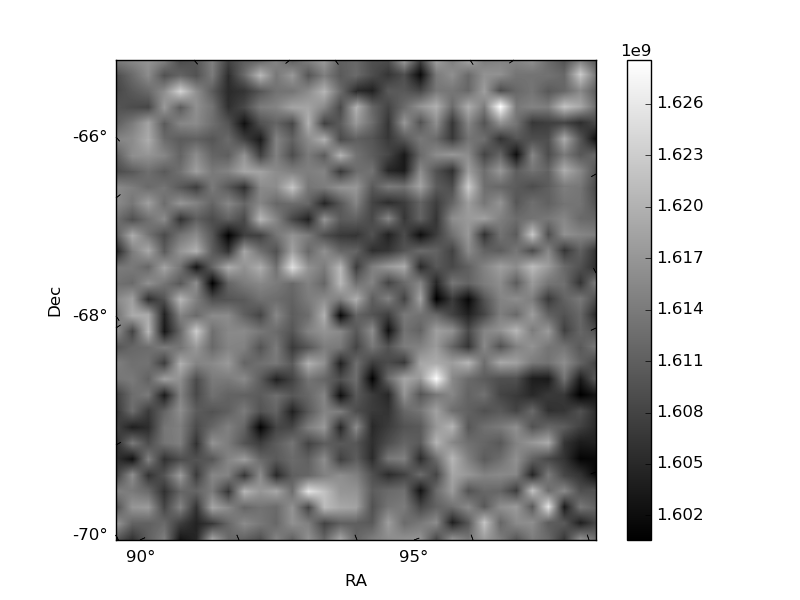
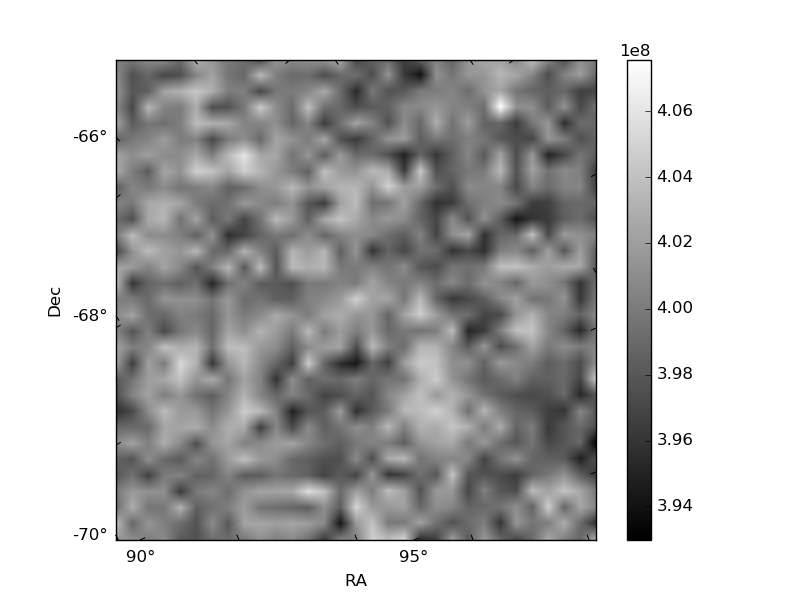
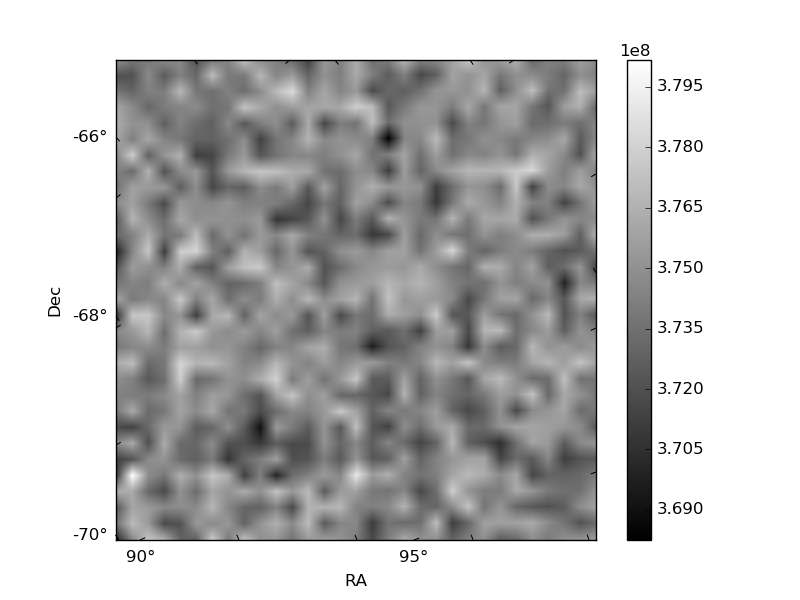
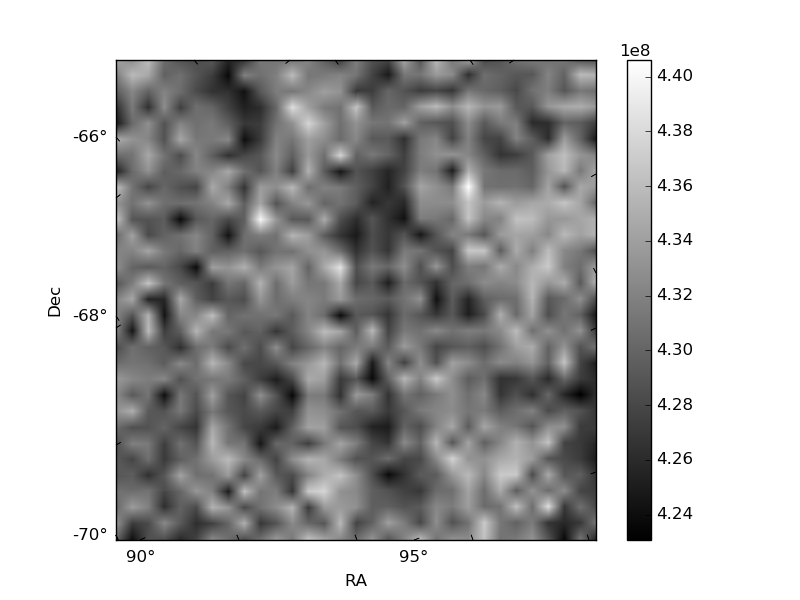
Histogram calculated using DETX and DETY for each event in the final _common_clean file
| Quadrant A | 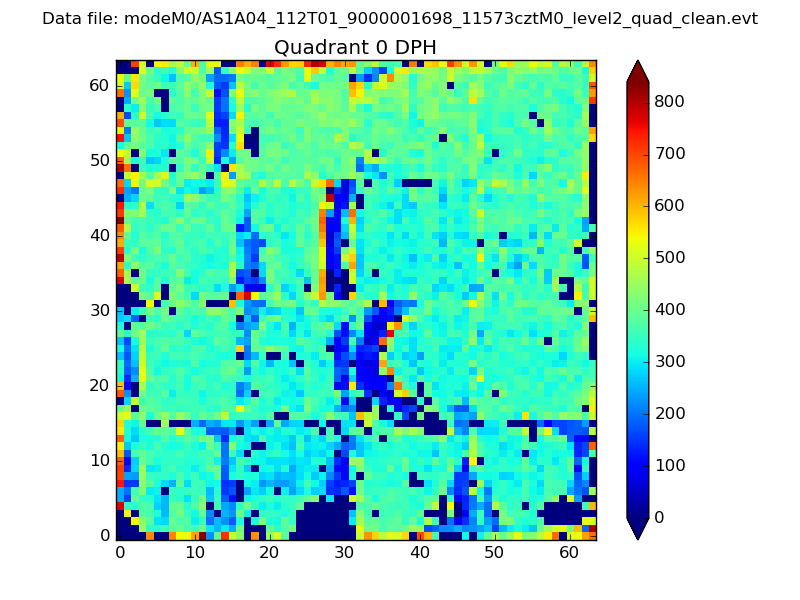 |
 |
Quadrant B |
|---|---|---|---|
| Quadrant D | 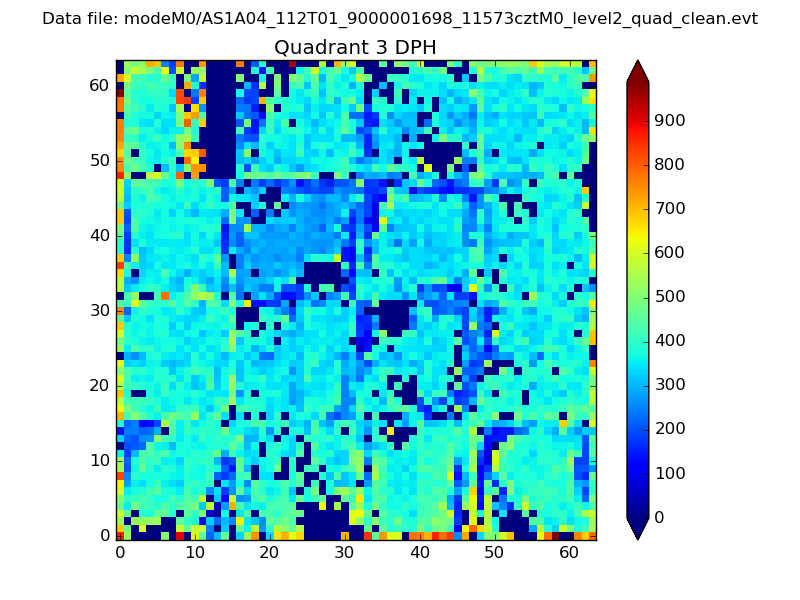 |
 |
Quadrant C |
| Plot type | Count rate plots | Images |
|---|---|---|
| Comparison with Poisson distribution Blue bars denote a histogram of data divided into 1 sec bins. Red curve is a Poisson curve with rate = median count rate of data. |
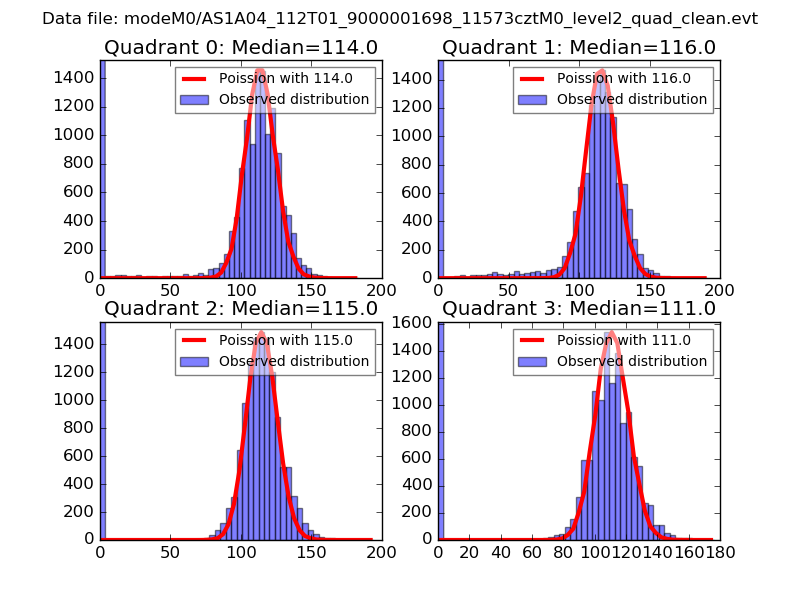 |
 |
| Quadrant-wise count rates Data is divided into 100 sec bins |
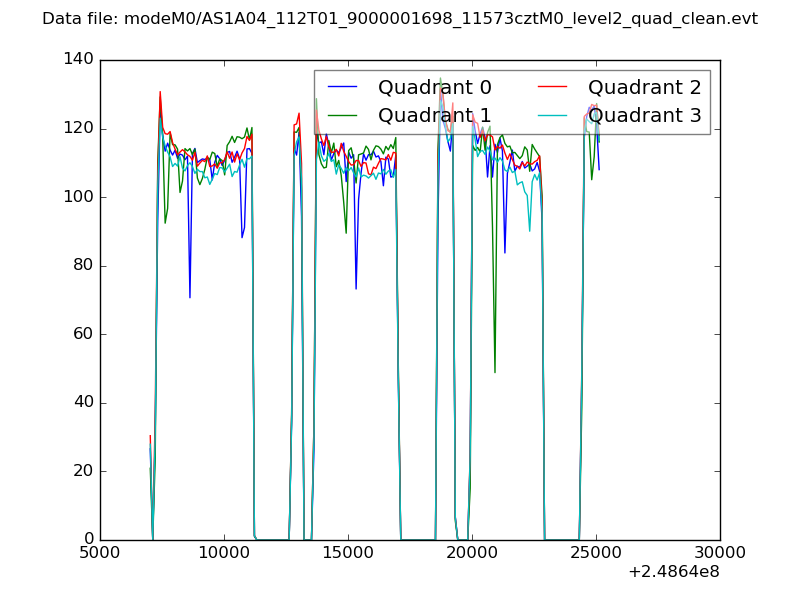 |
|
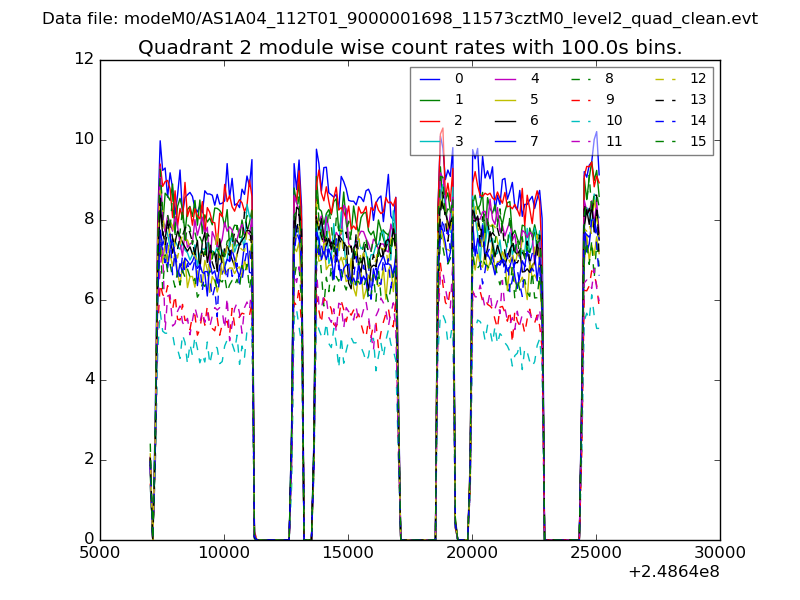
| Module-wise count rates for Quadrant A Data is divided into 100 sec bins |
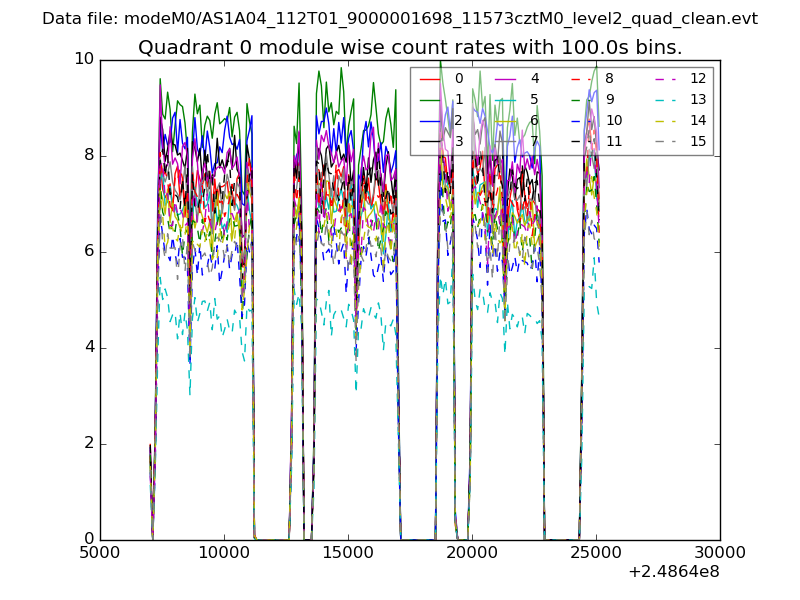 |
 |
| Module-wise count rates for Quadrant B Data is divided into 100 sec bins |
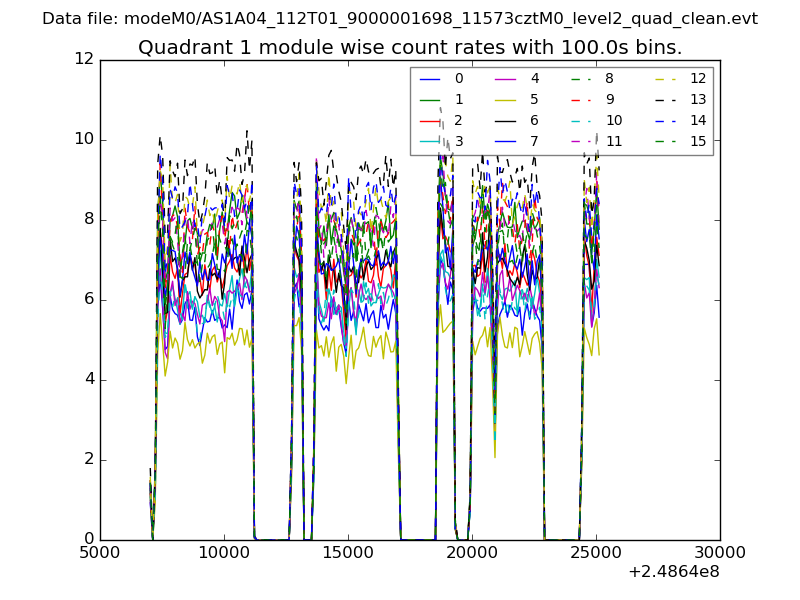 |
 |
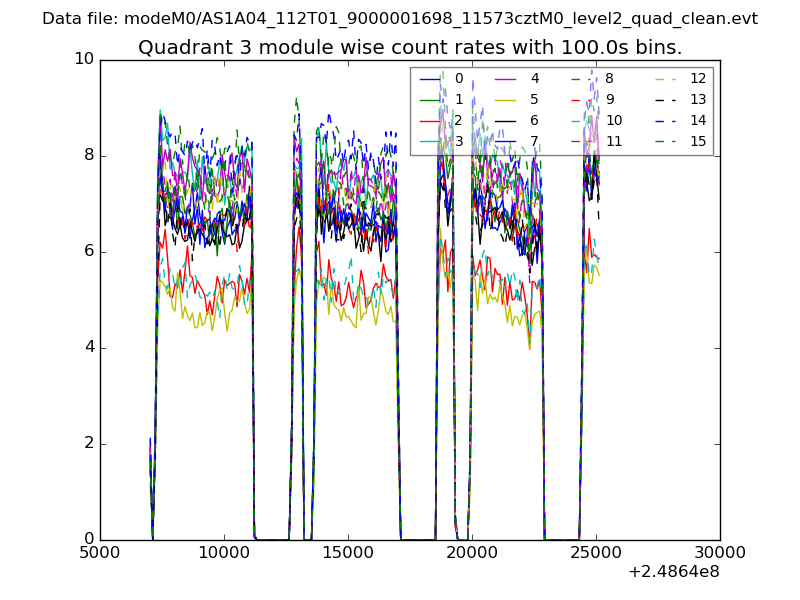
| Module-wise count rates for Quadrant C Data is divided into 100 sec bins |
 |
 |
| Module-wise count rates for Quadrant D Data is divided into 100 sec bins |
 |
 |
| Parameter | Plot |
|---|---|
| CZT HV Monitor | 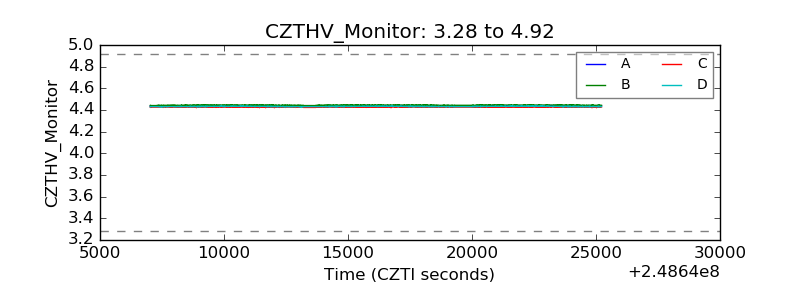 |
| D_VDD |  |
| Temperature 1 | 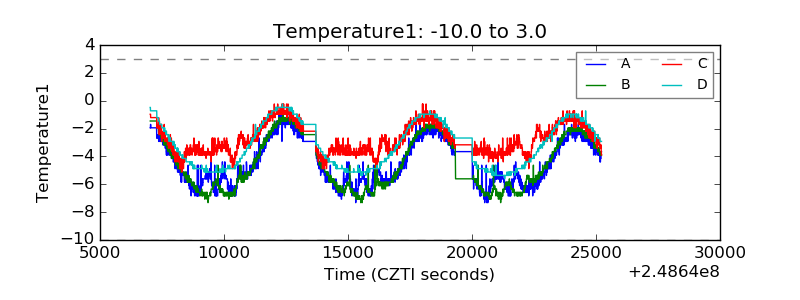 |
| Veto HV Monitor | 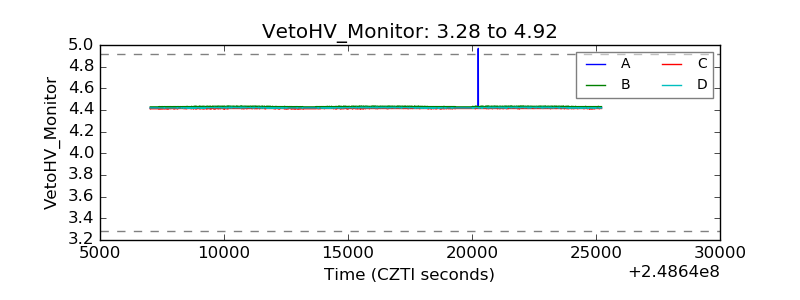 |
| Veto LLD | 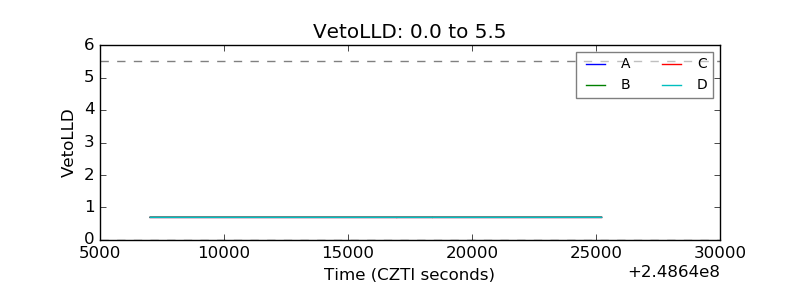 |
| Alpha Counter |  |
| _CPM_Rate |  |
| CZT Counter | 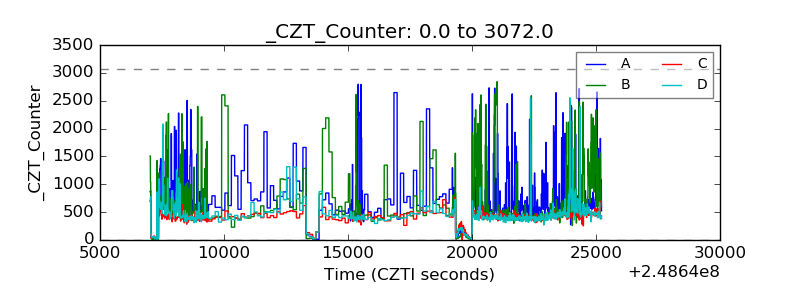 |
| +2.5 Volts monitor |  |
| +5 Volts monitor |  |
| _ROLL_ROT | 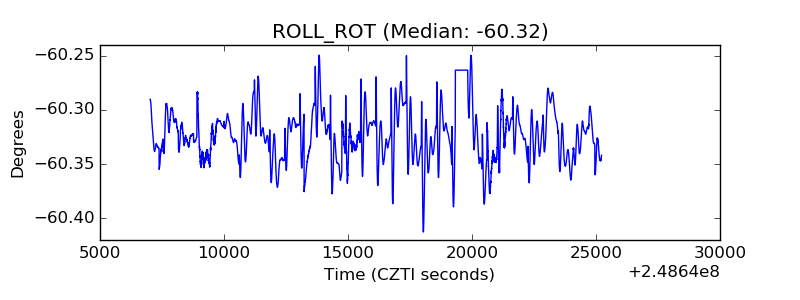 |
| _Roll_DEC | 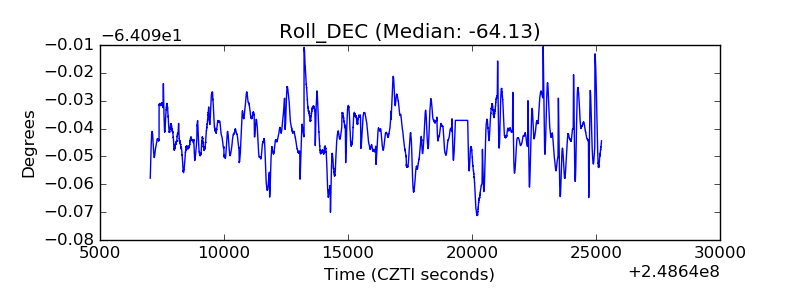 |
| _Roll_RA | 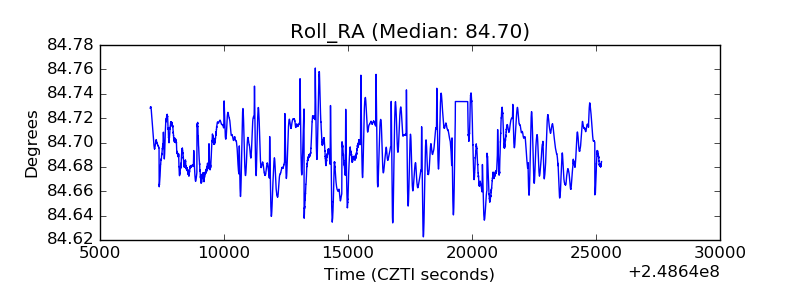 |
| Veto Counter | 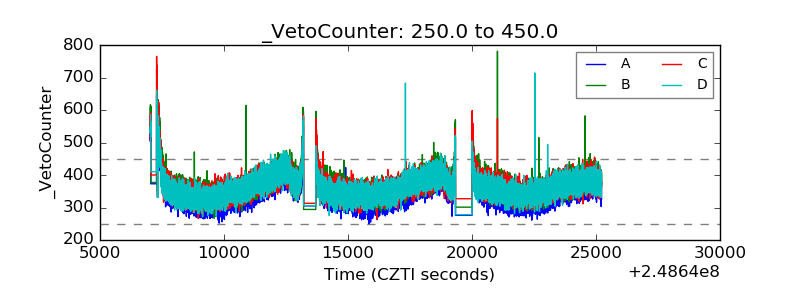 |