| Param | Original file | Final file |
|---|---|---|
| Filename | modeM0/AS1A04_137T01_9000001700cztM0_level2.fits | modeM0/AS1A04_137T01_9000001700cztM0_level2_quad_clean.evt |
| Size (bytes) | 403,712,640 | 380,177,280 |
| Size | 385.0 MB | 362.6 MB |
| Events in quadrant A | 2,448,586 | 2,238,145 |
| Events in quadrant B | 2,335,426 | 2,093,117 |
| Events in quadrant C | 2,461,944 | 2,308,343 |
| Events in quadrant D | 2,115,286 | 2,011,187 |
| Mode M0 | |||
|---|---|---|---|
| Quadrant | BADHDUFLAG | Total packets | Discarded packets |
| A | 0 | 127705 | 0 |
| B | 0 | 126663 | 0 |
| C | 0 | 86250 | 0 |
| D | 0 | 109185 | 0 |
| Mode SS | |||
|---|---|---|---|
| Quadrant | BADHDUFLAG | Total packets | Discarded packets |
| A | 0 | 850 | 0 |
| B | 0 | 850 | 0 |
| C | 0 | 850 | 0 |
| D | 0 | 850 | 0 |
| Mode M9 | |||
|---|---|---|---|
| Quadrant | BADHDUFLAG | Total packets | Discarded packets |
| A | 0 | 86 | 0 |
| B | 0 | 86 | 0 |
| C | 0 | 86 | 0 |
| D | 0 | 86 | 0 |
| Quadrant | Total seconds | Saturated seconds | Saturation percentage |
|---|---|---|---|
| A | 41682 | 3133 | 7.516434% |
| B | 41682 | 4290 | 10.292212% |
| C | 41682 | 399 | 0.957248% |
| D | 41682 | 2206 | 5.292452% |
Noise dominated data is calculated using 1-second bins in cleaned event files. If a bin has >2000 counts, and if more than 50% of those come from <1% of pixels, then it is considered to be noise-dominated and hence unusable.
| Quadrant | # 1 sec bins | Bins with >0 counts | Bins with >2000 counts | High rate bins dominated by noise | Noise dominated (total time) | Noise dominated (detector-on time) | Marked lightcurve |
|---|---|---|---|---|---|---|---|
| A | 50307 | 41640 | 0 | 0 | 0.00% | 0.00% | 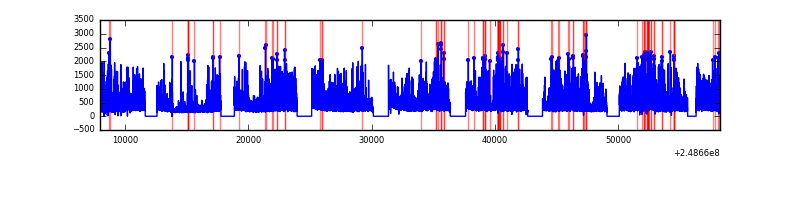 |
| B | 50307 | 41645 | 0 | 0 | 0.00% | 0.00% |  |
| C | 50307 | 41682 | 0 | 0 | 0.00% | 0.00% |  |
| D | 50307 | 41665 | 0 | 0 | 0.00% | 0.00% | 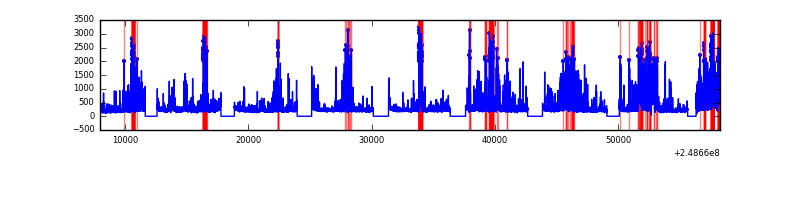 |
Top three noisy pixels from each quadrant. If the there are fewer than three noisy pixels in the level2.evt file, extra rows are filled as -1
| Pixel properties | Quadrant properties | ||||||
|---|---|---|---|---|---|---|---|
| Quadrant | DetID | PixID | Counts | Sigma | Mean | Median | Sigma |
| A | 0 | 29 | 2330 | 10.88 | 638 | 598 | 159.2 |
| A | 7 | 110 | 1965 | 8.58 | 638 | 598 | 159.2 |
| A | 9 | 19 | 1809 | 7.6 | 638 | 598 | 159.2 |
| B | 2 | 9 | 2033 | 11.61 | 617 | 589 | 124.3 |
| B | 2 | 8 | 1574 | 7.92 | 617 | 589 | 124.3 |
| B | 5 | 225 | 1509 | 7.4 | 617 | 589 | 124.3 |
| C | 9 | 242 | 1658 | 6.3 | 649 | 605 | 167.3 |
| C | 12 | 241 | 1648 | 6.24 | 649 | 605 | 167.3 |
| C | 2 | 191 | 1624 | 6.09 | 649 | 605 | 167.3 |
| D | 6 | 231 | 1540 | 6.08 | 603 | 547 | 163.2 |
| D | 3 | 31 | 1533 | 6.04 | 603 | 547 | 163.2 |
| D | 6 | 38 | 1514 | 5.92 | 603 | 547 | 163.2 |
Histogram calculated using DETX and DETY for each event in the final _common_clean file
| Quadrant A | 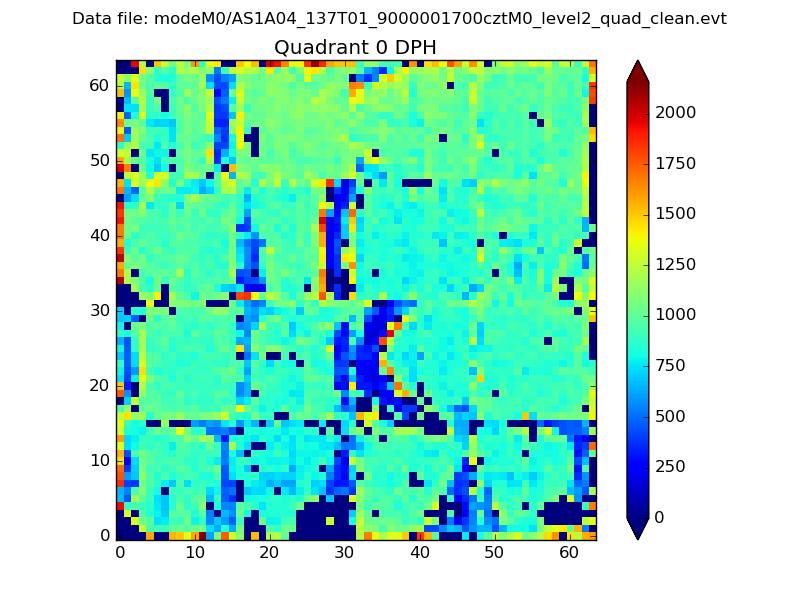 |
 |
Quadrant B |
|---|---|---|---|
| Quadrant D |  |
 |
Quadrant C |
| Plot type | Count rate plots | Images |
|---|---|---|
| Comparison with Poisson distribution Blue bars denote a histogram of data divided into 1 sec bins. Red curve is a Poisson curve with rate = median count rate of data. |
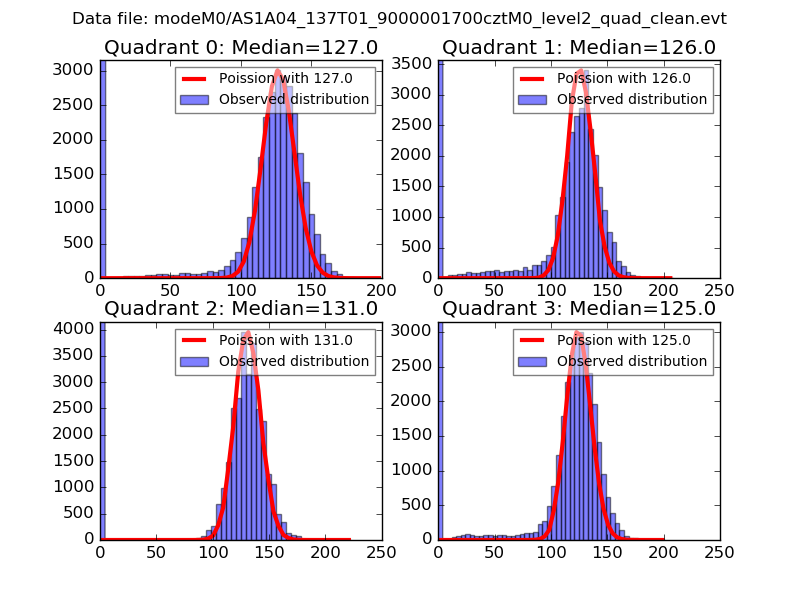 |
 |
| Quadrant-wise count rates Data is divided into 100 sec bins |
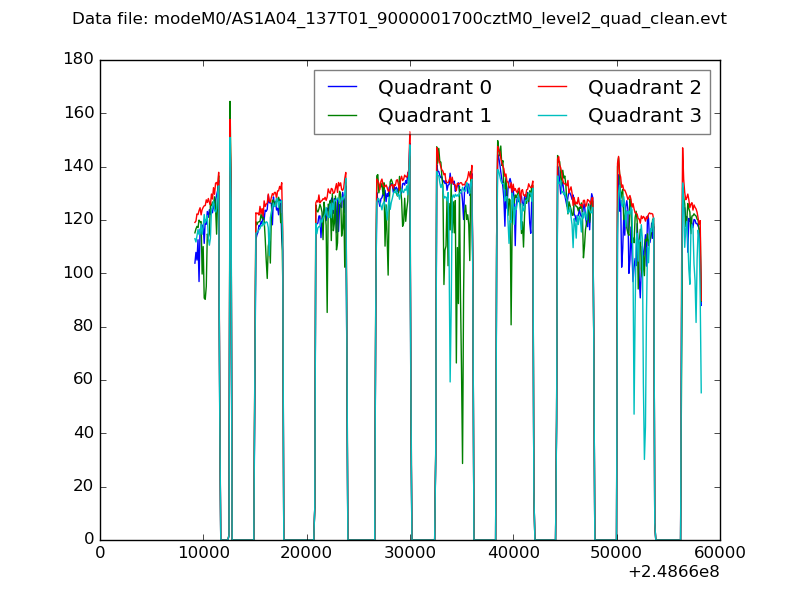 |
|
| Module-wise count rates for Quadrant A Data is divided into 100 sec bins |
 |
 |
| Module-wise count rates for Quadrant B Data is divided into 100 sec bins |
 |
 |
| Module-wise count rates for Quadrant C Data is divided into 100 sec bins |
 |
 |
| Module-wise count rates for Quadrant D Data is divided into 100 sec bins |
 |
 |
| Parameter | Plot |
|---|---|
| CZT HV Monitor |  |
| D_VDD | 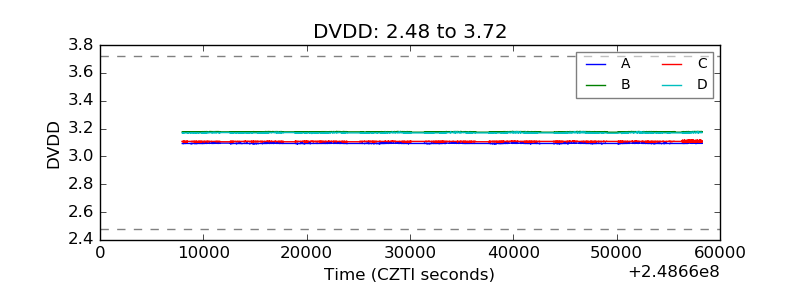 |
| Temperature 1 |  |
| Veto HV Monitor |  |
| Veto LLD | 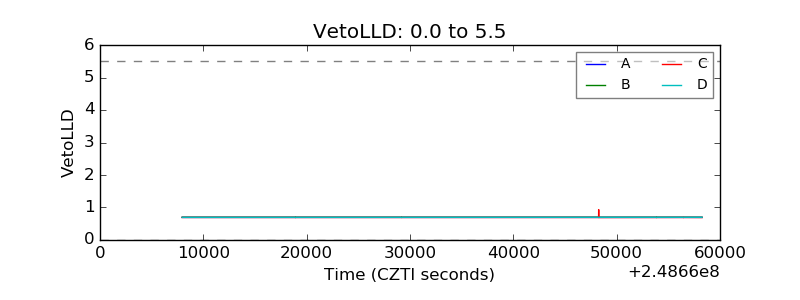 |
| Alpha Counter | 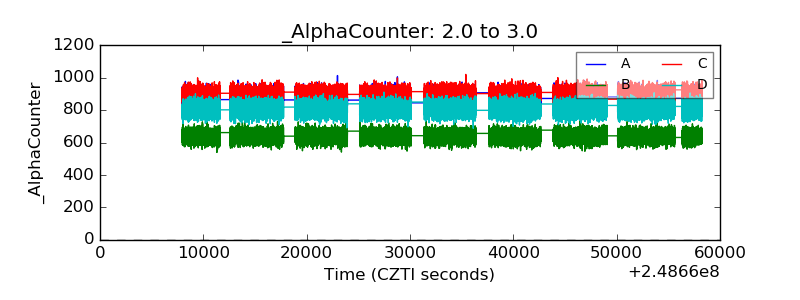 |
| _CPM_Rate |  |
| CZT Counter | 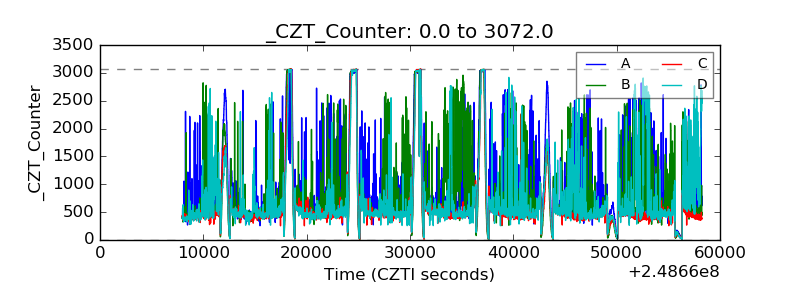 |
| +2.5 Volts monitor |  |
| +5 Volts monitor | 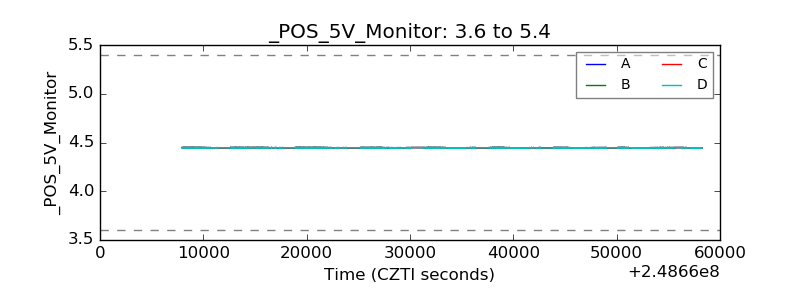 |
| _ROLL_ROT |  |
| _Roll_DEC |  |
| _Roll_RA | 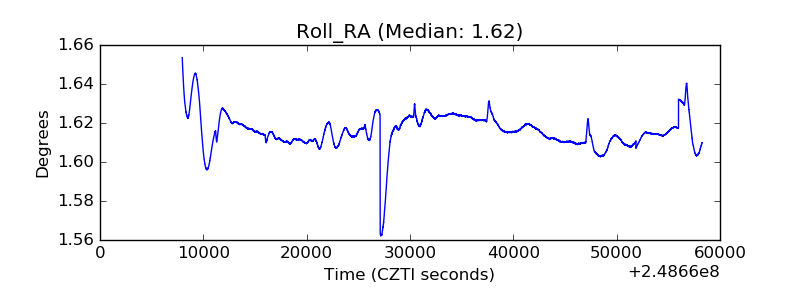 |
| Veto Counter |  |