| Param | Original file | Final file |
|---|---|---|
| Filename | modeM0/AS1A04_137T01_9000001700_11574cztM0_level2.evt | modeM0/AS1A04_137T01_9000001700_11574cztM0_level2_quad_clean.evt |
| Size (bytes) | 430,433,280 | 54,411,840 |
| Size | 410.5 MB | 51.9 MB |
| Events in quadrant A | 3,860,352 | 318,914 |
| Events in quadrant B | 3,463,131 | 314,943 |
| Events in quadrant C | 2,285,975 | 340,444 |
| Events in quadrant D | 3,084,538 | 320,201 |
| Mode M0 | |||
|---|---|---|---|
| Quadrant | BADHDUFLAG | Total packets | Discarded packets |
| A | 0 | 14916 | 2 |
| B | 0 | 13573 | 1 |
| C | 0 | 10203 | 1 |
| D | 0 | 12659 | 1 |
| Mode SS | |||
|---|---|---|---|
| Quadrant | BADHDUFLAG | Total packets | Discarded packets |
| A | 0 | 104 | 0 |
| B | 0 | 104 | 0 |
| C | 0 | 104 | 0 |
| D | 0 | 104 | 0 |
| Mode M9 | |||
|---|---|---|---|
| Quadrant | BADHDUFLAG | Total packets | Discarded packets |
| A | 0 | 9 | 0 |
| B | 0 | 9 | 0 |
| C | 0 | 9 | 0 |
| D | 0 | 9 | 0 |
| Quadrant | Total seconds | Saturated seconds | Saturation percentage |
|---|---|---|---|
| A | 5025 | 301 | 5.990050% |
| B | 5025 | 355 | 7.064677% |
| C | 5025 | 20 | 0.398010% |
| D | 5025 | 113 | 2.248756% |
Noise dominated data is calculated using 1-second bins in cleaned event files. If a bin has >2000 counts, and if more than 50% of those come from <1% of pixels, then it is considered to be noise-dominated and hence unusable.
| Quadrant | # 1 sec bins | Bins with >0 counts | Bins with >2000 counts | High rate bins dominated by noise | Noise dominated (total time) | Noise dominated (detector-on time) | Marked lightcurve |
|---|---|---|---|---|---|---|---|
| A | 5986 | 5027 | 146 | 146 | 2.44% | 2.90% | 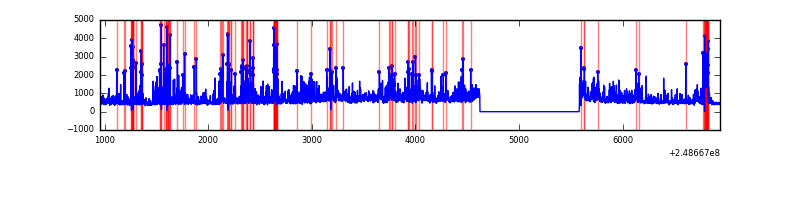 |
| B | 5986 | 5027 | 219 | 219 | 3.66% | 4.36% | 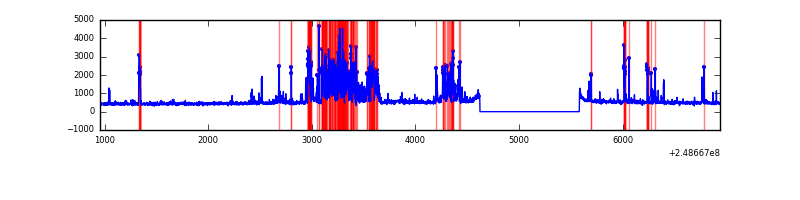 |
| C | 5986 | 5027 | 0 | 0 | 0.00% | 0.00% | 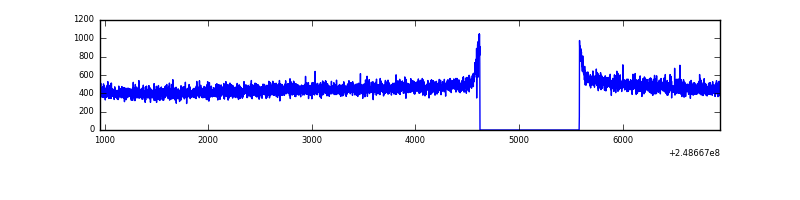 |
| D | 5986 | 5027 | 88 | 88 | 1.47% | 1.75% | 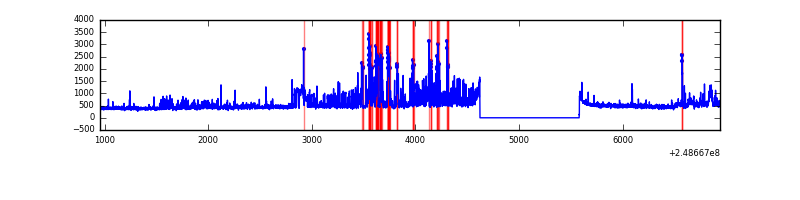 |
Top three noisy pixels from each quadrant. If the there are fewer than three noisy pixels in the level2.evt file, extra rows are filled as -1
| Pixel properties | Quadrant properties | ||||||
|---|---|---|---|---|---|---|---|
| Quadrant | DetID | PixID | Counts | Sigma | Mean | Median | Sigma |
| A | 8 | 5 | 1345788 | 11174.41 | 584 | 572 | 120.4 |
| A | 1 | 162 | 76561 | 631.22 | 584 | 572 | 120.4 |
| A | 1 | 178 | 48885 | 401.33 | 584 | 572 | 120.4 |
| B | 3 | 64 | 396291 | 3486.59 | 588 | 574 | 113.5 |
| B | 4 | 239 | 391406 | 3443.55 | 588 | 574 | 113.5 |
| B | 15 | 255 | 296949 | 2611.31 | 588 | 574 | 113.5 |
| C | 13 | 61 | 4248 | 26.73 | 586 | 590 | 136.8 |
| C | 12 | 4 | 1859 | 9.27 | 586 | 590 | 136.8 |
| C | 7 | 247 | 1336 | 5.45 | 586 | 590 | 136.8 |
| D | 13 | 152 | 437374 | 3140.06 | 579 | 562 | 139.1 |
| D | 10 | 253 | 331642 | 2379.99 | 579 | 562 | 139.1 |
| D | 2 | 120 | 42257 | 299.73 | 579 | 562 | 139.1 |
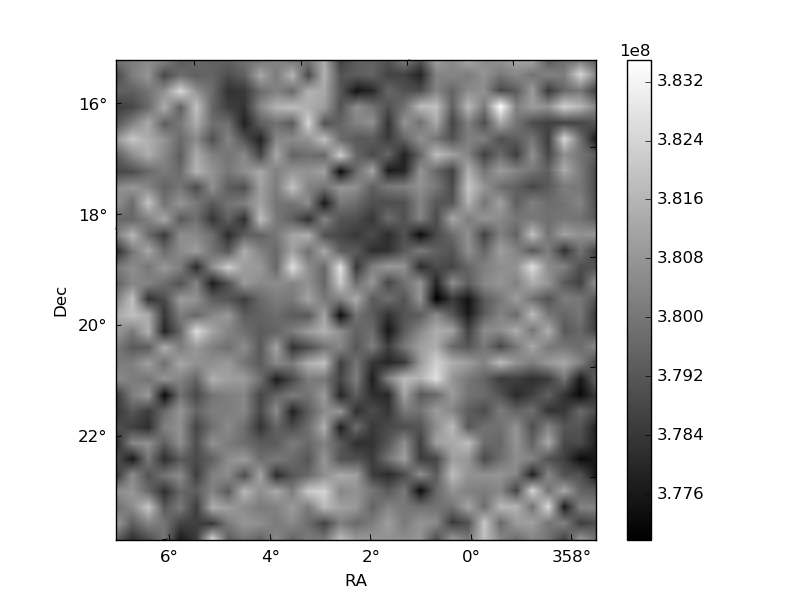
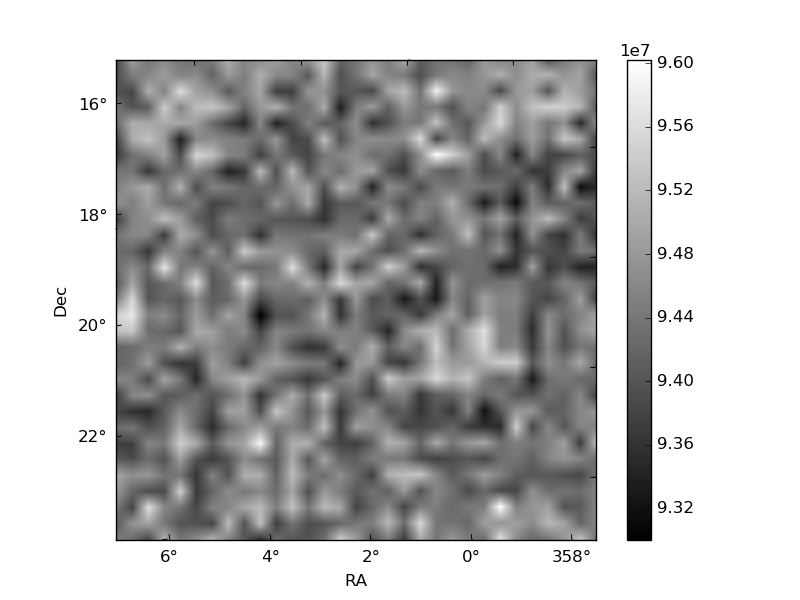
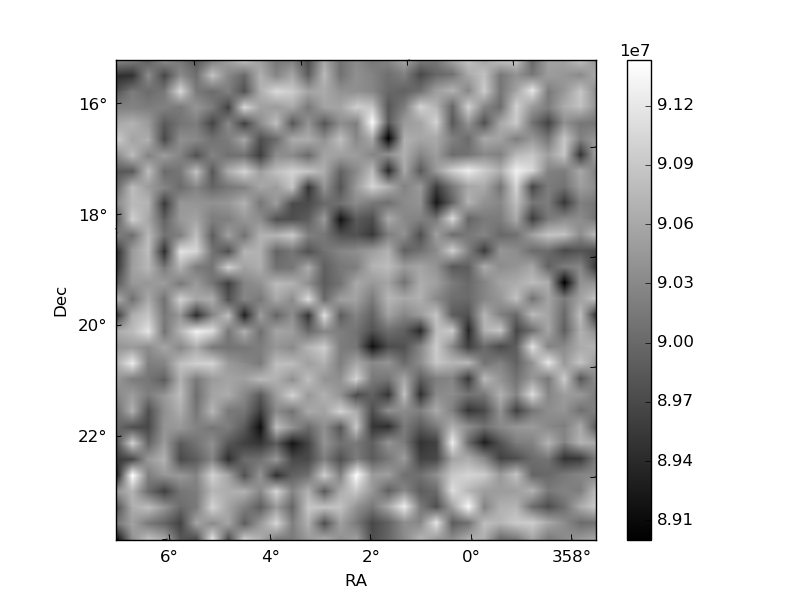
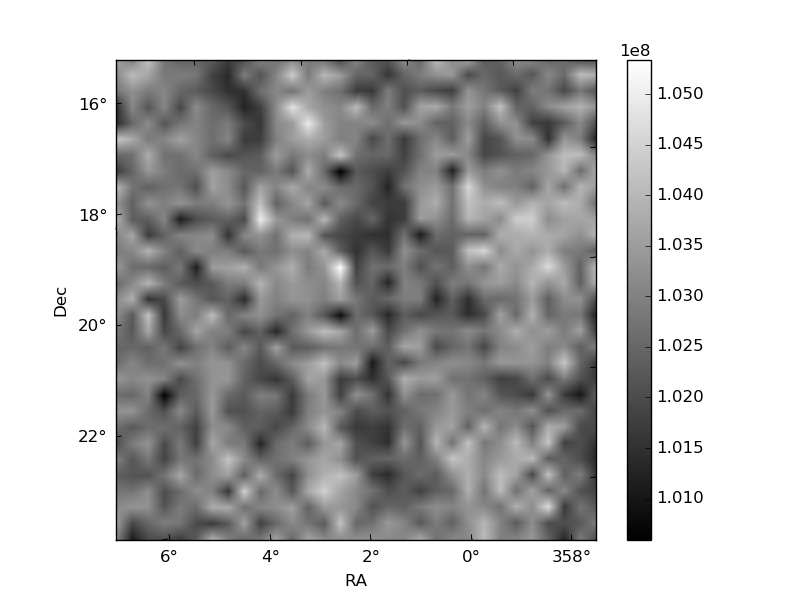
Histogram calculated using DETX and DETY for each event in the final _common_clean file
| Quadrant A | 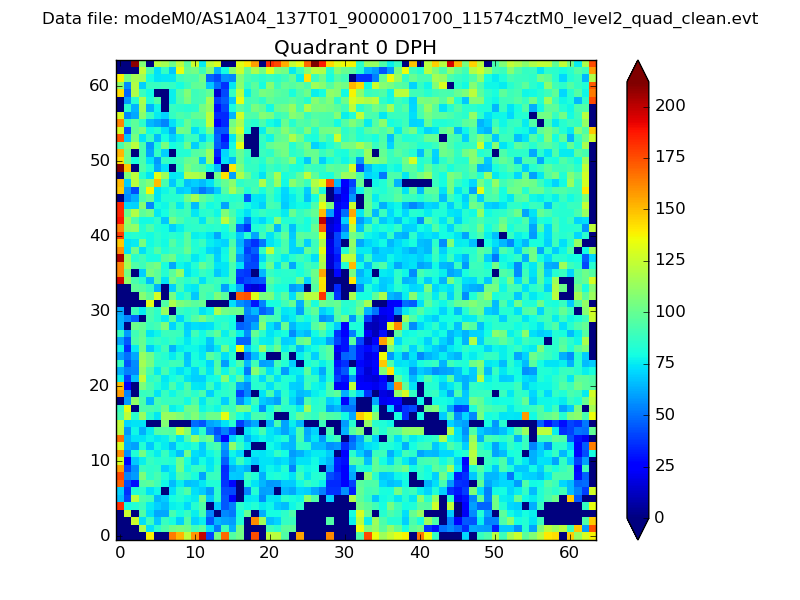 |
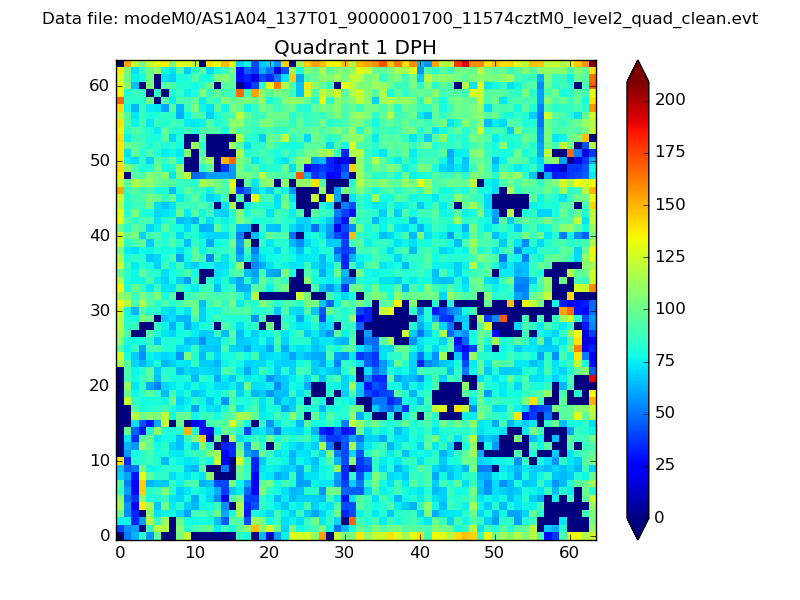 |
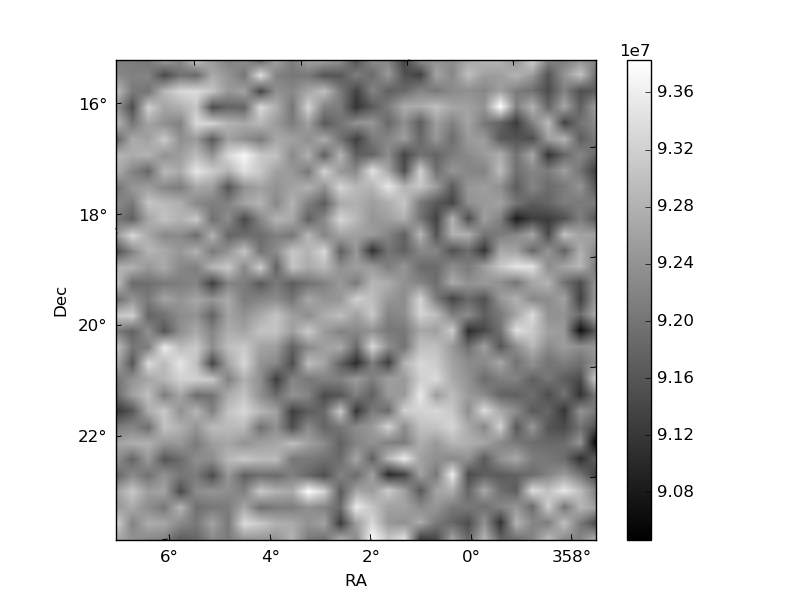
Quadrant B |
|---|---|---|---|
| Quadrant D | 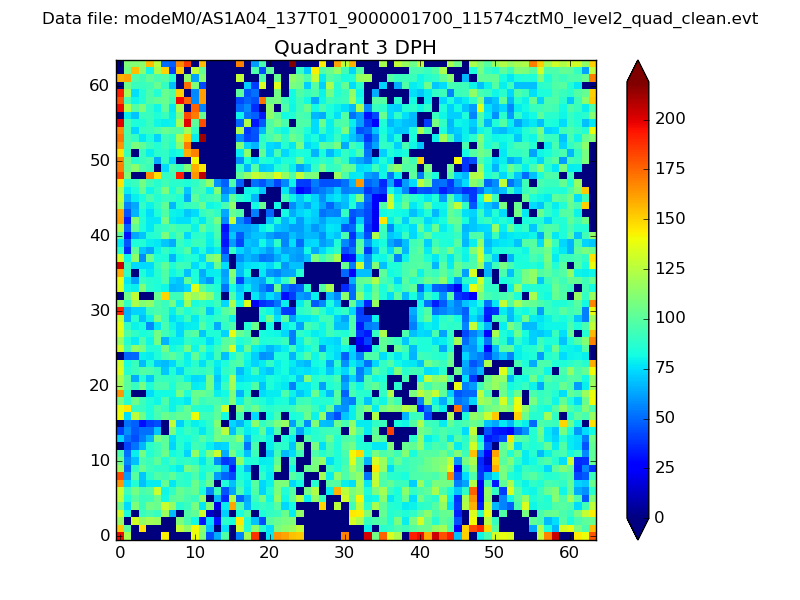 |
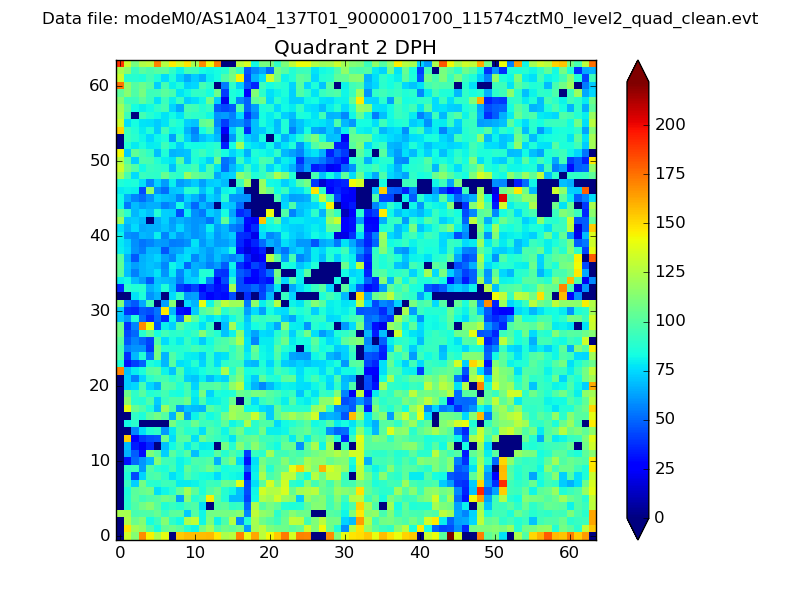 |
Quadrant C |
| Plot type | Count rate plots | Images |
|---|---|---|
| Comparison with Poisson distribution Blue bars denote a histogram of data divided into 1 sec bins. Red curve is a Poisson curve with rate = median count rate of data. |
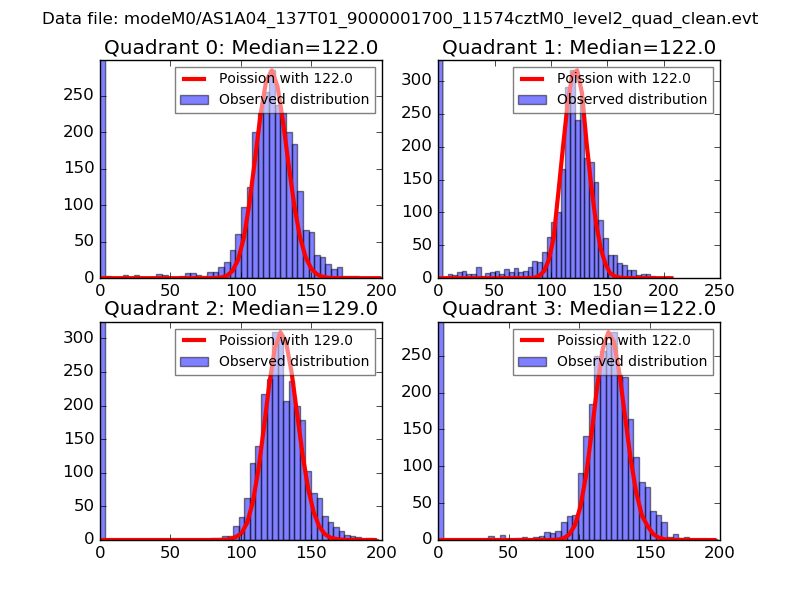 |
 |
| Quadrant-wise count rates Data is divided into 100 sec bins |
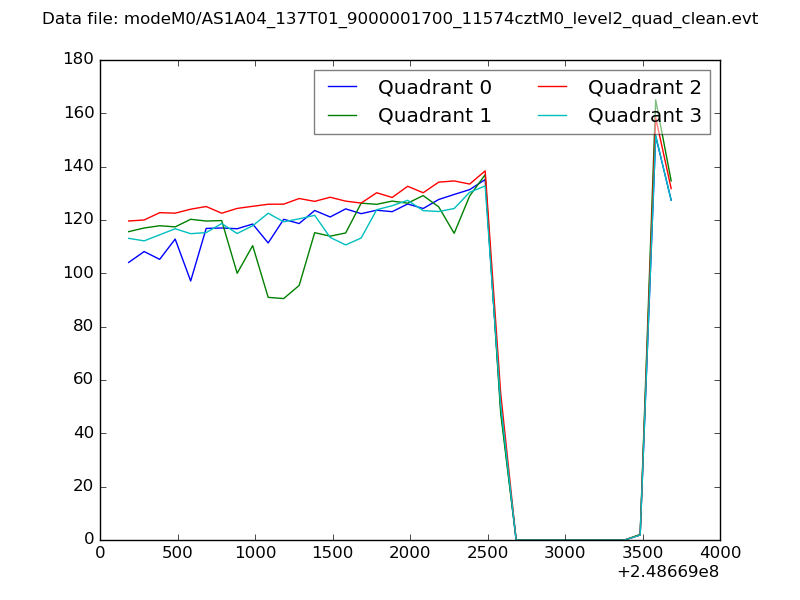 |
|
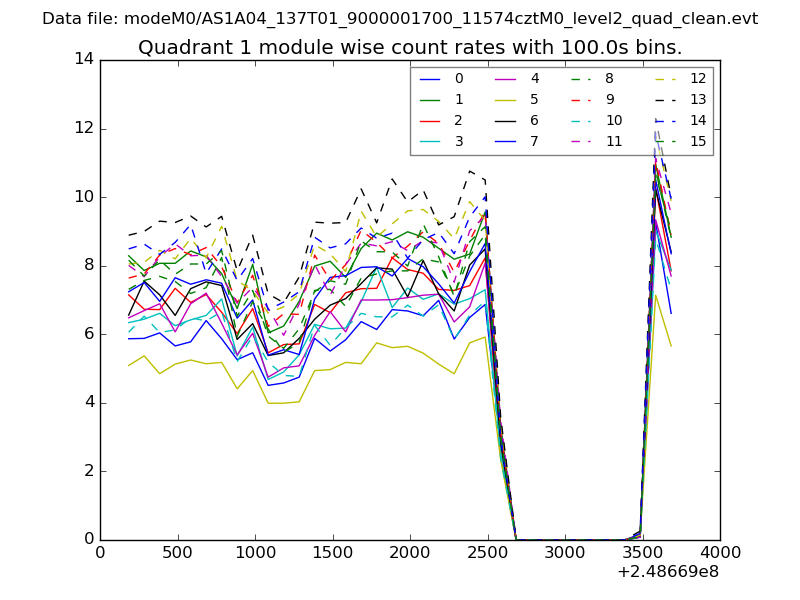
| Module-wise count rates for Quadrant A Data is divided into 100 sec bins |
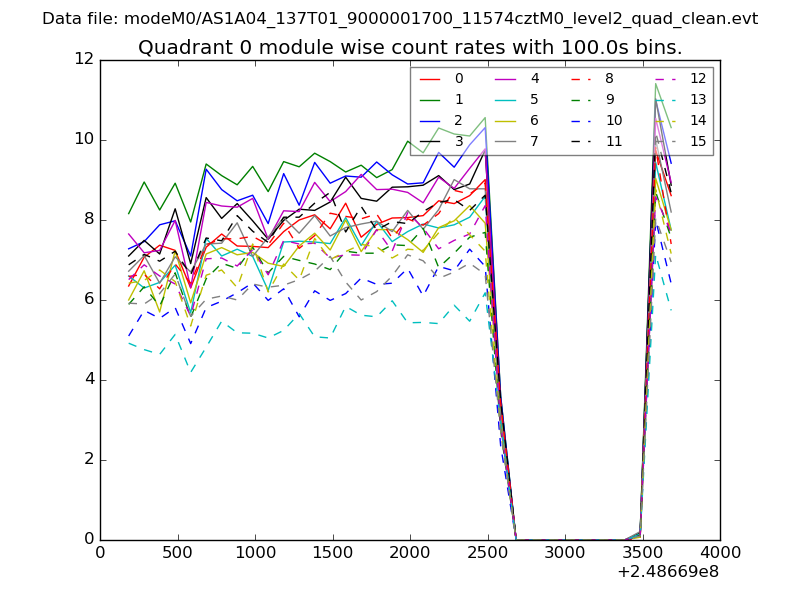 |
 |
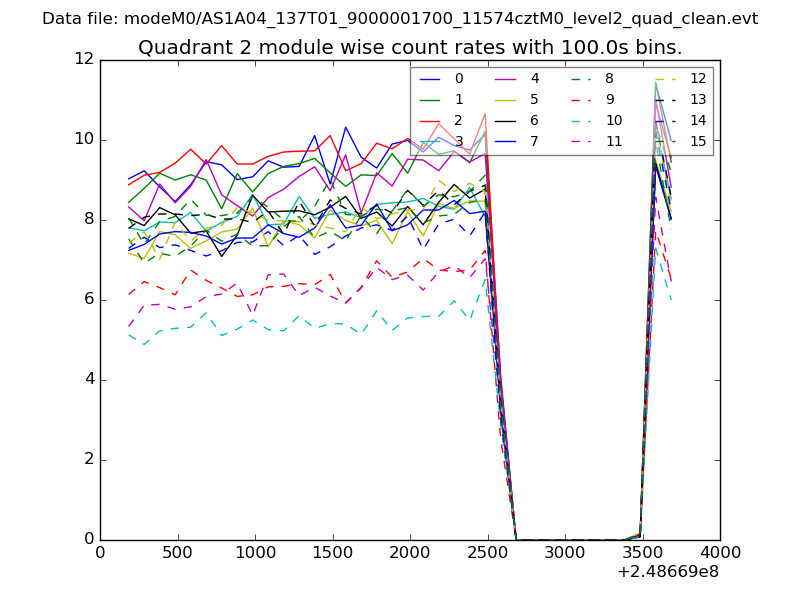
| Module-wise count rates for Quadrant B Data is divided into 100 sec bins |
 |
 |
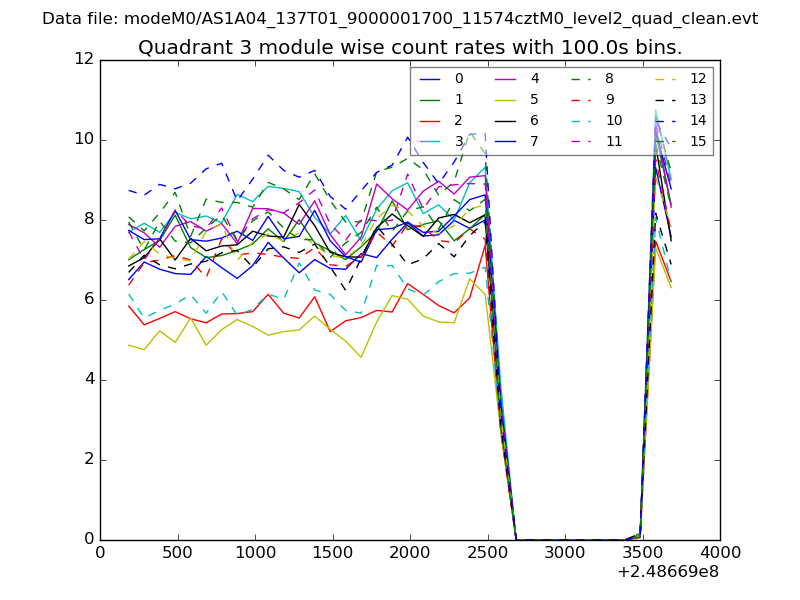
| Module-wise count rates for Quadrant C Data is divided into 100 sec bins |
 |
 |
| Module-wise count rates for Quadrant D Data is divided into 100 sec bins |
 |
 |
| Parameter | Plot |
|---|---|
| CZT HV Monitor | 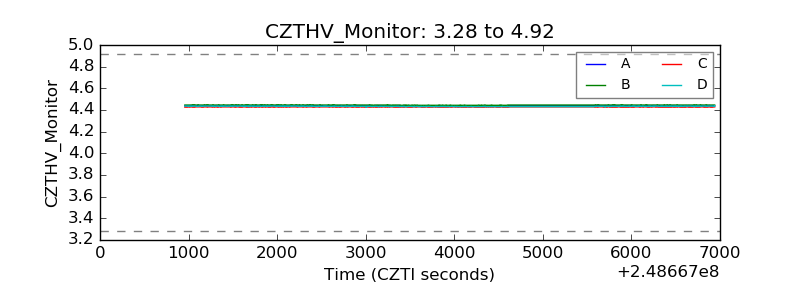 |
| D_VDD | 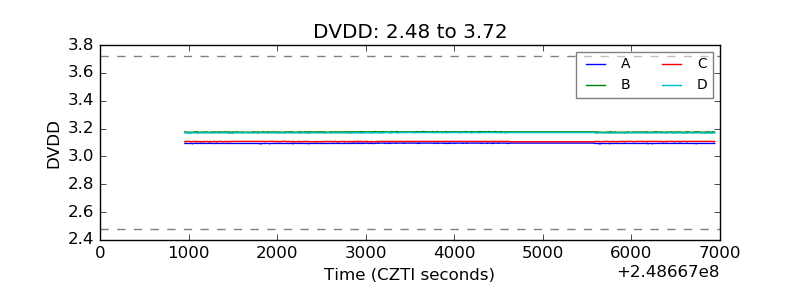 |
| Temperature 1 | 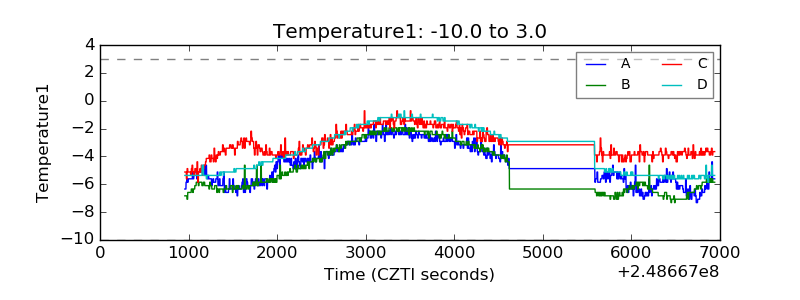 |
| Veto HV Monitor | 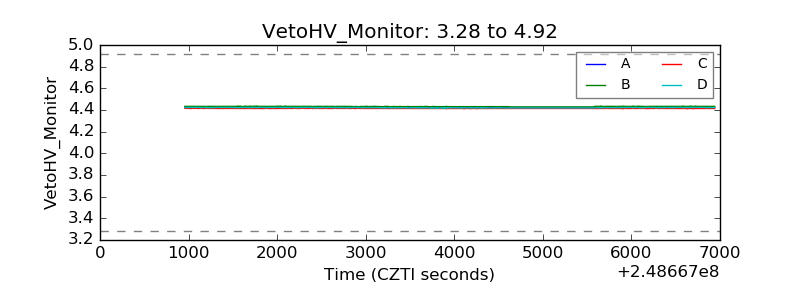 |
| Veto LLD | 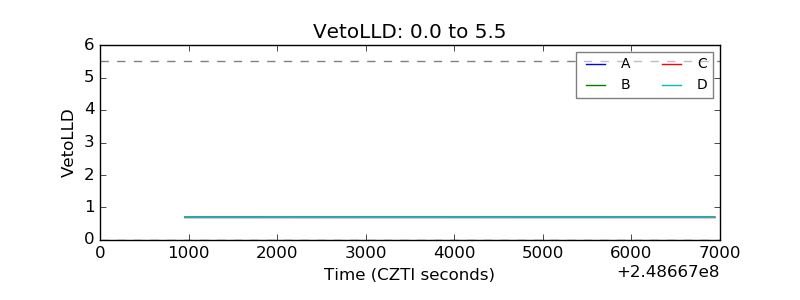 |
| Alpha Counter | 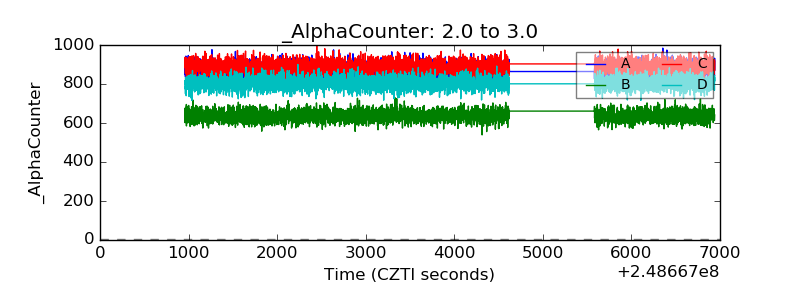 |
| _CPM_Rate | 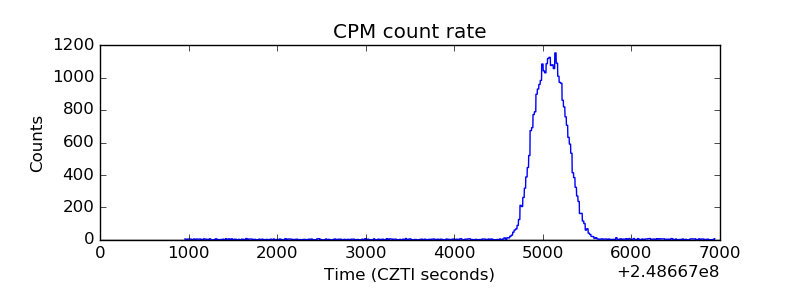 |
| CZT Counter | 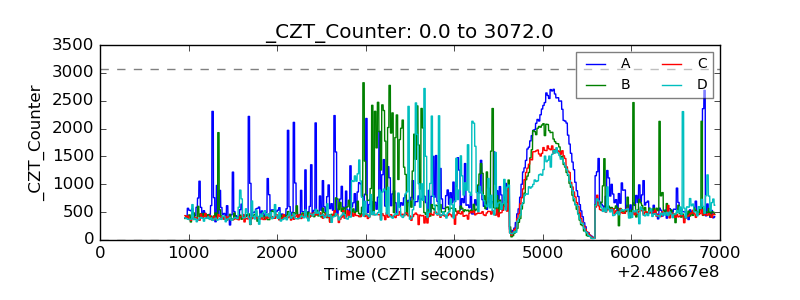 |
| +2.5 Volts monitor |  |
| +5 Volts monitor |  |
| _ROLL_ROT | 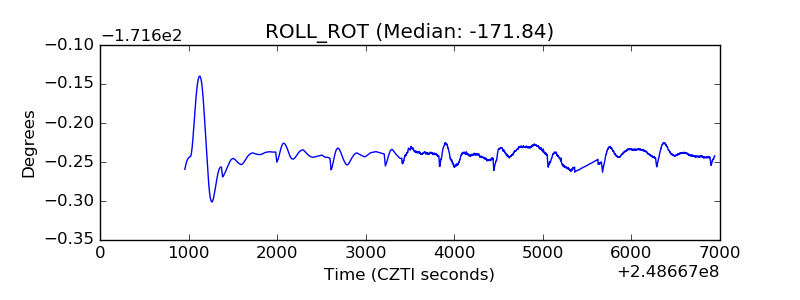 |
| _Roll_DEC | 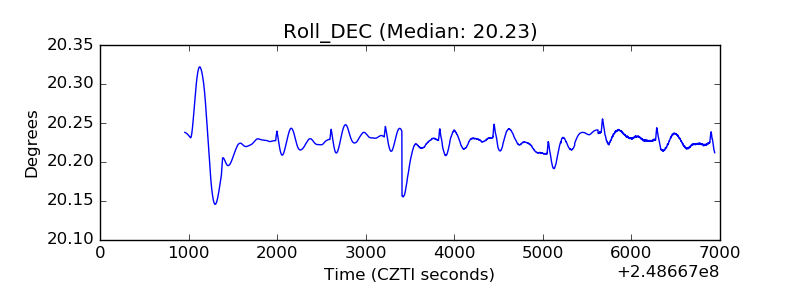 |
| _Roll_RA | 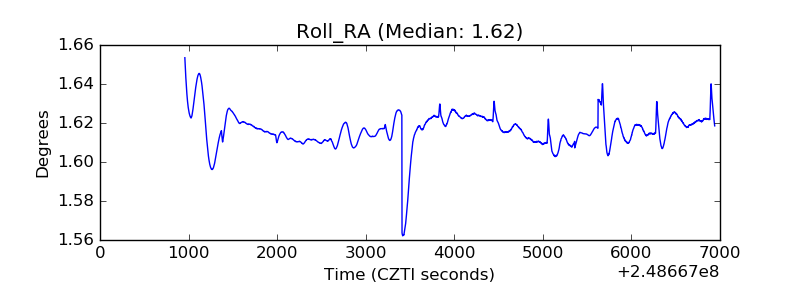 |
| Veto Counter | 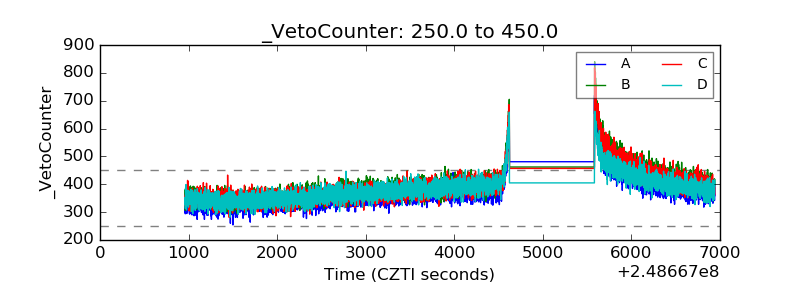 |