| Param | Original file | Final file |
|---|---|---|
| Filename | modeM0/AS1A04_137T01_9000001700_11577cztM0_level2.evt | modeM0/AS1A04_137T01_9000001700_11577cztM0_level2_quad_clean.evt |
| Size (bytes) | 556,971,840 | 65,332,800 |
| Size | 531.2 MB | 62.3 MB |
| Events in quadrant A | 5,066,662 | 378,817 |
| Events in quadrant B | 4,845,786 | 371,602 |
| Events in quadrant C | 3,099,977 | 401,900 |
| Events in quadrant D | 3,424,857 | 381,974 |
| Mode M0 | |||
|---|---|---|---|
| Quadrant | BADHDUFLAG | Total packets | Discarded packets |
| A | 0 | 19392 | 3 |
| B | 0 | 18445 | 2 |
| C | 0 | 13266 | 2 |
| D | 0 | 14279 | 2 |
| Mode SS | |||
|---|---|---|---|
| Quadrant | BADHDUFLAG | Total packets | Discarded packets |
| A | 0 | 130 | 0 |
| B | 0 | 130 | 0 |
| C | 0 | 130 | 0 |
| D | 0 | 130 | 0 |
| Mode M9 | |||
|---|---|---|---|
| Quadrant | BADHDUFLAG | Total packets | Discarded packets |
| A | 0 | 18 | 0 |
| B | 0 | 18 | 0 |
| C | 0 | 18 | 0 |
| D | 0 | 19 | 0 |
| Quadrant | Total seconds | Saturated seconds | Saturation percentage |
|---|---|---|---|
| A | 6353 | 416 | 6.548088% |
| B | 6353 | 485 | 7.634189% |
| C | 6353 | 50 | 0.787030% |
| D | 6353 | 92 | 1.448135% |
Noise dominated data is calculated using 1-second bins in cleaned event files. If a bin has >2000 counts, and if more than 50% of those come from <1% of pixels, then it is considered to be noise-dominated and hence unusable.
| Quadrant | # 1 sec bins | Bins with >0 counts | Bins with >2000 counts | High rate bins dominated by noise | Noise dominated (total time) | Noise dominated (detector-on time) | Marked lightcurve |
|---|---|---|---|---|---|---|---|
| A | 7539 | 6355 | 228 | 228 | 3.02% | 3.59% |  |
| B | 7539 | 6355 | 293 | 293 | 3.89% | 4.61% | 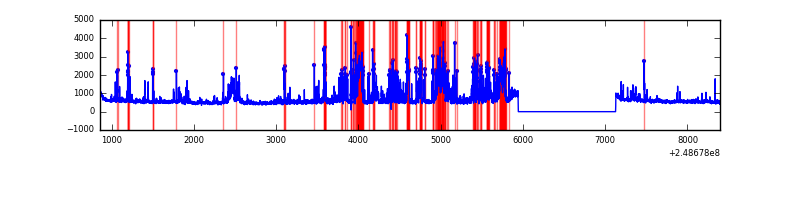 |
| C | 7539 | 6355 | 0 | 0 | 0.00% | 0.00% | 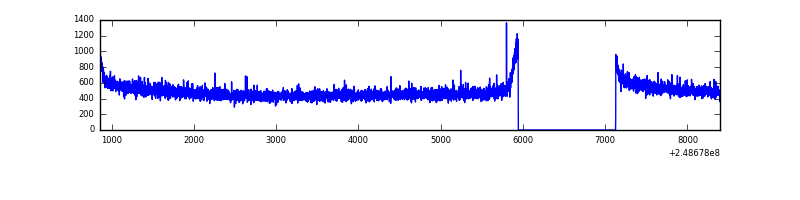 |
| D | 7539 | 6355 | 40 | 40 | 0.53% | 0.63% |  |
Top three noisy pixels from each quadrant. If the there are fewer than three noisy pixels in the level2.evt file, extra rows are filled as -1
| Pixel properties | Quadrant properties | ||||||
|---|---|---|---|---|---|---|---|
| Quadrant | DetID | PixID | Counts | Sigma | Mean | Median | Sigma |
| A | 8 | 5 | 1754879 | 10848.95 | 805 | 791 | 161.7 |
| A | 1 | 162 | 65054 | 397.46 | 805 | 791 | 161.7 |
| A | 1 | 178 | 36669 | 221.9 | 805 | 791 | 161.7 |
| B | 4 | 239 | 881814 | 5767.54 | 804 | 787 | 152.8 |
| B | 15 | 255 | 353691 | 2310.24 | 804 | 787 | 152.8 |
| B | 3 | 64 | 261597 | 1707.36 | 804 | 787 | 152.8 |
| C | 13 | 61 | 5856 | 27.82 | 793 | 802 | 181.7 |
| C | 12 | 4 | 4360 | 19.59 | 793 | 802 | 181.7 |
| C | 9 | 54 | 2003 | 6.61 | 793 | 802 | 181.7 |
| D | 2 | 120 | 93325 | 495.23 | 786 | 767 | 186.9 |
| D | 13 | 122 | 79197 | 419.64 | 786 | 767 | 186.9 |
| D | 10 | 253 | 76779 | 406.7 | 786 | 767 | 186.9 |
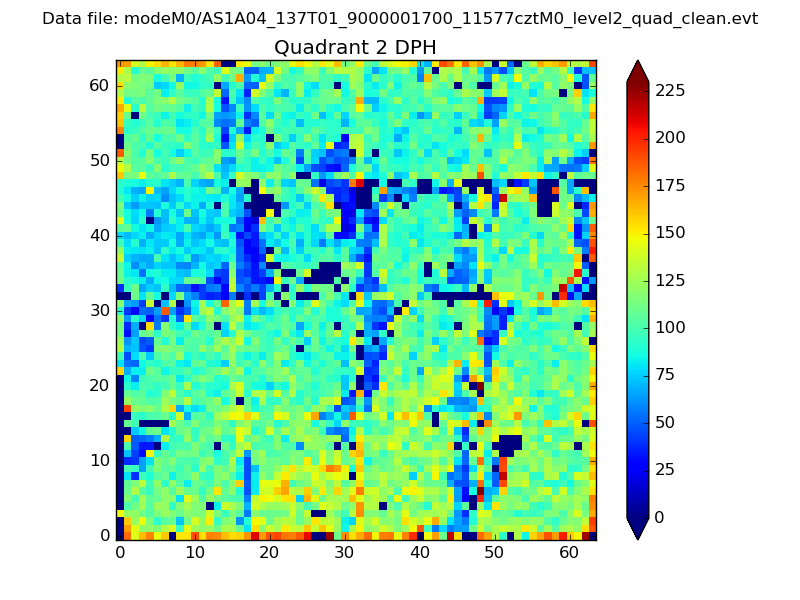
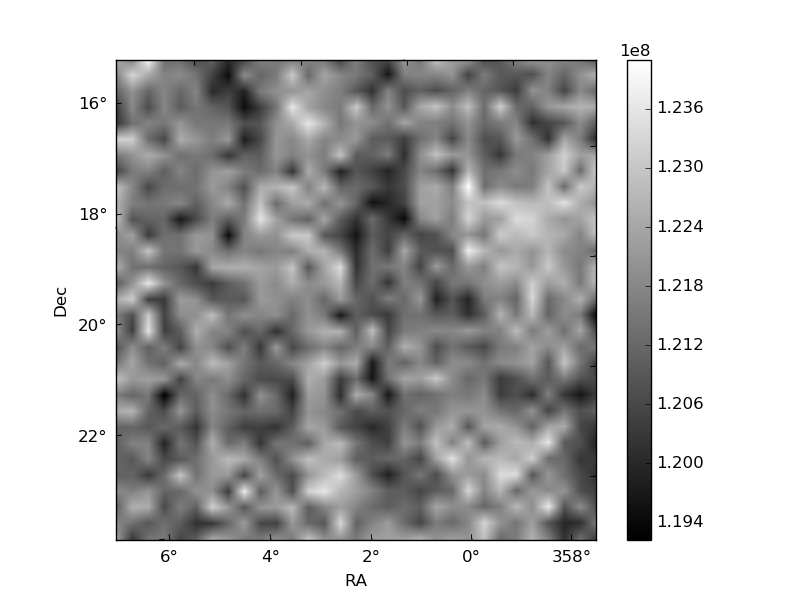
Histogram calculated using DETX and DETY for each event in the final _common_clean file
| Quadrant A | 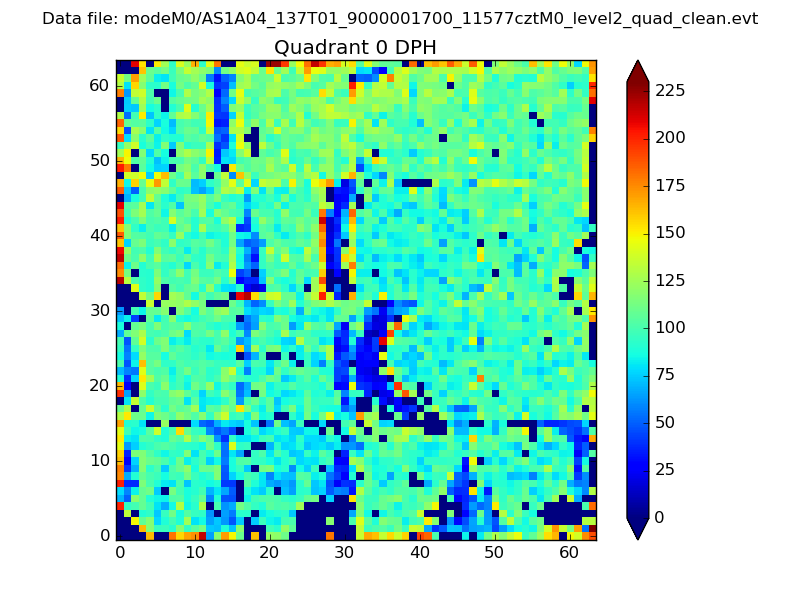 |
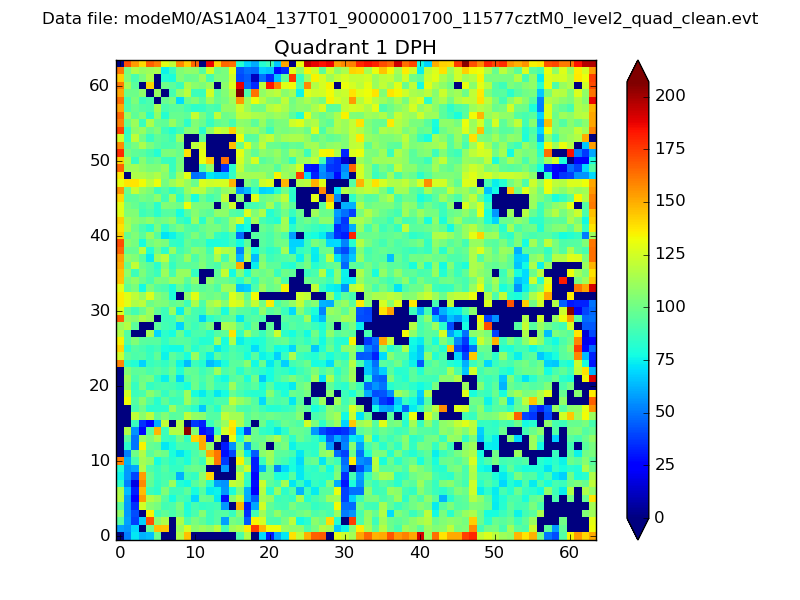 |
Quadrant B |
|---|---|---|---|
| Quadrant D | 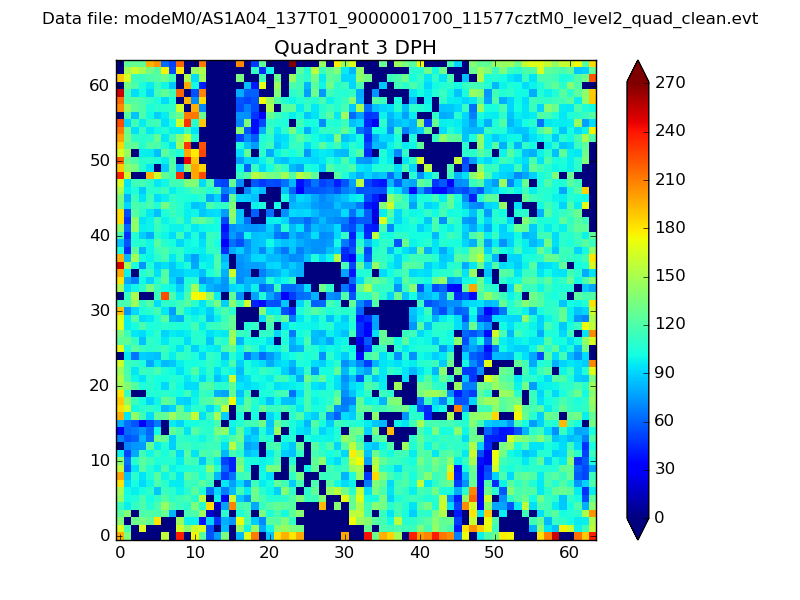 |
 |
Quadrant C |
| Plot type | Count rate plots | Images |
|---|---|---|
| Comparison with Poisson distribution Blue bars denote a histogram of data divided into 1 sec bins. Red curve is a Poisson curve with rate = median count rate of data. |
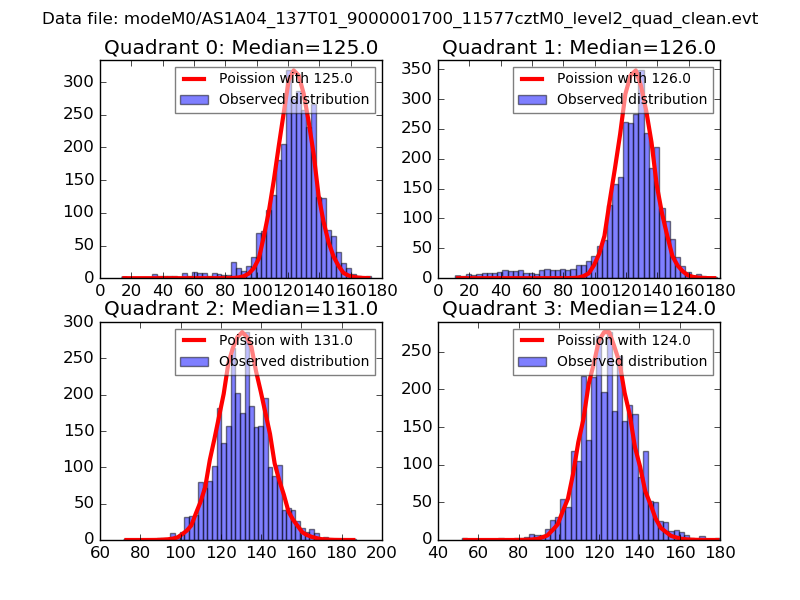 |
 |
| Quadrant-wise count rates Data is divided into 100 sec bins |
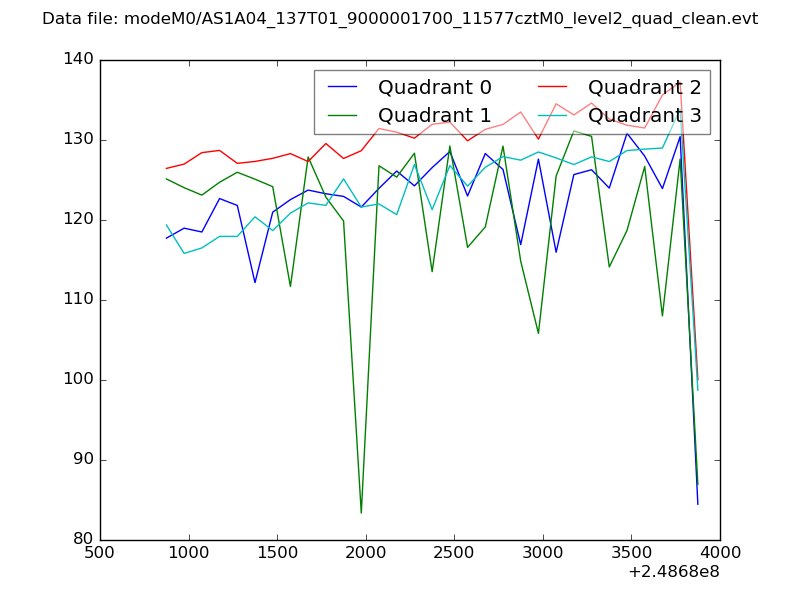 |
|
| Module-wise count rates for Quadrant A Data is divided into 100 sec bins |
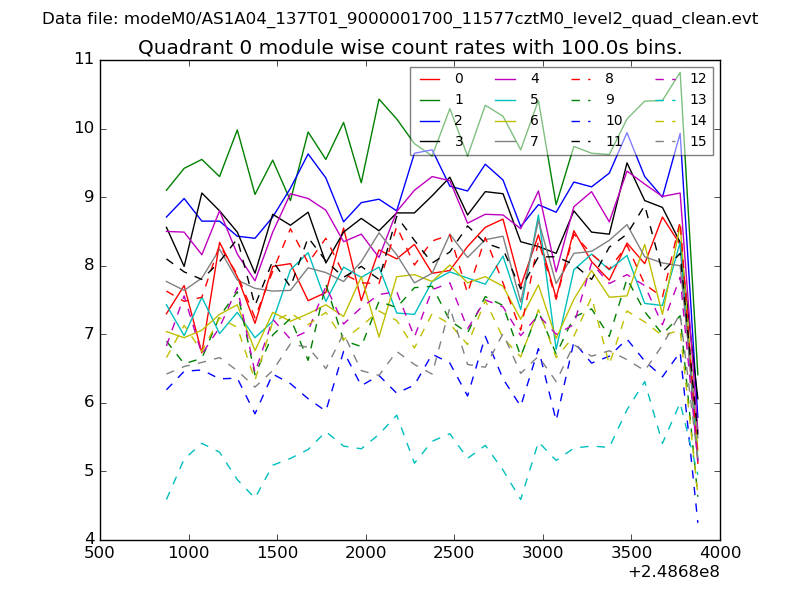 |
 |
| Module-wise count rates for Quadrant B Data is divided into 100 sec bins |
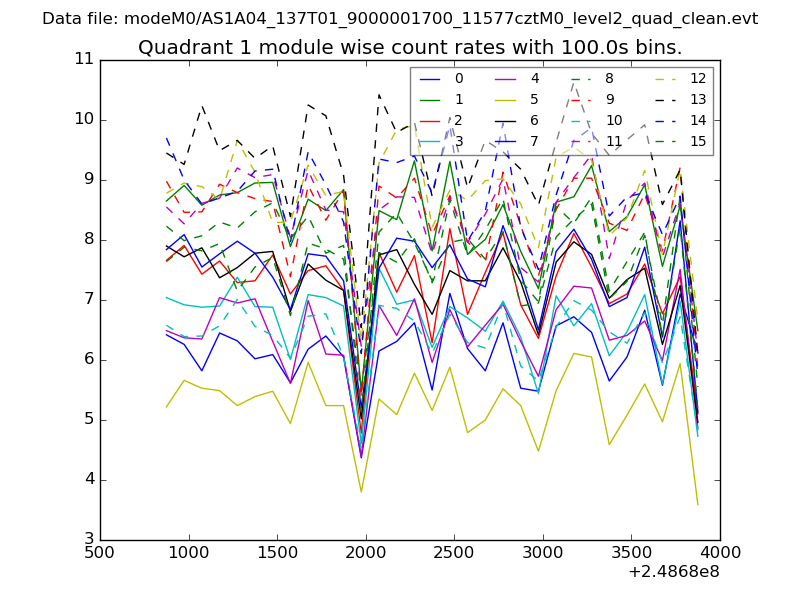 |
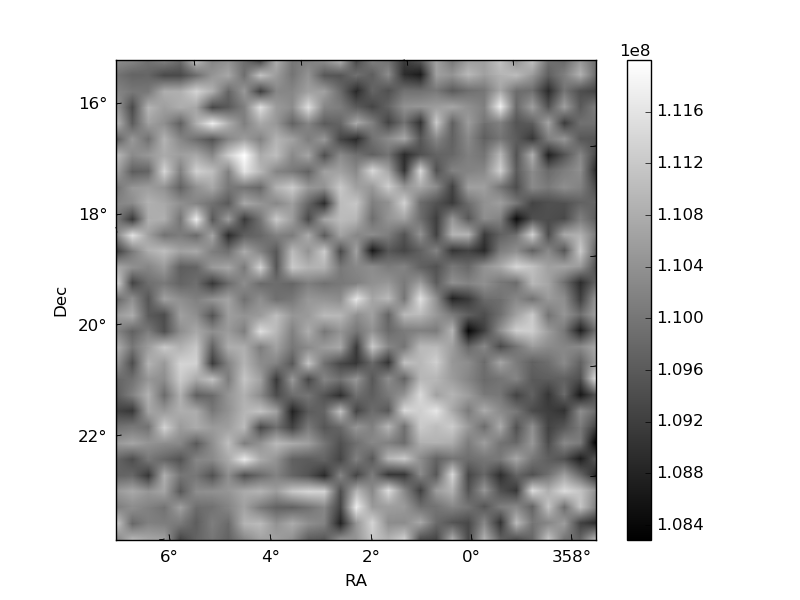 |
| Module-wise count rates for Quadrant C Data is divided into 100 sec bins |
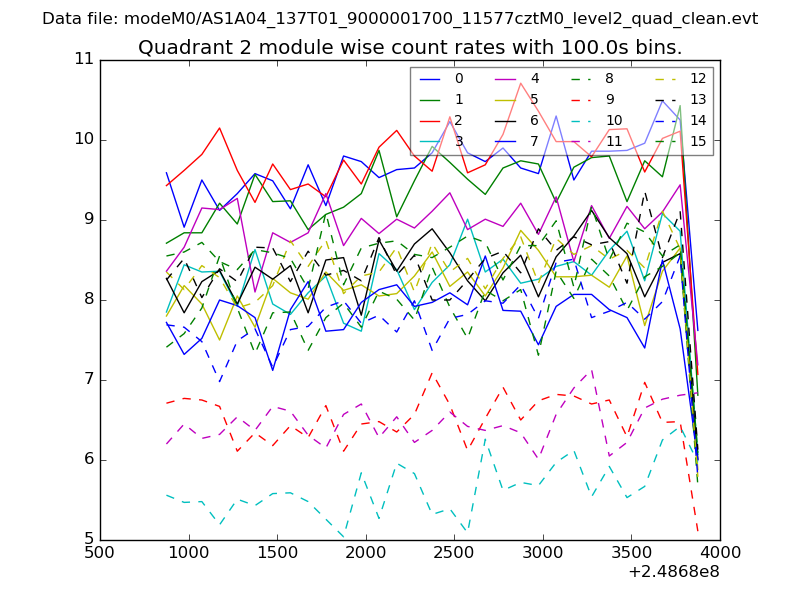 |
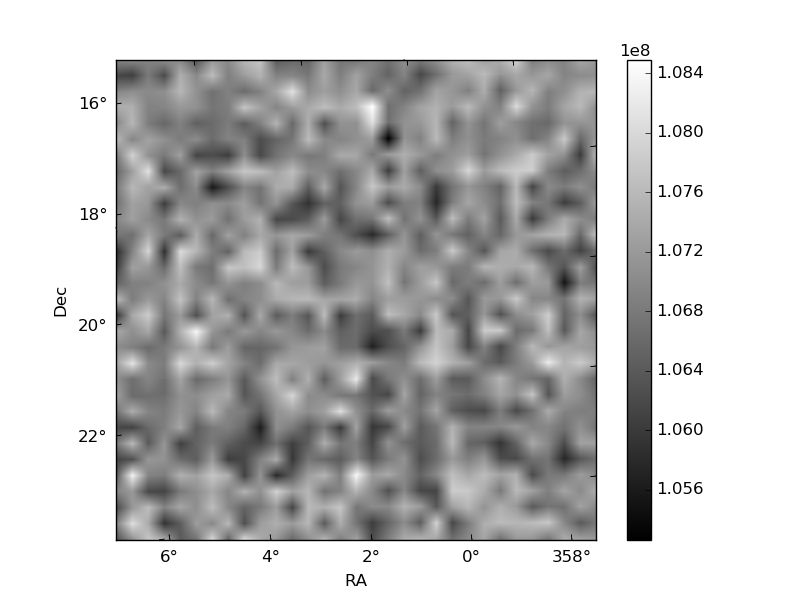 |
| Module-wise count rates for Quadrant D Data is divided into 100 sec bins |
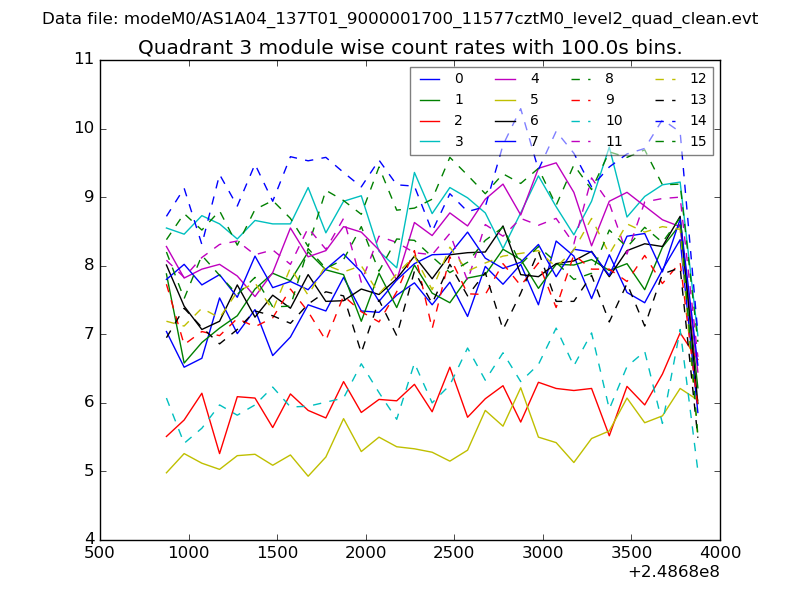 |
 |
| Parameter | Plot |
|---|---|
| CZT HV Monitor | 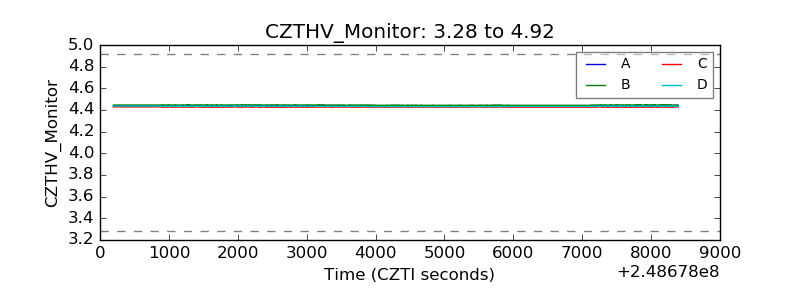 |
| D_VDD | 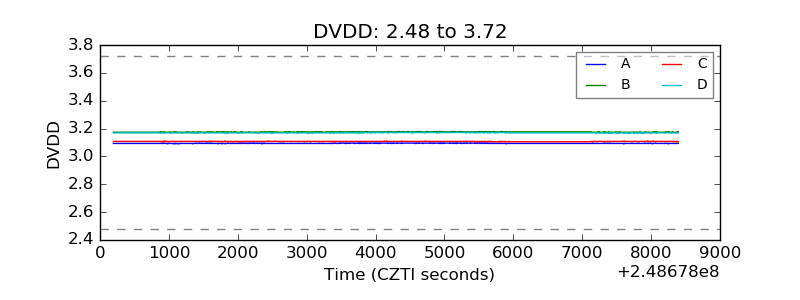 |
| Temperature 1 | 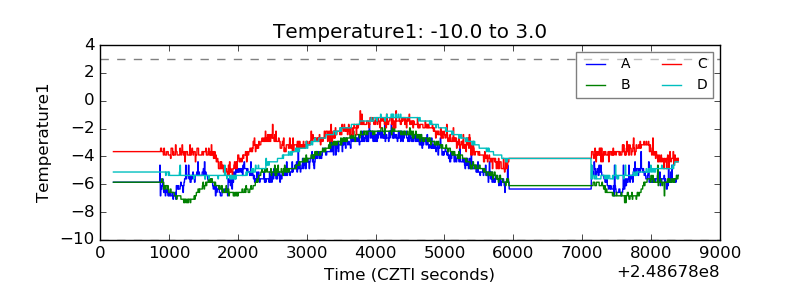 |
| Veto HV Monitor | 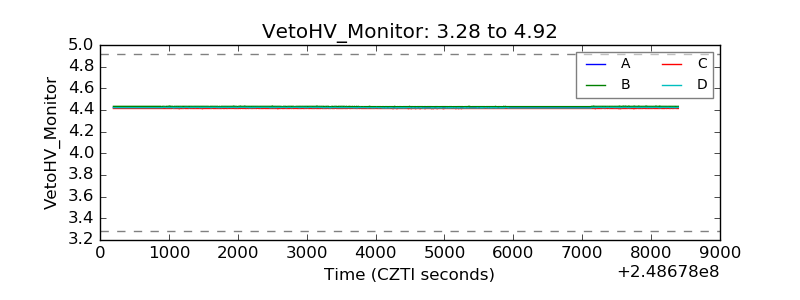 |
| Veto LLD | 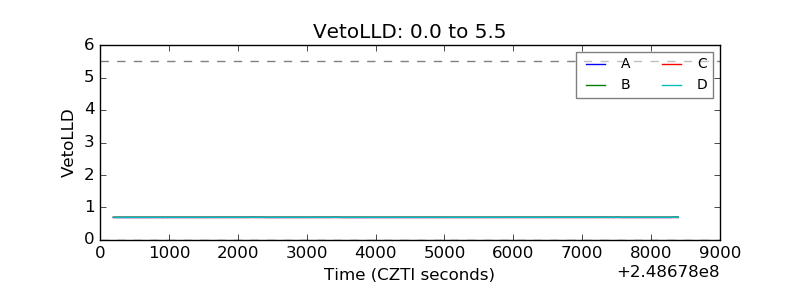 |
| Alpha Counter | 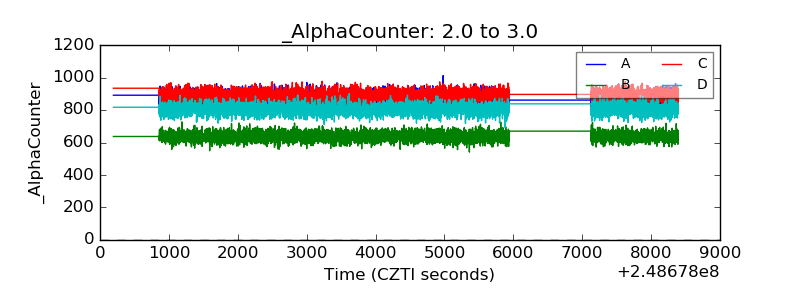 |
| _CPM_Rate | 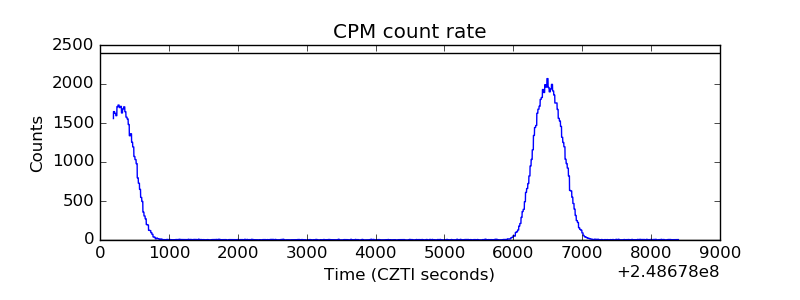 |
| CZT Counter | 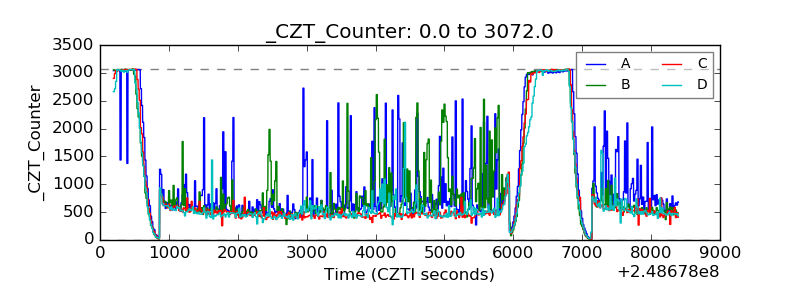 |
| +2.5 Volts monitor |  |
| +5 Volts monitor |  |
| _ROLL_ROT | 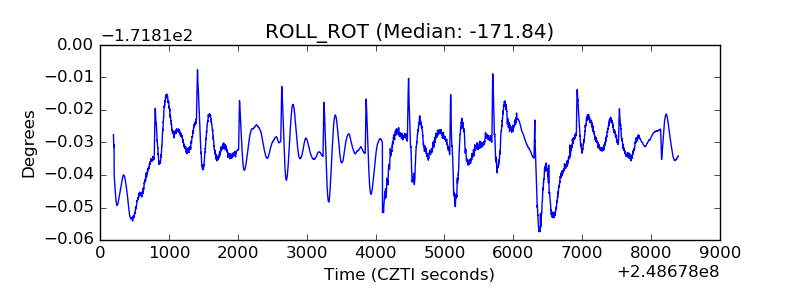 |
| _Roll_DEC | 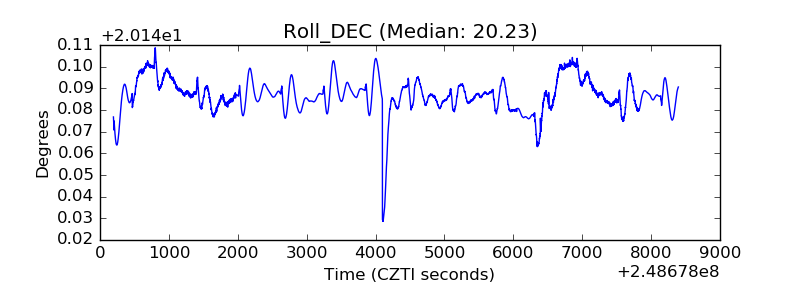 |
| _Roll_RA | 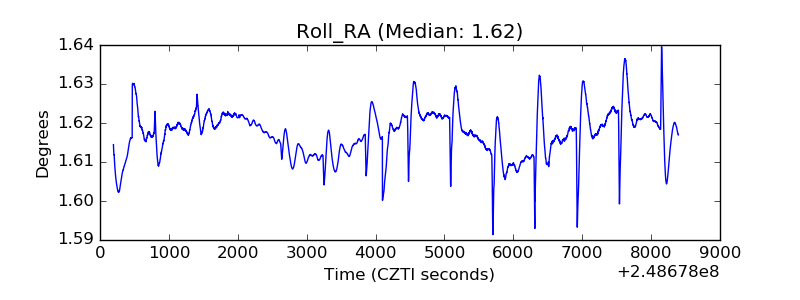 |
| Veto Counter | 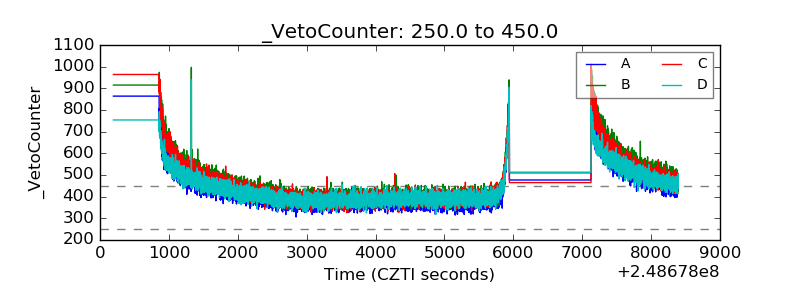 |