| Param | Original file | Final file |
|---|---|---|
| Filename | modeM0/AS1A04_137T01_9000001700_11579cztM0_level2.evt | modeM0/AS1A04_137T01_9000001700_11579cztM0_level2_quad_clean.evt |
| Size (bytes) | 628,462,080 | 86,198,400 |
| Size | 599.3 MB | 82.2 MB |
| Events in quadrant A | 5,070,539 | 559,363 |
| Events in quadrant B | 6,440,094 | 500,723 |
| Events in quadrant C | 3,219,559 | 572,644 |
| Events in quadrant D | 3,873,422 | 534,048 |
| Mode M0 | |||
|---|---|---|---|
| Quadrant | BADHDUFLAG | Total packets | Discarded packets |
| A | 0 | 19560 | 3 |
| B | 0 | 23350 | 2 |
| C | 0 | 13451 | 2 |
| D | 0 | 15419 | 2 |
| Mode SS | |||
|---|---|---|---|
| Quadrant | BADHDUFLAG | Total packets | Discarded packets |
| A | 0 | 128 | 0 |
| B | 0 | 128 | 0 |
| C | 0 | 128 | 0 |
| D | 0 | 128 | 0 |
| Mode M9 | |||
|---|---|---|---|
| Quadrant | BADHDUFLAG | Total packets | Discarded packets |
| A | 0 | 17 | 0 |
| B | 0 | 17 | 0 |
| C | 0 | 17 | 0 |
| D | 0 | 18 | 0 |
| Quadrant | Total seconds | Saturated seconds | Saturation percentage |
|---|---|---|---|
| A | 6351 | 352 | 5.542434% |
| B | 6351 | 1187 | 18.689970% |
| C | 6351 | 100 | 1.574555% |
| D | 6351 | 299 | 4.707920% |
Noise dominated data is calculated using 1-second bins in cleaned event files. If a bin has >2000 counts, and if more than 50% of those come from <1% of pixels, then it is considered to be noise-dominated and hence unusable.
| Quadrant | # 1 sec bins | Bins with >0 counts | Bins with >2000 counts | High rate bins dominated by noise | Noise dominated (total time) | Noise dominated (detector-on time) | Marked lightcurve |
|---|---|---|---|---|---|---|---|
| A | 7602 | 6353 | 140 | 140 | 1.84% | 2.20% | 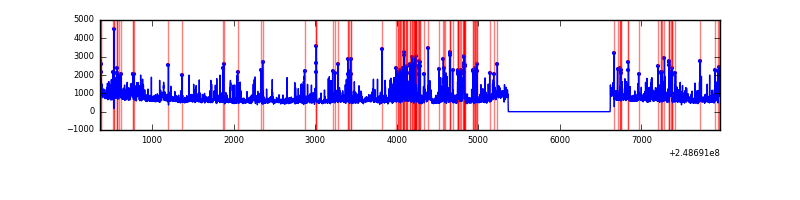 |
| B | 7602 | 6353 | 824 | 824 | 10.84% | 12.97% | 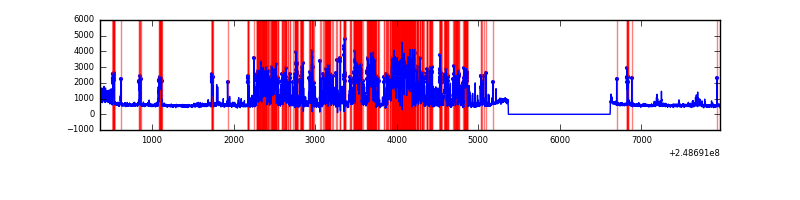 |
| C | 7602 | 6353 | 2 | 2 | 0.03% | 0.03% | 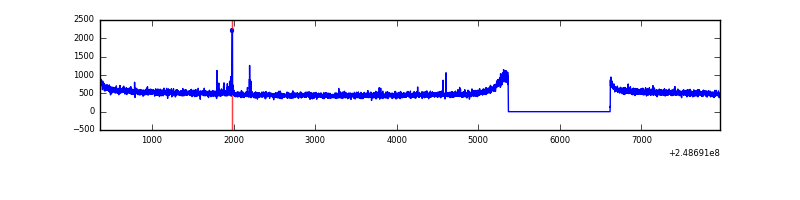 |
| D | 7602 | 6353 | 179 | 179 | 2.35% | 2.82% | 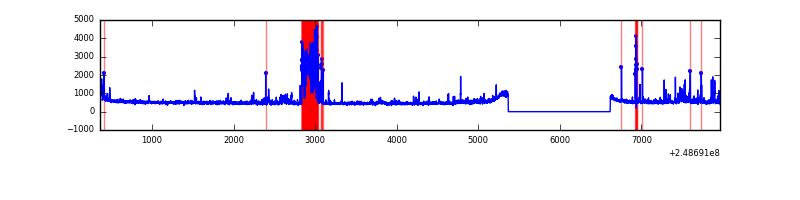 |
Top three noisy pixels from each quadrant. If the there are fewer than three noisy pixels in the level2.evt file, extra rows are filled as -1
| Pixel properties | Quadrant properties | ||||||
|---|---|---|---|---|---|---|---|
| Quadrant | DetID | PixID | Counts | Sigma | Mean | Median | Sigma |
| A | 8 | 5 | 1586141 | 9309.91 | 846 | 831 | 170.3 |
| A | 1 | 162 | 49969 | 288.57 | 846 | 831 | 170.3 |
| A | 9 | 143 | 45952 | 264.98 | 846 | 831 | 170.3 |
| B | 3 | 64 | 1660204 | 10933.15 | 798 | 780 | 151.8 |
| B | 4 | 239 | 942729 | 6206.05 | 798 | 780 | 151.8 |
| B | 15 | 255 | 496265 | 3264.51 | 798 | 780 | 151.8 |
| C | 9 | 54 | 23676 | 121.08 | 820 | 825 | 188.7 |
| C | 13 | 61 | 6018 | 27.52 | 820 | 825 | 188.7 |
| C | 3 | 202 | 1930 | 5.86 | 820 | 825 | 188.7 |
| D | 10 | 253 | 469733 | 2419.74 | 813 | 793 | 193.8 |
| D | 2 | 120 | 120770 | 619.08 | 813 | 793 | 193.8 |
| D | 1 | 52 | 107052 | 548.3 | 813 | 793 | 193.8 |
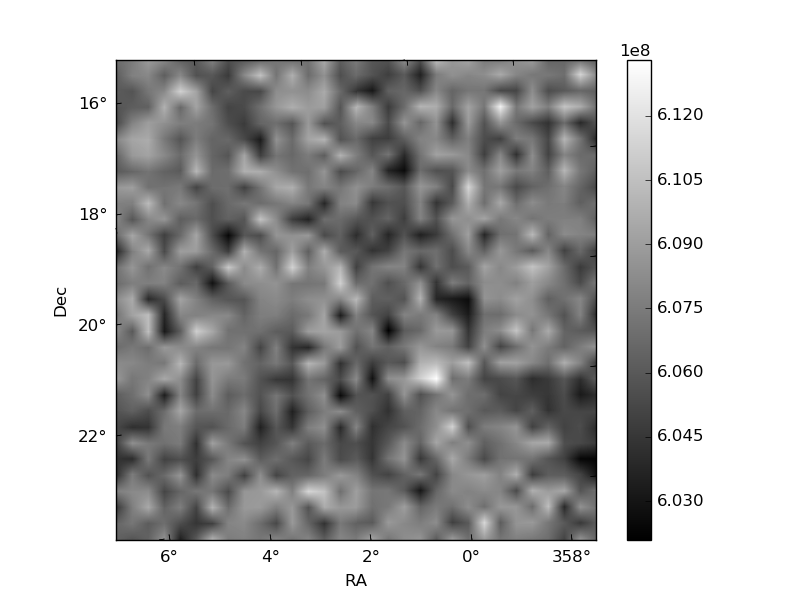
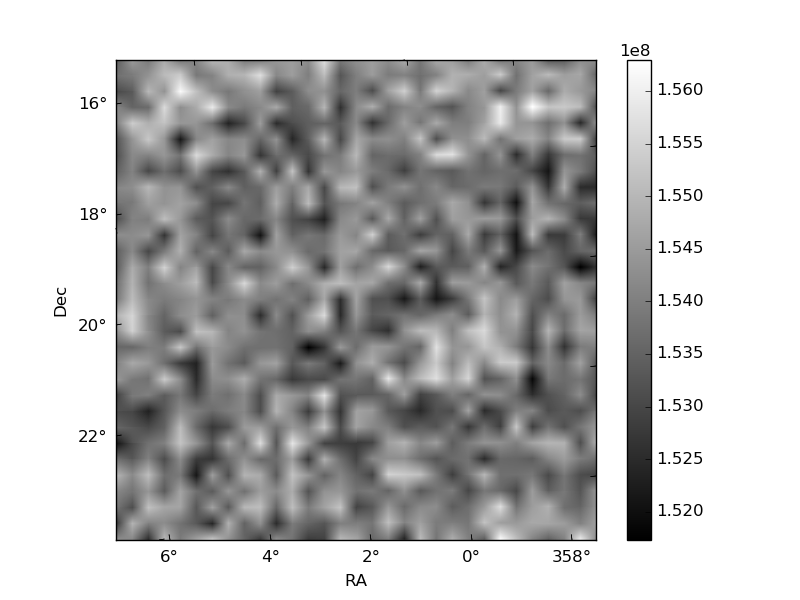
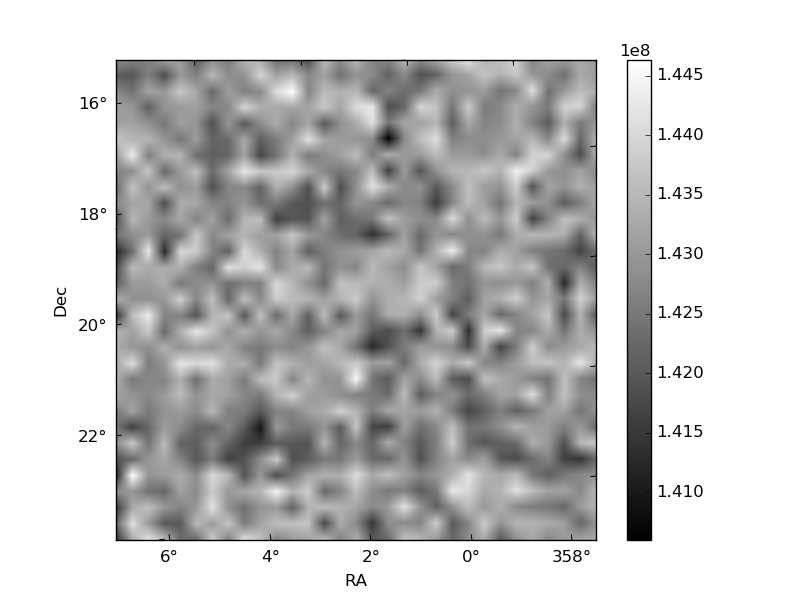
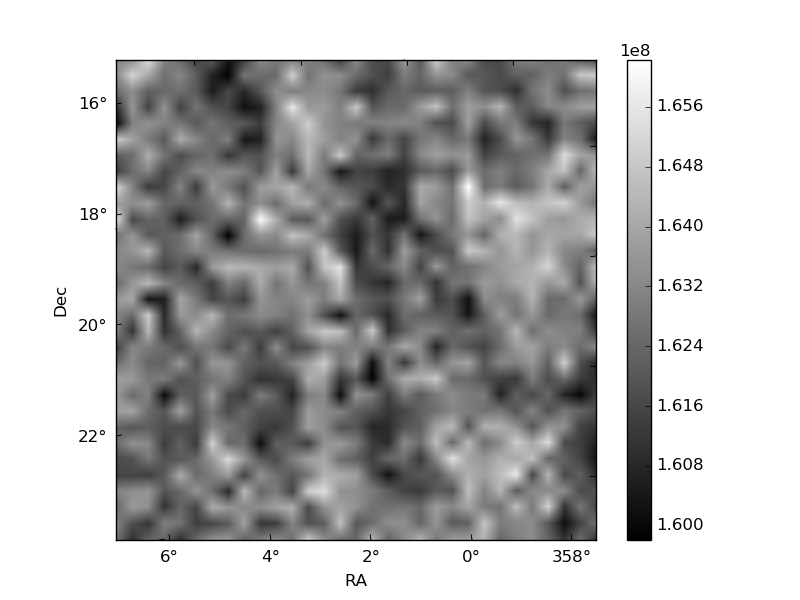
Histogram calculated using DETX and DETY for each event in the final _common_clean file
| Quadrant A | 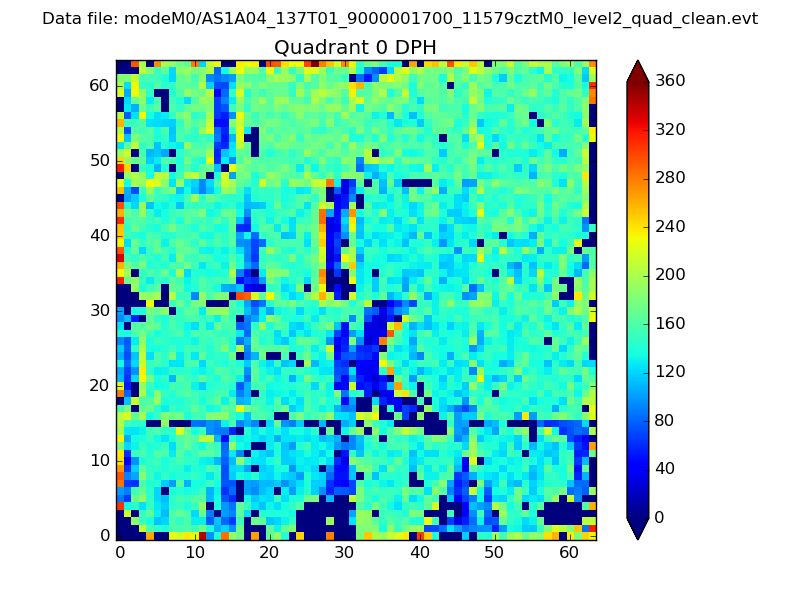 |
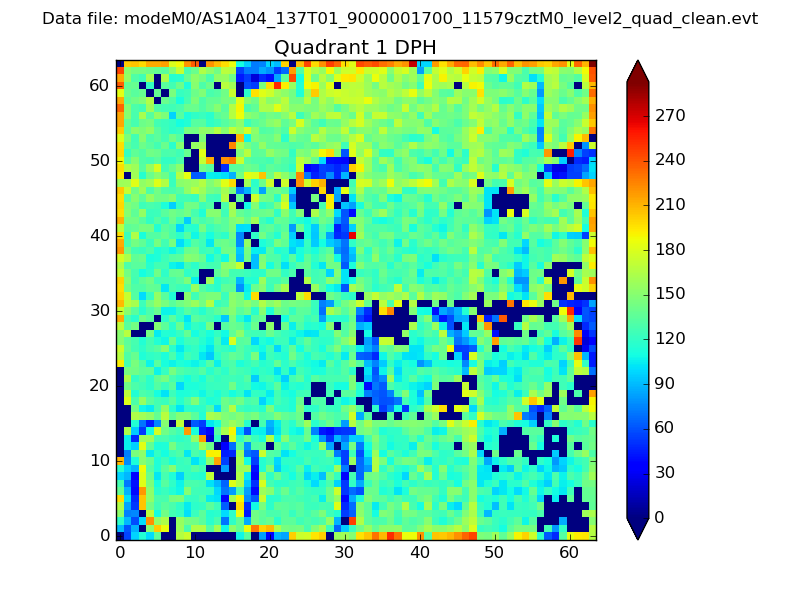 |
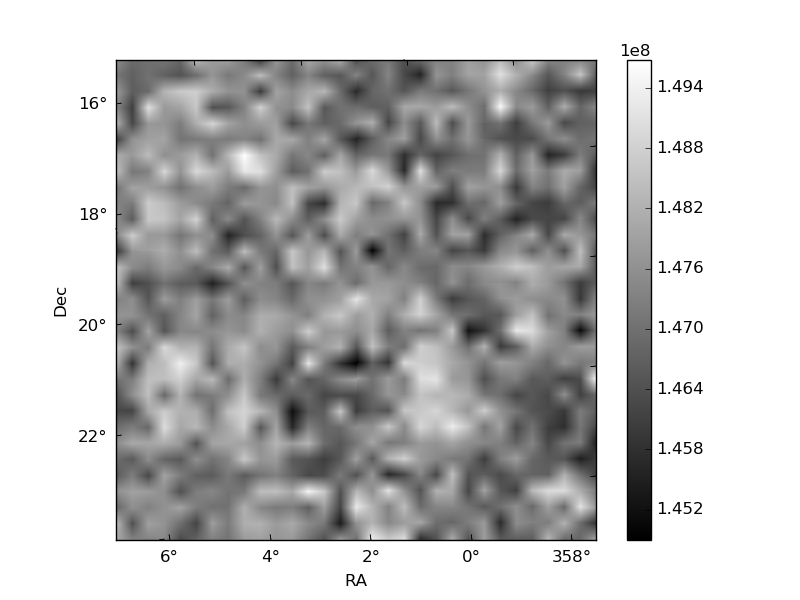
Quadrant B |
|---|---|---|---|
| Quadrant D | 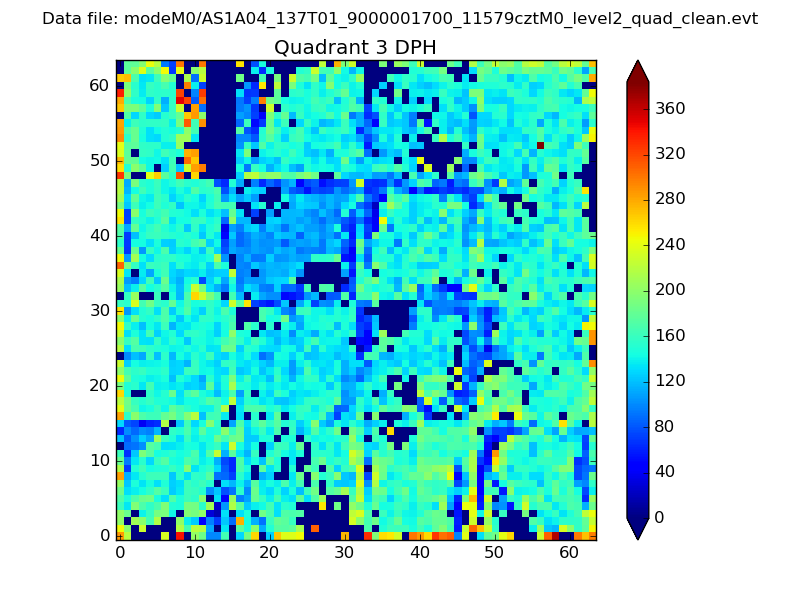 |
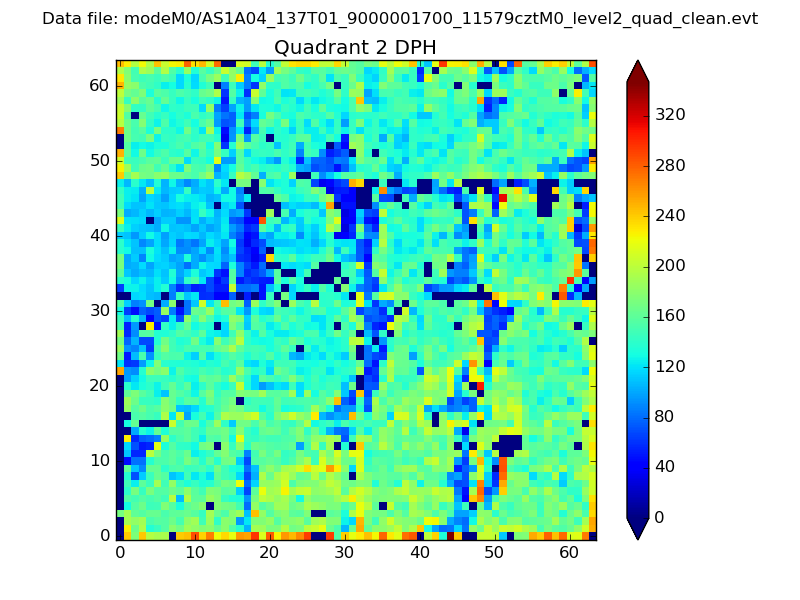 |
Quadrant C |
| Plot type | Count rate plots | Images |
|---|---|---|
| Comparison with Poisson distribution Blue bars denote a histogram of data divided into 1 sec bins. Red curve is a Poisson curve with rate = median count rate of data. |
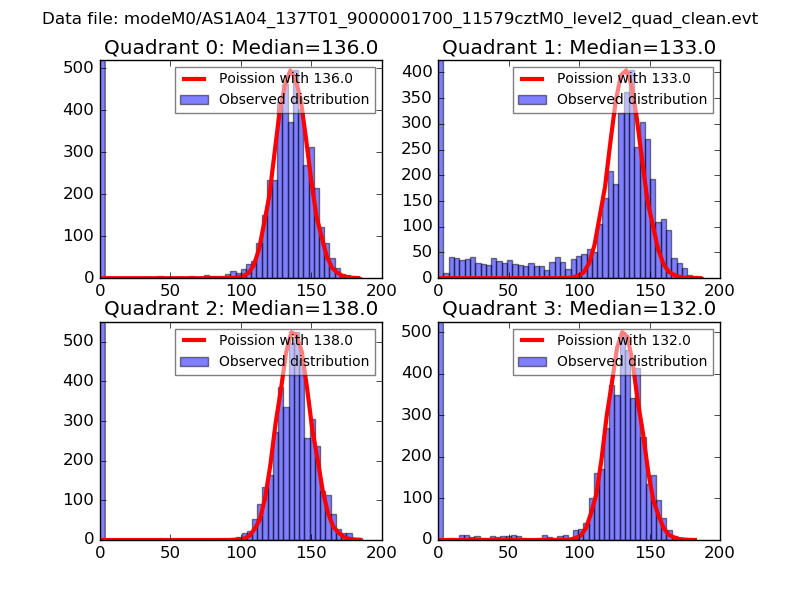 |
 |
| Quadrant-wise count rates Data is divided into 100 sec bins |
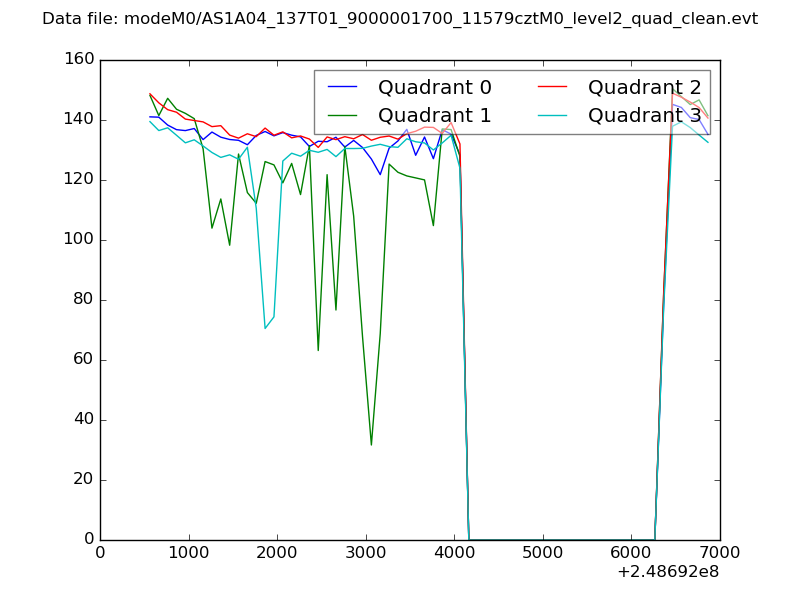 |
|
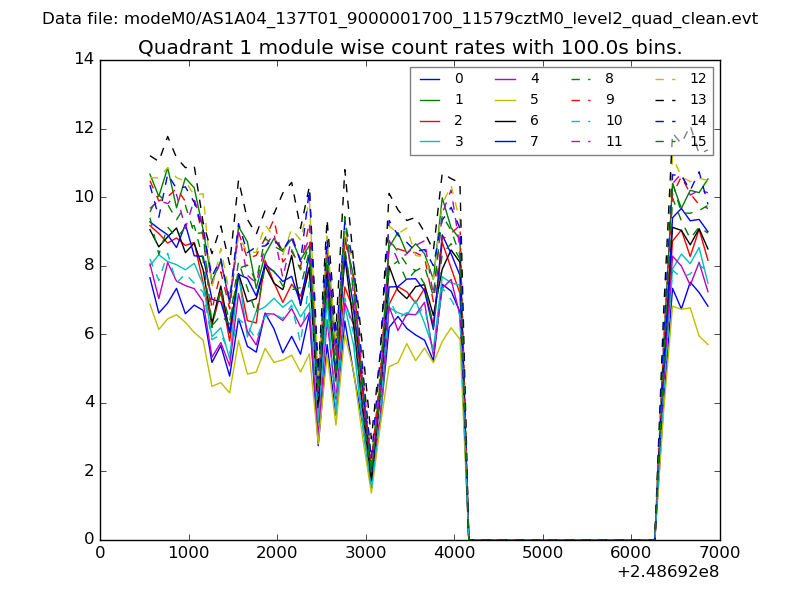
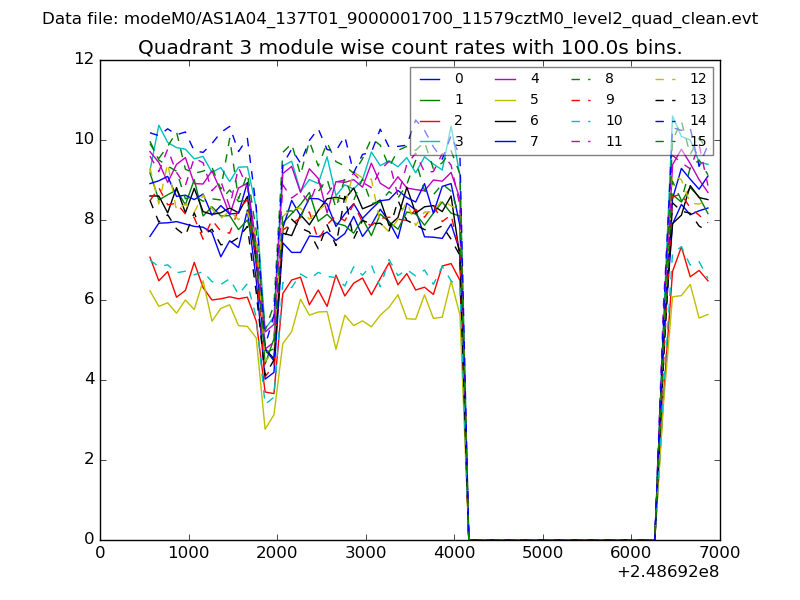
| Module-wise count rates for Quadrant A Data is divided into 100 sec bins |
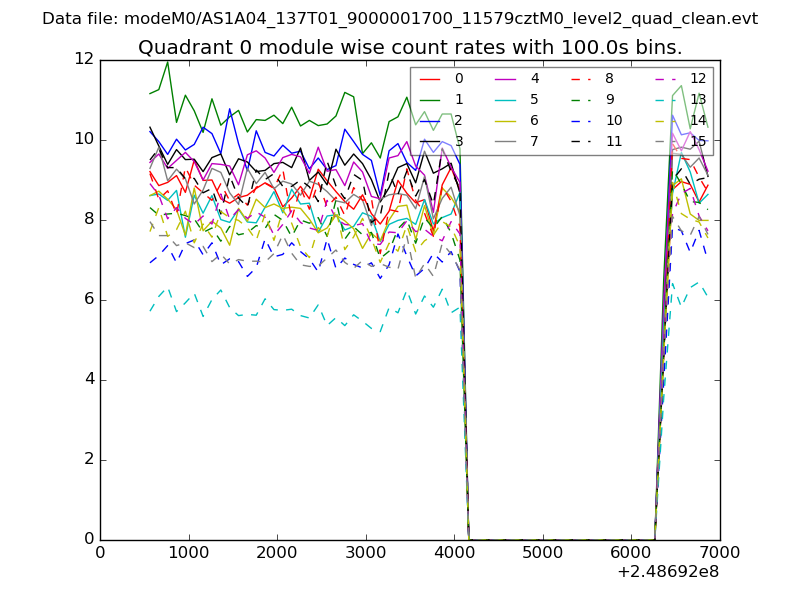 |
 |
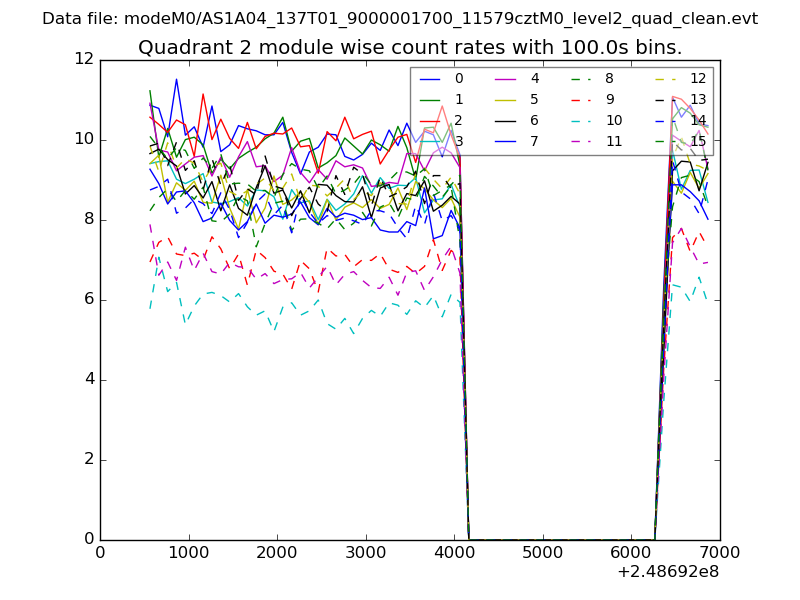
| Module-wise count rates for Quadrant B Data is divided into 100 sec bins |
 |
 |
| Module-wise count rates for Quadrant C Data is divided into 100 sec bins |
 |
 |
| Module-wise count rates for Quadrant D Data is divided into 100 sec bins |
 |
 |
| Parameter | Plot |
|---|---|
| CZT HV Monitor | 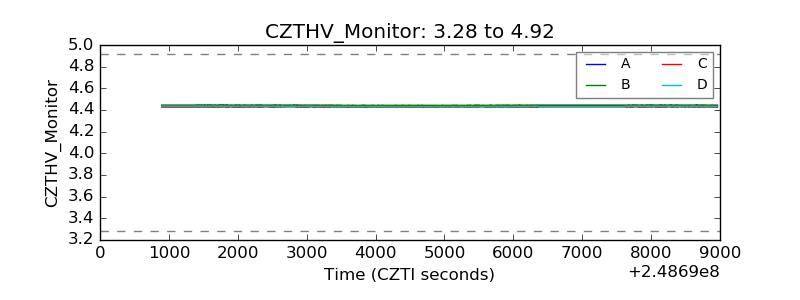 |
| D_VDD | 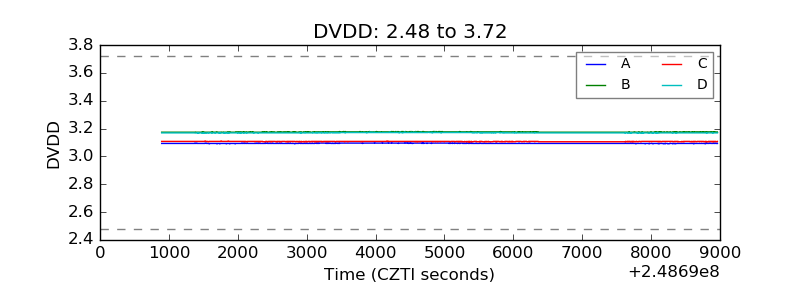 |
| Temperature 1 | 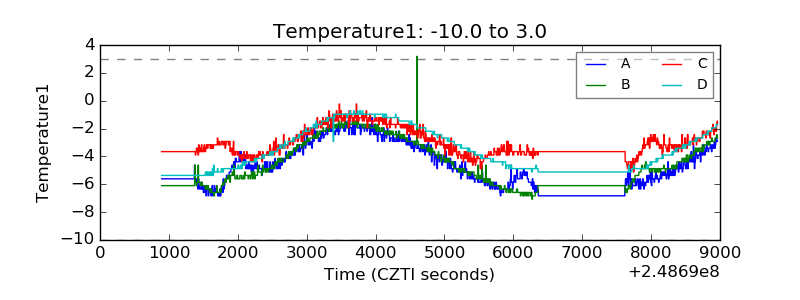 |
| Veto HV Monitor | 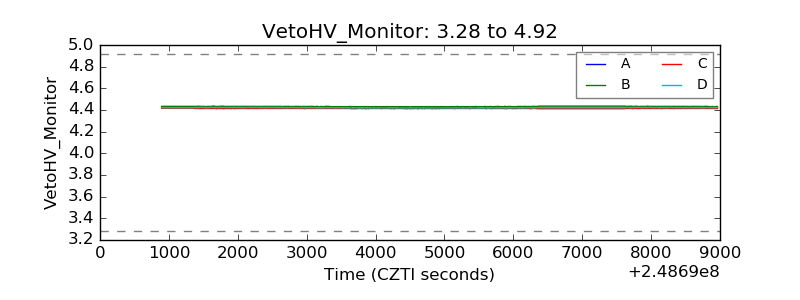 |
| Veto LLD | 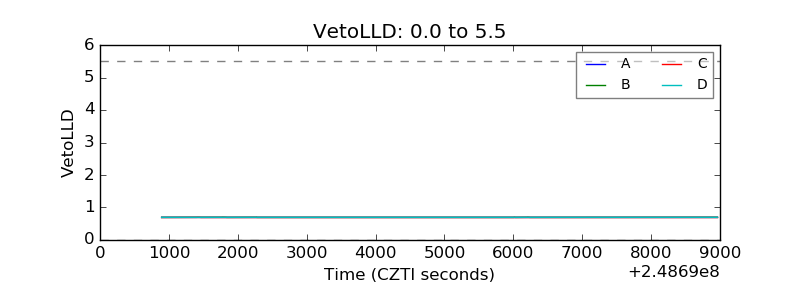 |
| Alpha Counter | 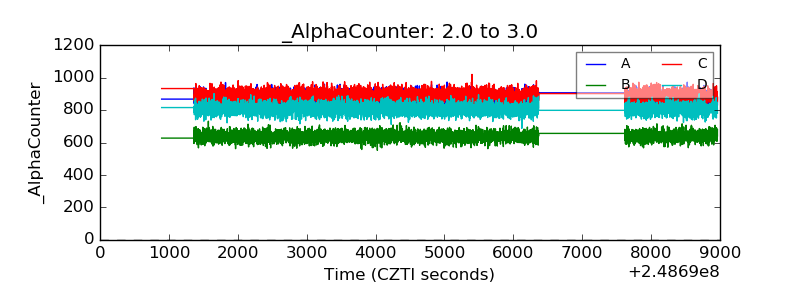 |
| _CPM_Rate | 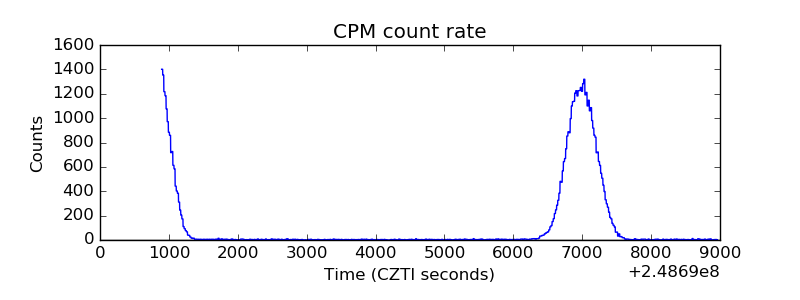 |
| CZT Counter | 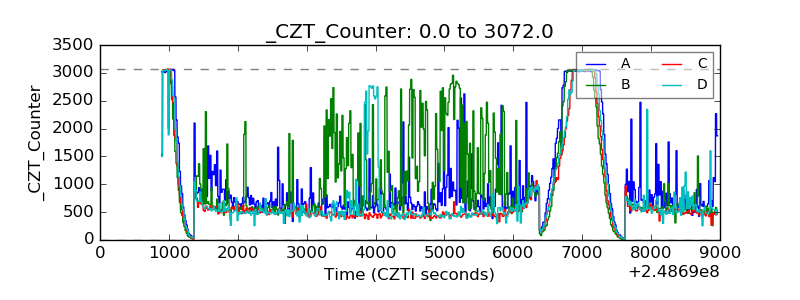 |
| +2.5 Volts monitor |  |
| +5 Volts monitor | 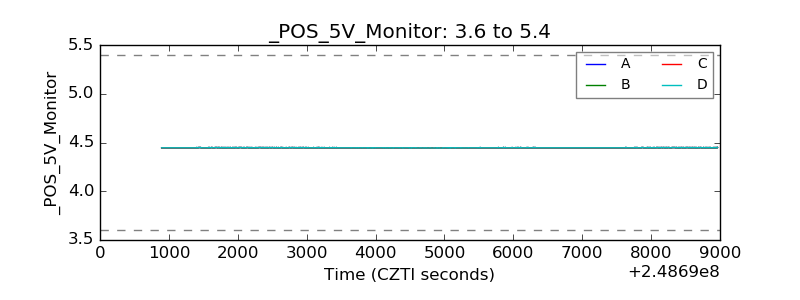 |
| _ROLL_ROT | 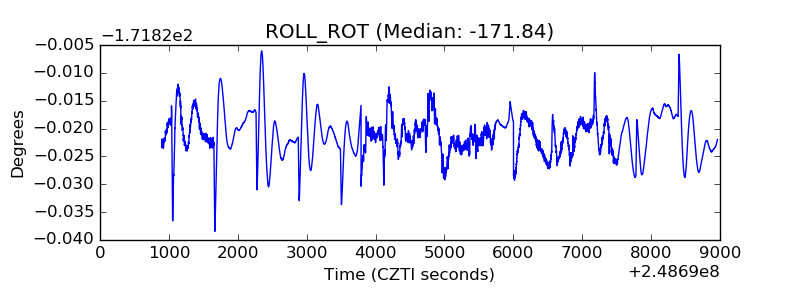 |
| _Roll_DEC | 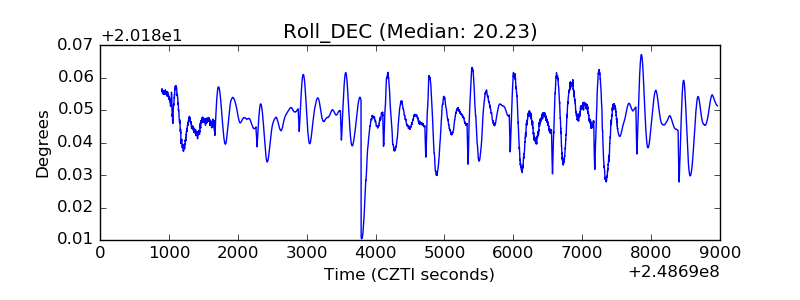 |
| _Roll_RA | 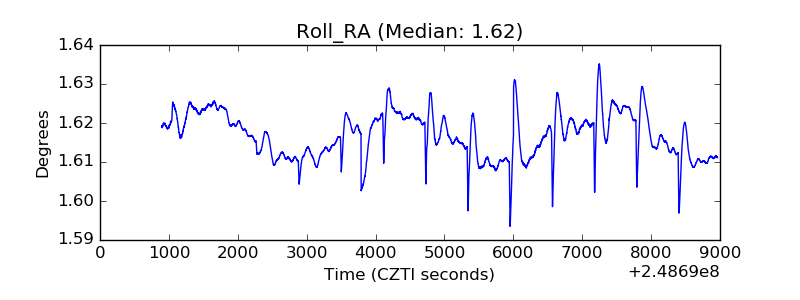 |
| Veto Counter | 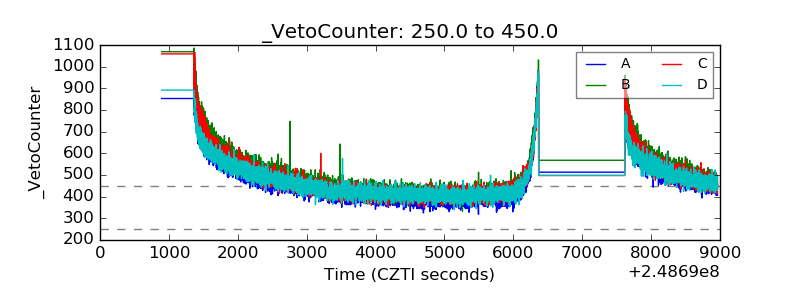 |