| Param | Original file | Final file |
|---|---|---|
| Filename | modeM0/AS1A04_137T01_9000001700_11580cztM0_level2.evt | modeM0/AS1A04_137T01_9000001700_11580cztM0_level2_quad_clean.evt |
| Size (bytes) | 571,582,080 | 92,655,360 |
| Size | 545.1 MB | 88.4 MB |
| Events in quadrant A | 5,161,356 | 588,615 |
| Events in quadrant B | 4,845,799 | 594,003 |
| Events in quadrant C | 3,002,839 | 613,235 |
| Events in quadrant D | 3,885,155 | 581,733 |
| Mode M0 | |||
|---|---|---|---|
| Quadrant | BADHDUFLAG | Total packets | Discarded packets |
| A | 0 | 19534 | 2 |
| B | 0 | 18326 | 1 |
| C | 0 | 12751 | 1 |
| D | 0 | 15368 | 1 |
| Mode SS | |||
|---|---|---|---|
| Quadrant | BADHDUFLAG | Total packets | Discarded packets |
| A | 0 | 124 | 0 |
| B | 0 | 124 | 0 |
| C | 0 | 124 | 0 |
| D | 0 | 124 | 0 |
| Mode M9 | |||
|---|---|---|---|
| Quadrant | BADHDUFLAG | Total packets | Discarded packets |
| A | 0 | 12 | 0 |
| B | 0 | 12 | 0 |
| C | 0 | 12 | 0 |
| D | 0 | 12 | 0 |
| Quadrant | Total seconds | Saturated seconds | Saturation percentage |
|---|---|---|---|
| A | 6134 | 525 | 8.558852% |
| B | 6134 | 532 | 8.672970% |
| C | 6134 | 87 | 1.418324% |
| D | 6134 | 230 | 3.749592% |
Noise dominated data is calculated using 1-second bins in cleaned event files. If a bin has >2000 counts, and if more than 50% of those come from <1% of pixels, then it is considered to be noise-dominated and hence unusable.
| Quadrant | # 1 sec bins | Bins with >0 counts | Bins with >2000 counts | High rate bins dominated by noise | Noise dominated (total time) | Noise dominated (detector-on time) | Marked lightcurve |
|---|---|---|---|---|---|---|---|
| A | 7340 | 6136 | 283 | 283 | 3.86% | 4.61% | 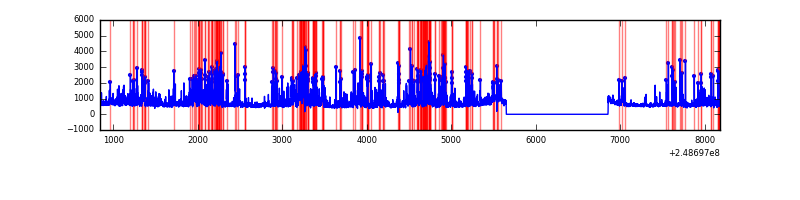 |
| B | 7340 | 6136 | 311 | 311 | 4.24% | 5.07% | 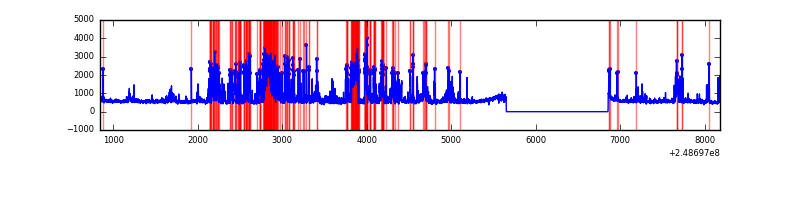 |
| C | 7340 | 6136 | 5 | 5 | 0.07% | 0.08% |  |
| D | 7340 | 6136 | 134 | 134 | 1.83% | 2.18% | 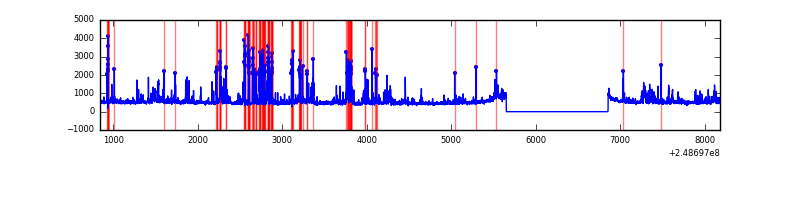 |
Top three noisy pixels from each quadrant. If the there are fewer than three noisy pixels in the level2.evt file, extra rows are filled as -1
| Pixel properties | Quadrant properties | ||||||
|---|---|---|---|---|---|---|---|
| Quadrant | DetID | PixID | Counts | Sigma | Mean | Median | Sigma |
| A | 8 | 5 | 1973223 | 12498.79 | 779 | 765 | 157.8 |
| A | 1 | 162 | 53663 | 335.2 | 779 | 765 | 157.8 |
| A | 13 | 251 | 34829 | 215.85 | 779 | 765 | 157.8 |
| B | 4 | 239 | 1074582 | 7266.79 | 774 | 757 | 147.8 |
| B | 3 | 64 | 396985 | 2681.35 | 774 | 757 | 147.8 |
| B | 11 | 51 | 125439 | 843.75 | 774 | 757 | 147.8 |
| C | 14 | 234 | 24651 | 135.68 | 763 | 770 | 176.0 |
| C | 13 | 61 | 5559 | 27.21 | 763 | 770 | 176.0 |
| C | 12 | 4 | 3445 | 15.2 | 763 | 770 | 176.0 |
| D | 10 | 253 | 275380 | 1514.86 | 763 | 744 | 181.3 |
| D | 1 | 52 | 224067 | 1231.82 | 763 | 744 | 181.3 |
| D | 2 | 120 | 134374 | 737.09 | 763 | 744 | 181.3 |
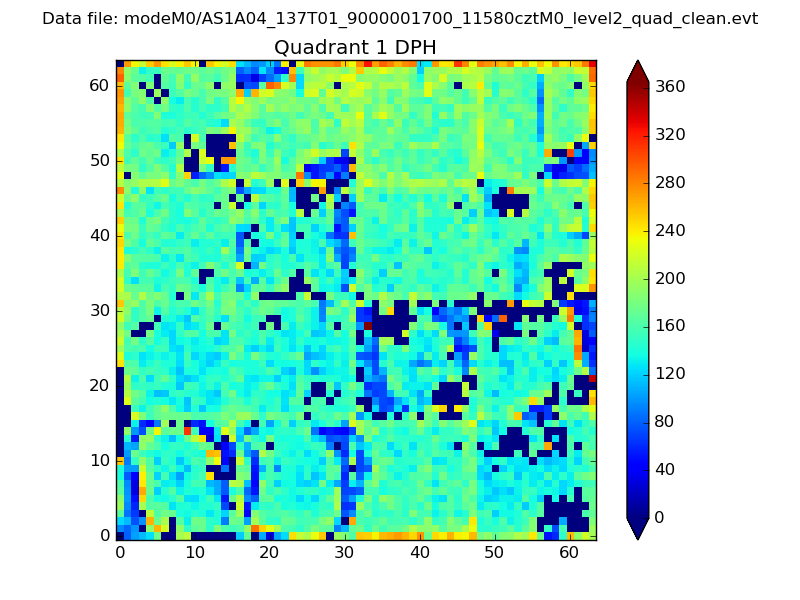
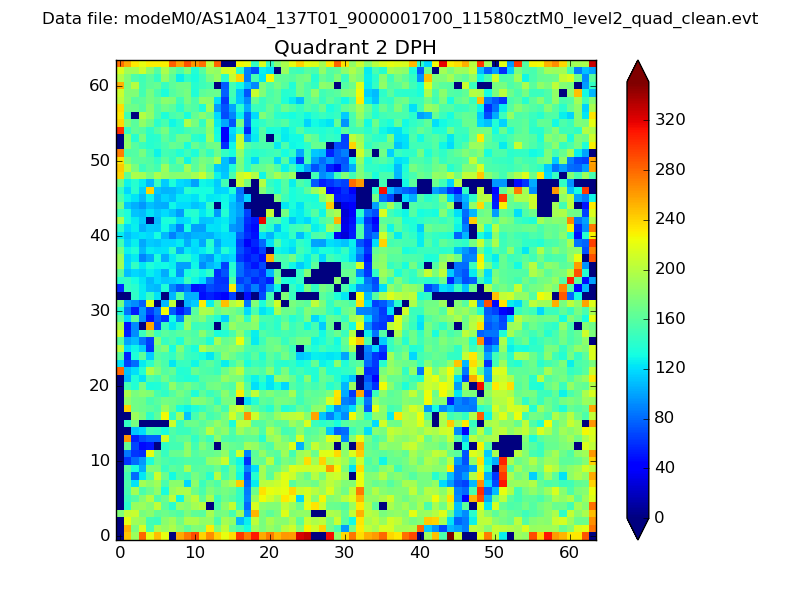
Histogram calculated using DETX and DETY for each event in the final _common_clean file
| Quadrant A | 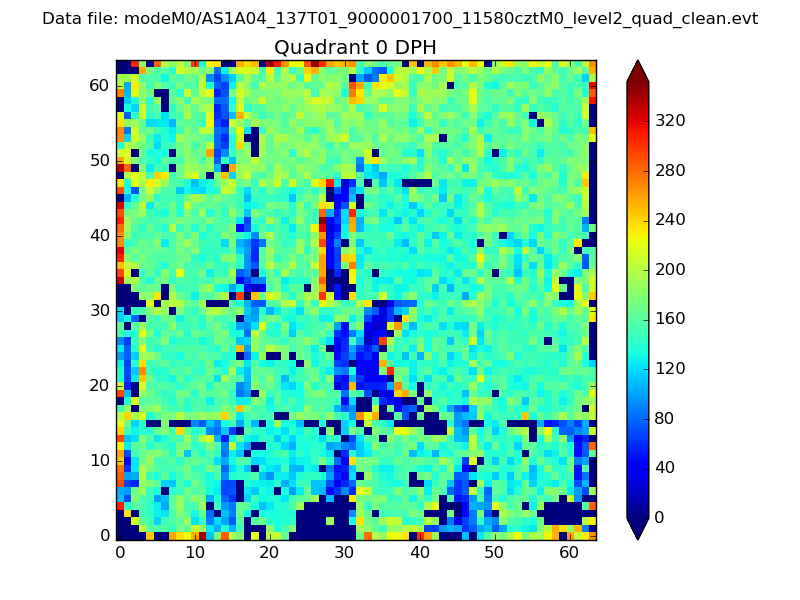 |
 |
Quadrant B |
|---|---|---|---|
| Quadrant D |  |
 |
Quadrant C |
| Plot type | Count rate plots | Images |
|---|---|---|
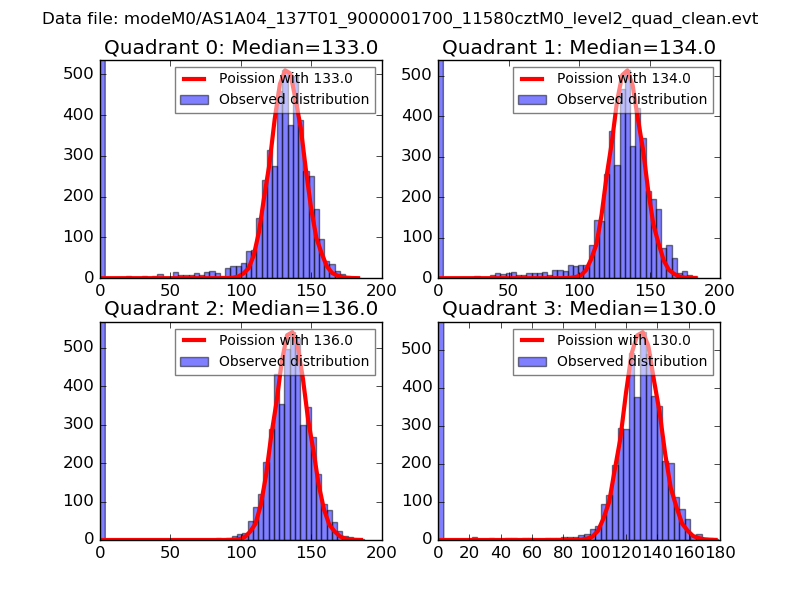
| Comparison with Poisson distribution Blue bars denote a histogram of data divided into 1 sec bins. Red curve is a Poisson curve with rate = median count rate of data. |
 |
 |
| Quadrant-wise count rates Data is divided into 100 sec bins |
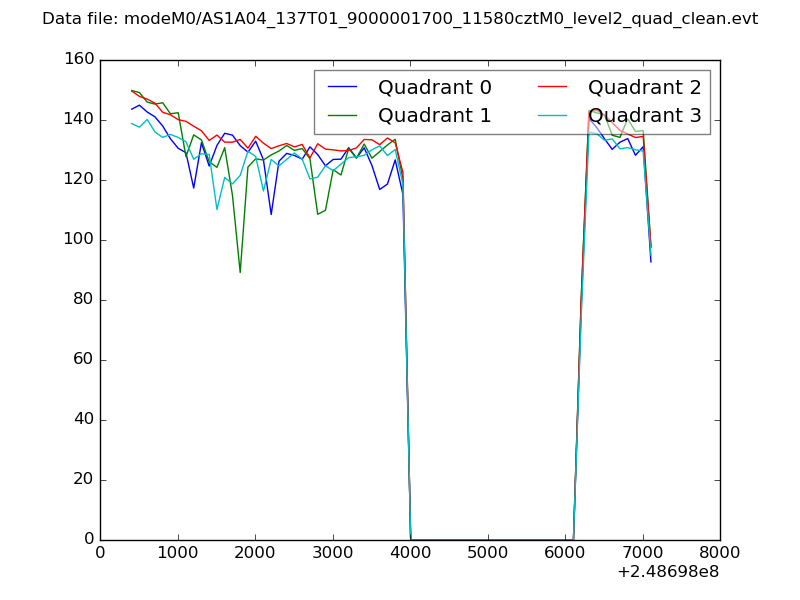 |
|
| Module-wise count rates for Quadrant A Data is divided into 100 sec bins |
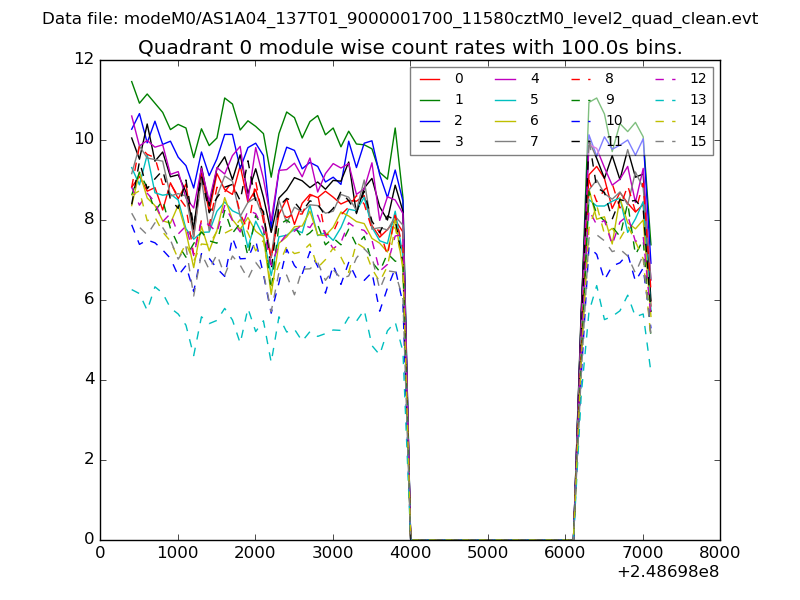 |
 |
| Module-wise count rates for Quadrant B Data is divided into 100 sec bins |
 |
 |
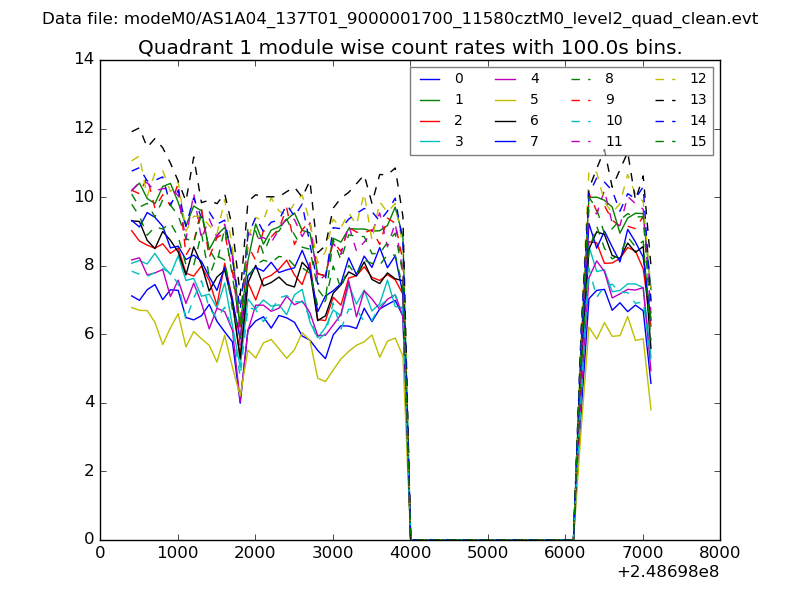
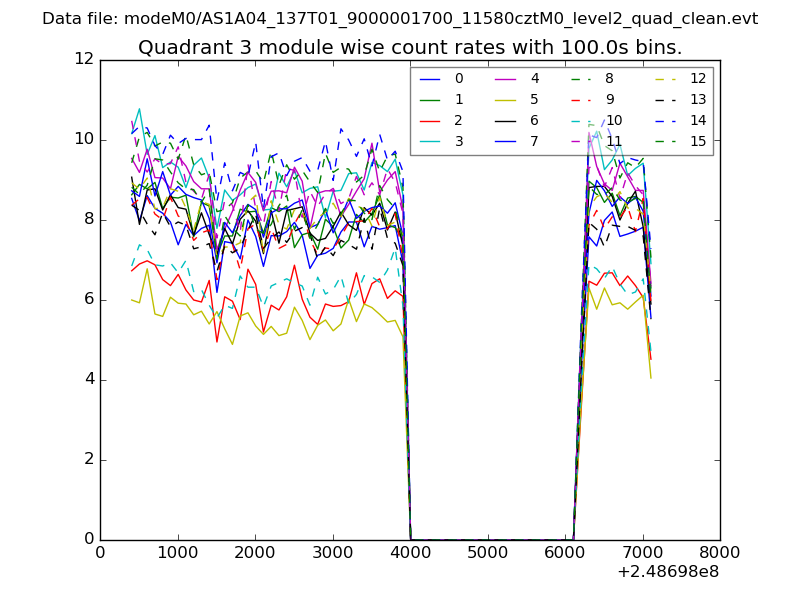
| Module-wise count rates for Quadrant C Data is divided into 100 sec bins |
 |
 |
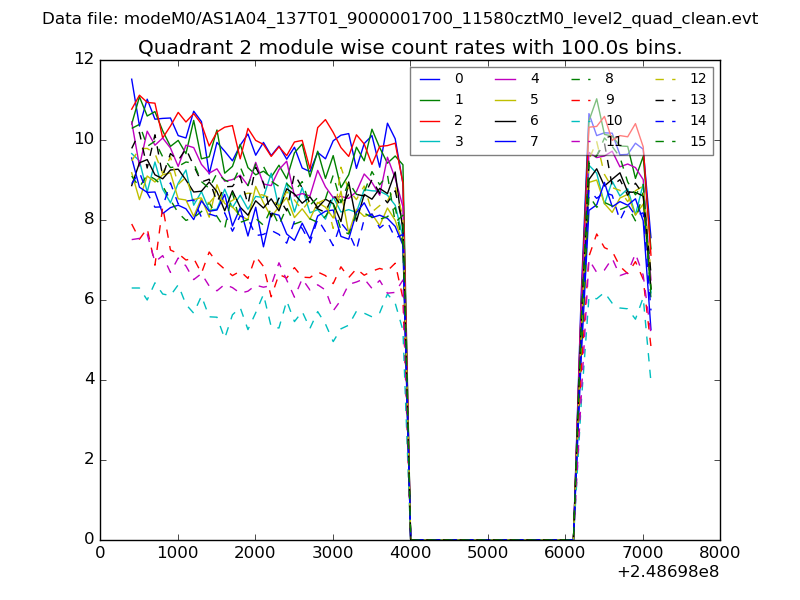
| Module-wise count rates for Quadrant D Data is divided into 100 sec bins |
 |
 |
| Parameter | Plot |
|---|---|
| CZT HV Monitor | 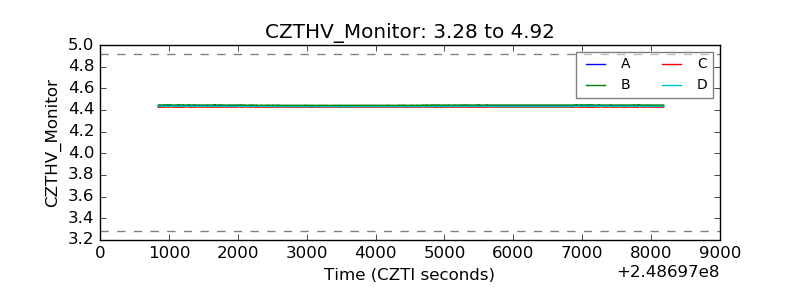 |
| D_VDD | 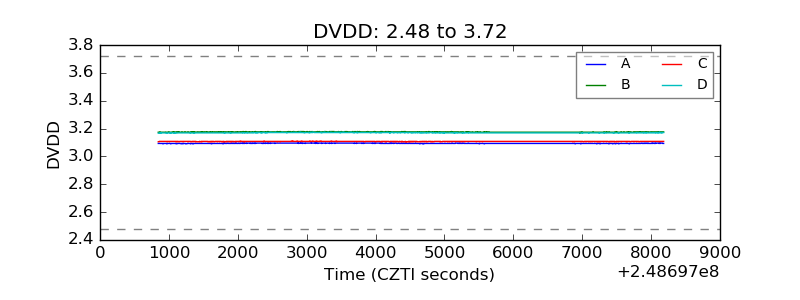 |
| Temperature 1 | 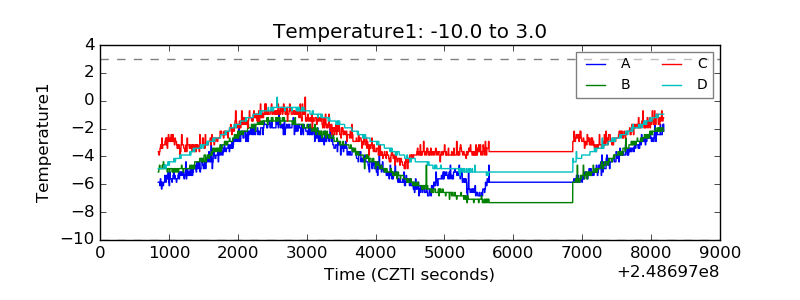 |
| Veto HV Monitor | 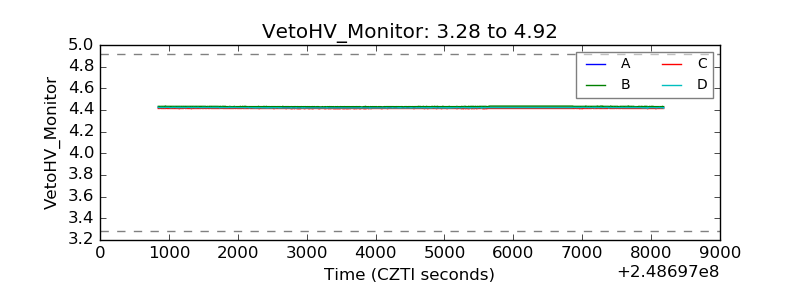 |
| Veto LLD | 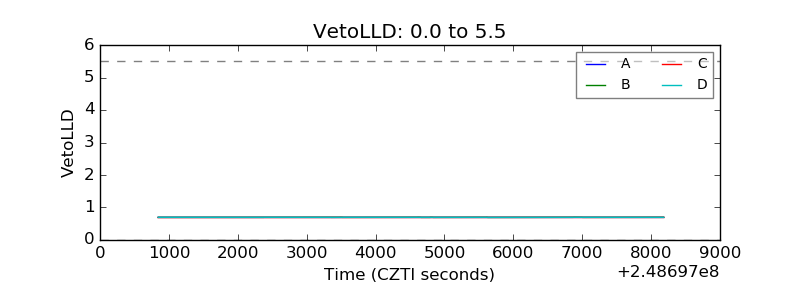 |
| Alpha Counter | 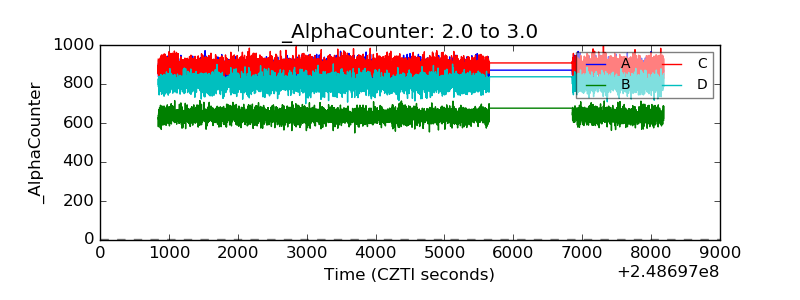 |
| _CPM_Rate | 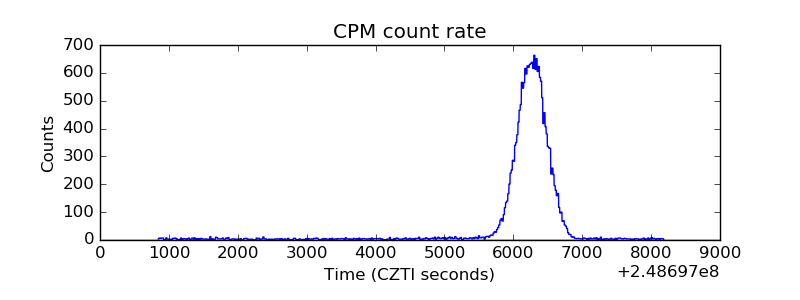 |
| CZT Counter | 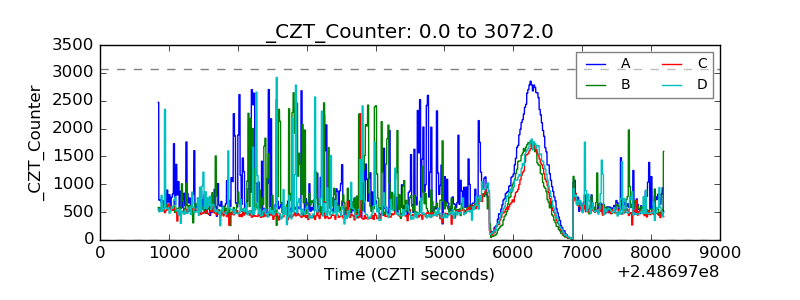 |
| +2.5 Volts monitor |  |
| +5 Volts monitor |  |
| _ROLL_ROT | 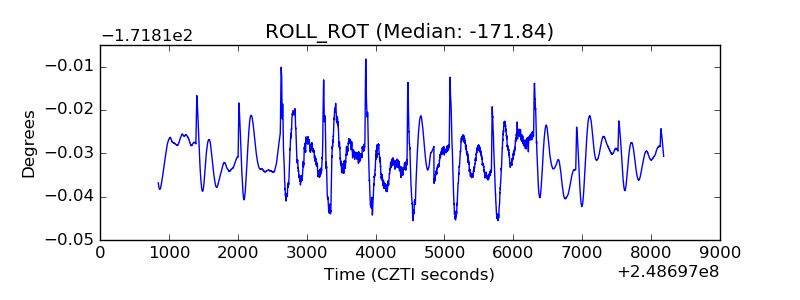 |
| _Roll_DEC | 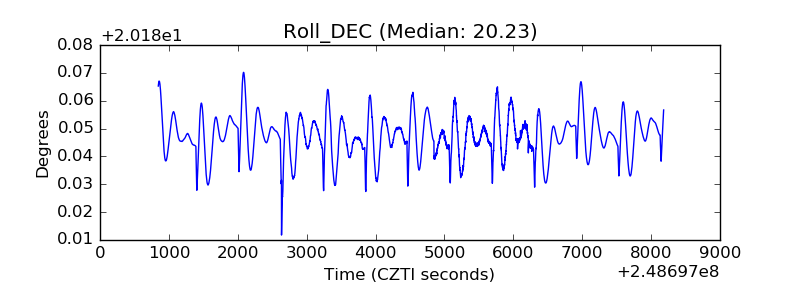 |
| _Roll_RA | 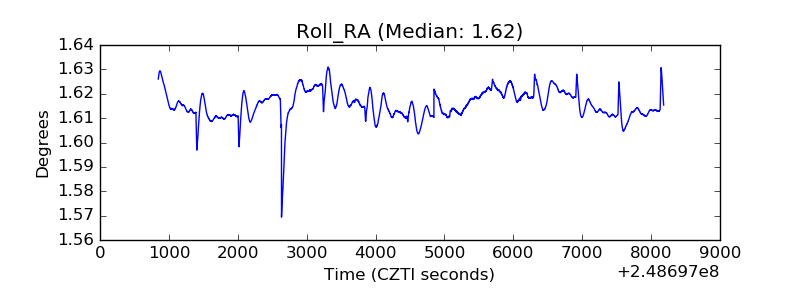 |
| Veto Counter | 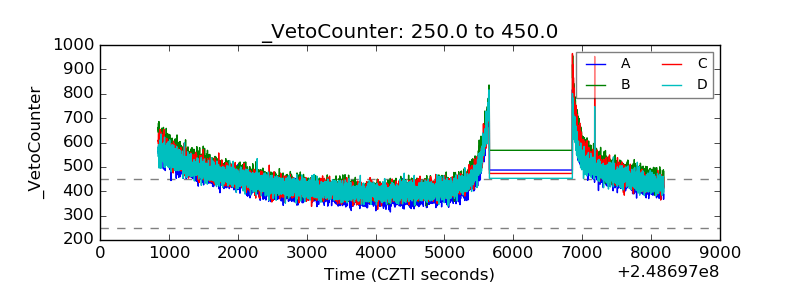 |