| Param | Original file | Final file |
|---|---|---|
| Filename | modeM0/AS1A04_137T01_9000001700_11581cztM0_level2.evt | modeM0/AS1A04_137T01_9000001700_11581cztM0_level2_quad_clean.evt |
| Size (bytes) | 609,128,640 | 99,492,480 |
| Size | 580.9 MB | 94.9 MB |
| Events in quadrant A | 5,549,589 | 625,622 |
| Events in quadrant B | 4,789,319 | 636,902 |
| Events in quadrant C | 3,215,978 | 658,660 |
| Events in quadrant D | 4,436,349 | 622,087 |
| Mode M0 | |||
|---|---|---|---|
| Quadrant | BADHDUFLAG | Total packets | Discarded packets |
| A | 0 | 21027 | 3 |
| B | 0 | 18487 | 2 |
| C | 0 | 13979 | 2 |
| D | 0 | 17531 | 2 |
| Mode SS | |||
|---|---|---|---|
| Quadrant | BADHDUFLAG | Total packets | Discarded packets |
| A | 0 | 140 | 0 |
| B | 0 | 140 | 0 |
| C | 0 | 140 | 0 |
| D | 0 | 140 | 0 |
| Mode M9 | |||
|---|---|---|---|
| Quadrant | BADHDUFLAG | Total packets | Discarded packets |
| A | 0 | 22 | 0 |
| B | 0 | 22 | 0 |
| C | 0 | 22 | 0 |
| D | 0 | 22 | 0 |
| Quadrant | Total seconds | Saturated seconds | Saturation percentage |
|---|---|---|---|
| A | 6728 | 725 | 10.775862% |
| B | 6728 | 541 | 8.041023% |
| C | 6728 | 129 | 1.917360% |
| D | 6728 | 332 | 4.934602% |
Noise dominated data is calculated using 1-second bins in cleaned event files. If a bin has >2000 counts, and if more than 50% of those come from <1% of pixels, then it is considered to be noise-dominated and hence unusable.
| Quadrant | # 1 sec bins | Bins with >0 counts | Bins with >2000 counts | High rate bins dominated by noise | Noise dominated (total time) | Noise dominated (detector-on time) | Marked lightcurve |
|---|---|---|---|---|---|---|---|
| A | 8939 | 6730 | 326 | 326 | 3.65% | 4.84% | 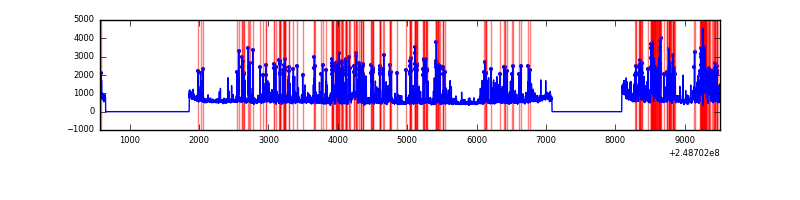 |
| B | 8939 | 6730 | 220 | 220 | 2.46% | 3.27% | 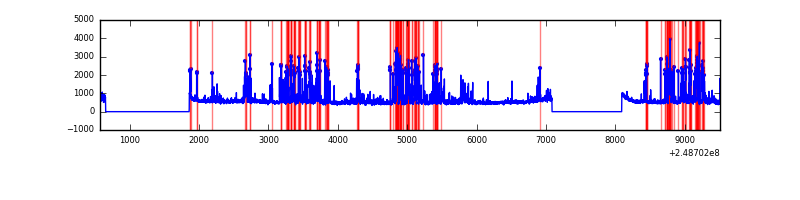 |
| C | 8939 | 6730 | 0 | 0 | 0.00% | 0.00% |  |
| D | 8939 | 6730 | 156 | 156 | 1.75% | 2.32% | 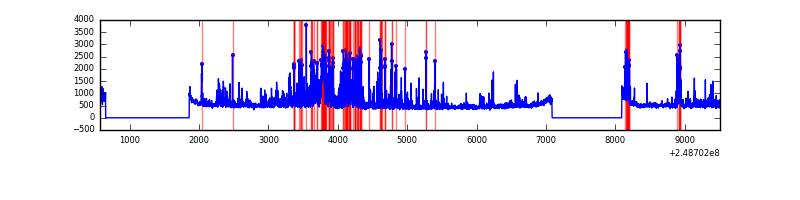 |
Top three noisy pixels from each quadrant. If the there are fewer than three noisy pixels in the level2.evt file, extra rows are filled as -1
| Pixel properties | Quadrant properties | ||||||
|---|---|---|---|---|---|---|---|
| Quadrant | DetID | PixID | Counts | Sigma | Mean | Median | Sigma |
| A | 8 | 5 | 2089368 | 12314.56 | 832 | 816 | 169.6 |
| A | 9 | 143 | 85269 | 497.95 | 832 | 816 | 169.6 |
| A | 1 | 162 | 50966 | 295.7 | 832 | 816 | 169.6 |
| B | 4 | 239 | 1217614 | 7549.96 | 833 | 814 | 161.2 |
| B | 11 | 51 | 107349 | 661.02 | 833 | 814 | 161.2 |
| B | 15 | 204 | 99178 | 610.33 | 833 | 814 | 161.2 |
| C | 13 | 61 | 6062 | 27.57 | 823 | 829 | 189.8 |
| C | 12 | 4 | 4579 | 19.75 | 823 | 829 | 189.8 |
| C | 14 | 67 | 2843 | 10.61 | 823 | 829 | 189.8 |
| D | 1 | 52 | 406985 | 2043.64 | 823 | 801 | 198.8 |
| D | 2 | 120 | 401007 | 2013.56 | 823 | 801 | 198.8 |
| D | 10 | 253 | 213943 | 1072.38 | 823 | 801 | 198.8 |
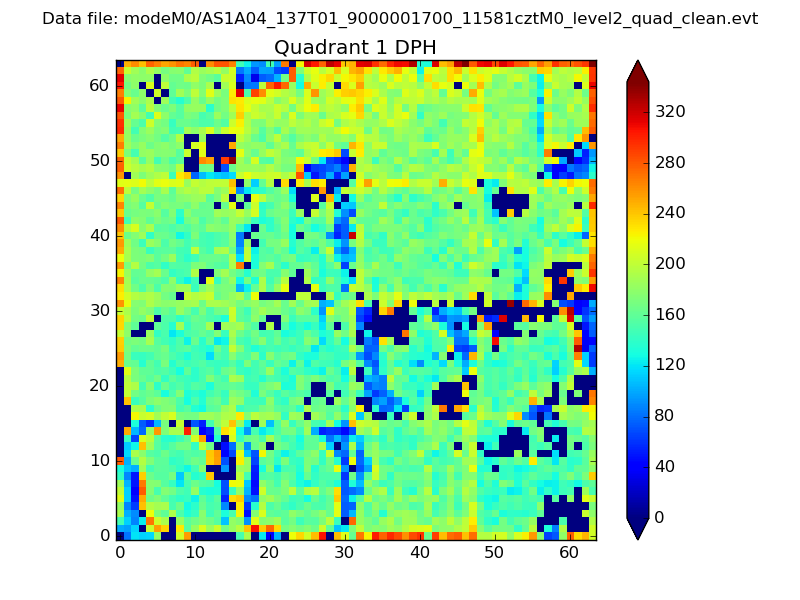
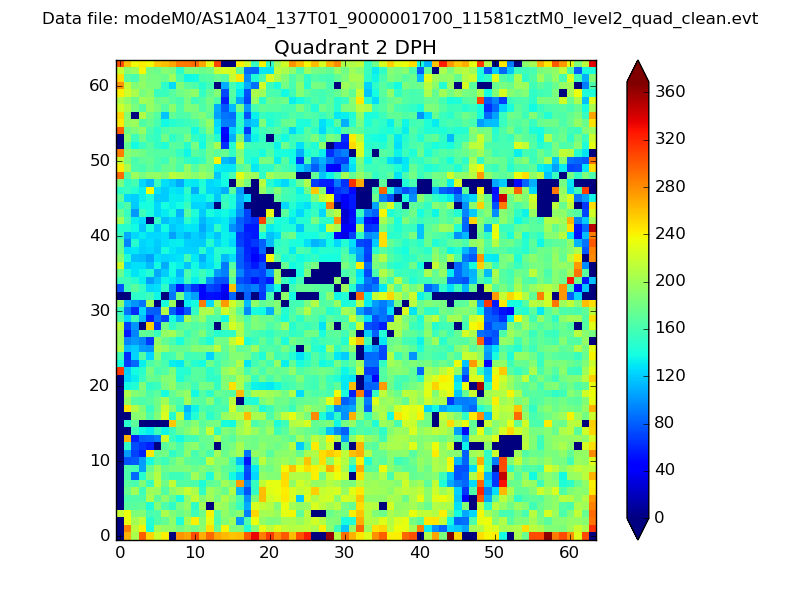
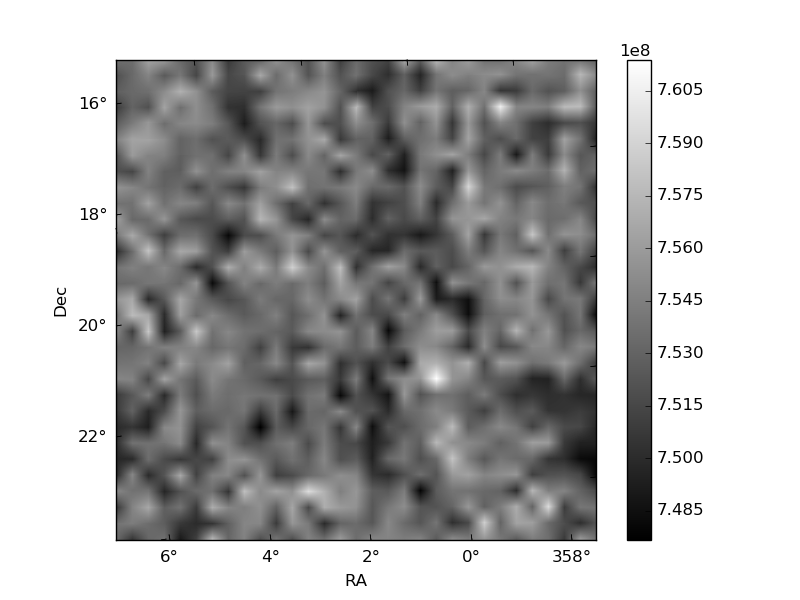
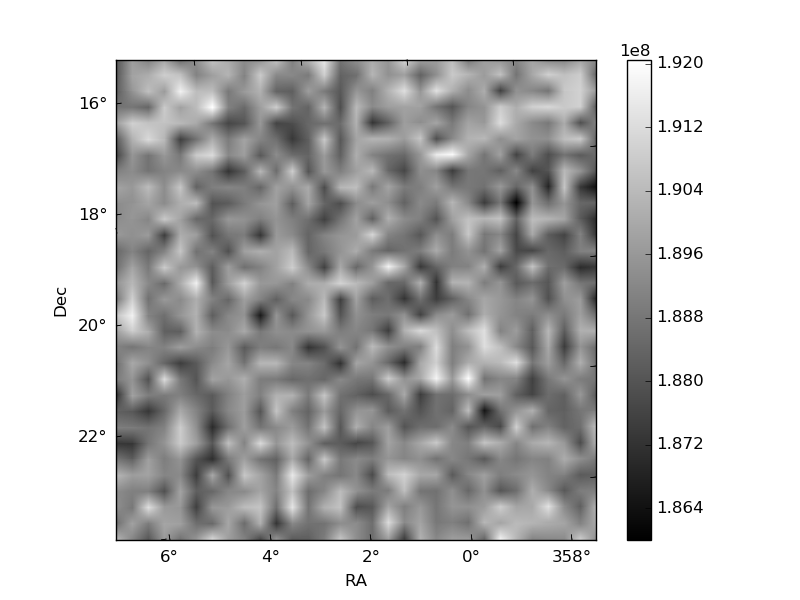
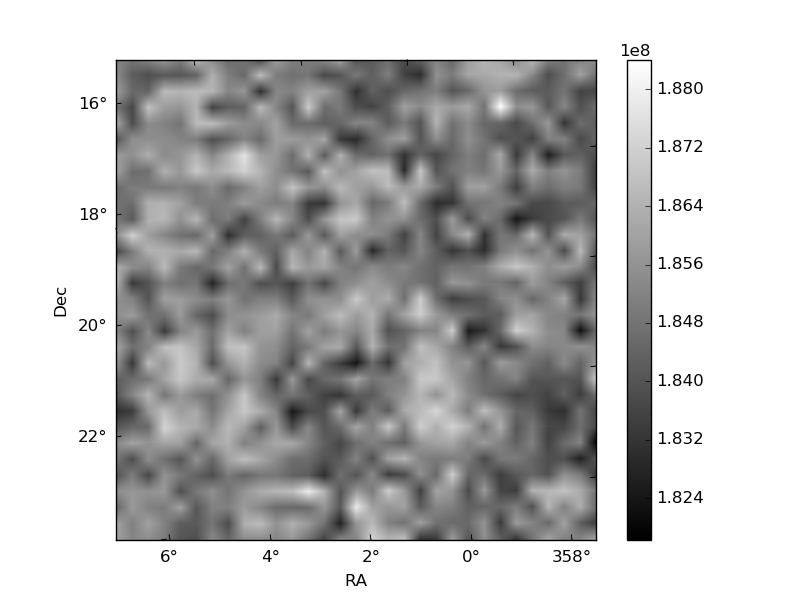
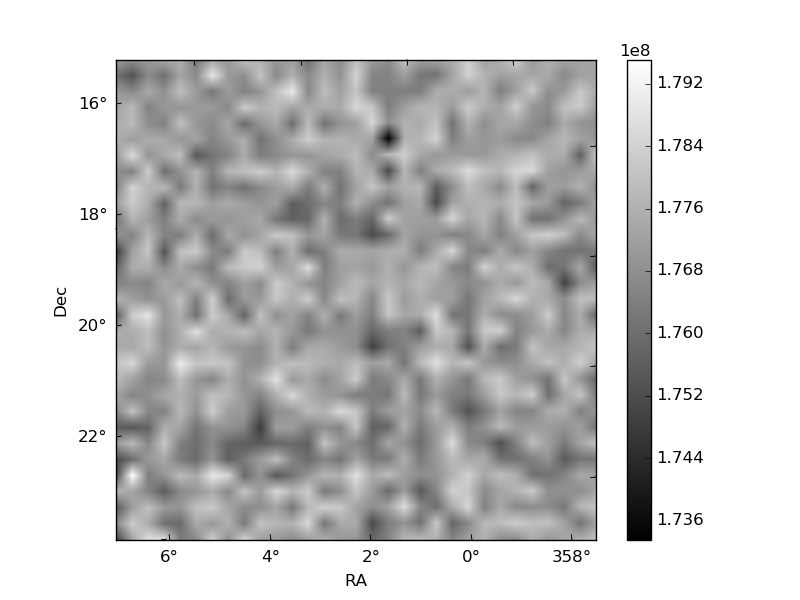
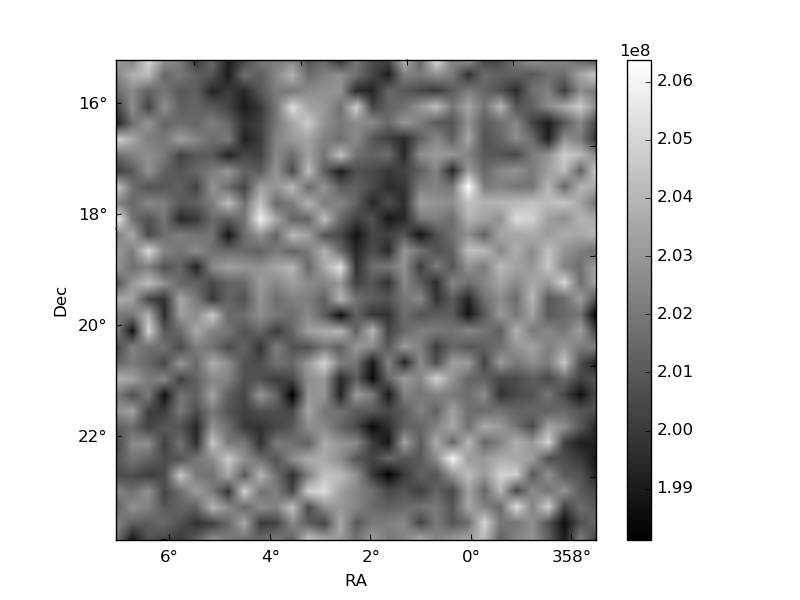
Histogram calculated using DETX and DETY for each event in the final _common_clean file
| Quadrant A | 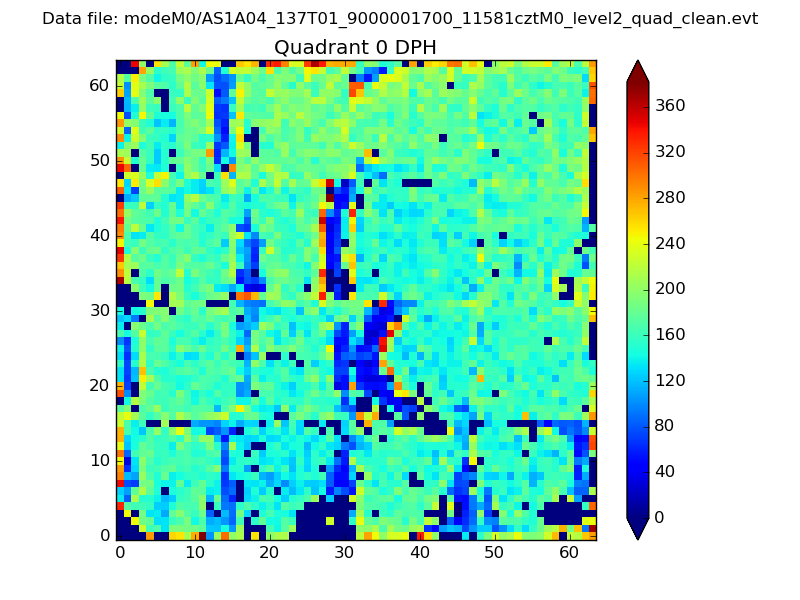 |
 |
Quadrant B |
|---|---|---|---|
| Quadrant D | 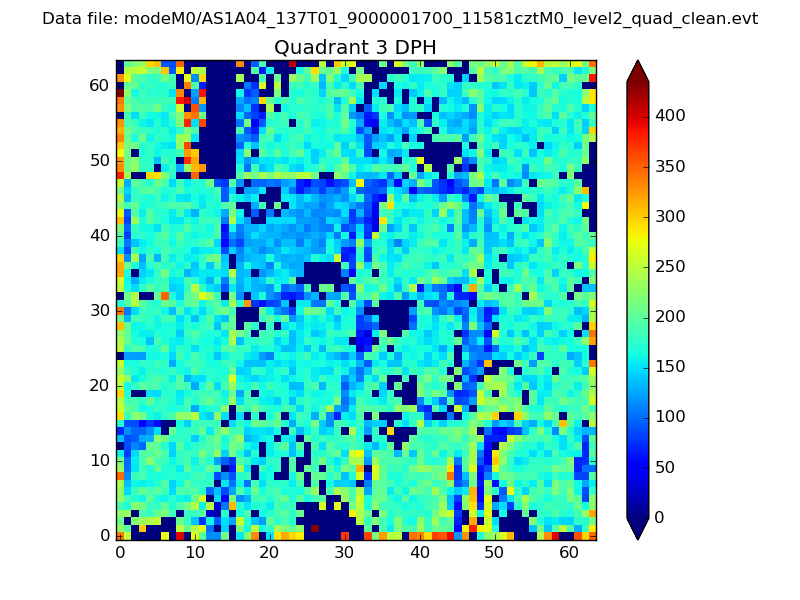 |
 |
Quadrant C |
| Plot type | Count rate plots | Images |
|---|---|---|
| Comparison with Poisson distribution Blue bars denote a histogram of data divided into 1 sec bins. Red curve is a Poisson curve with rate = median count rate of data. |
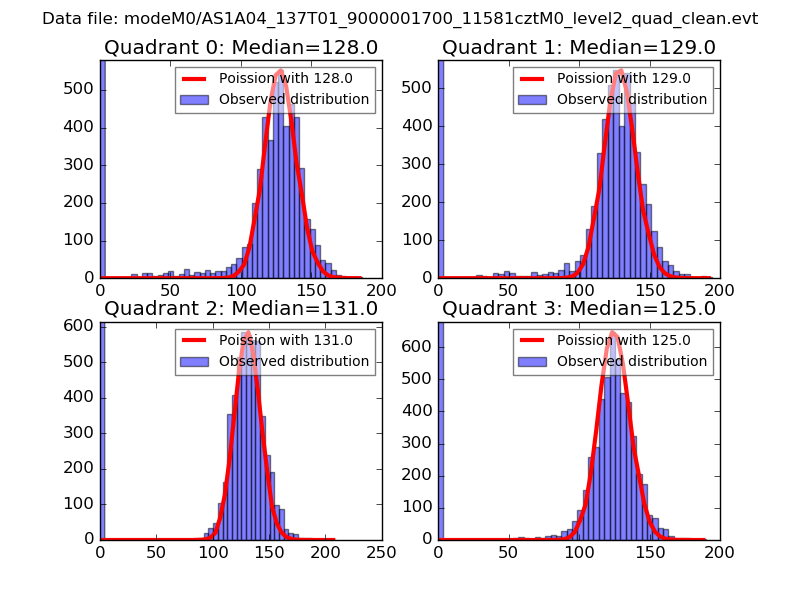 |
 |
| Quadrant-wise count rates Data is divided into 100 sec bins |
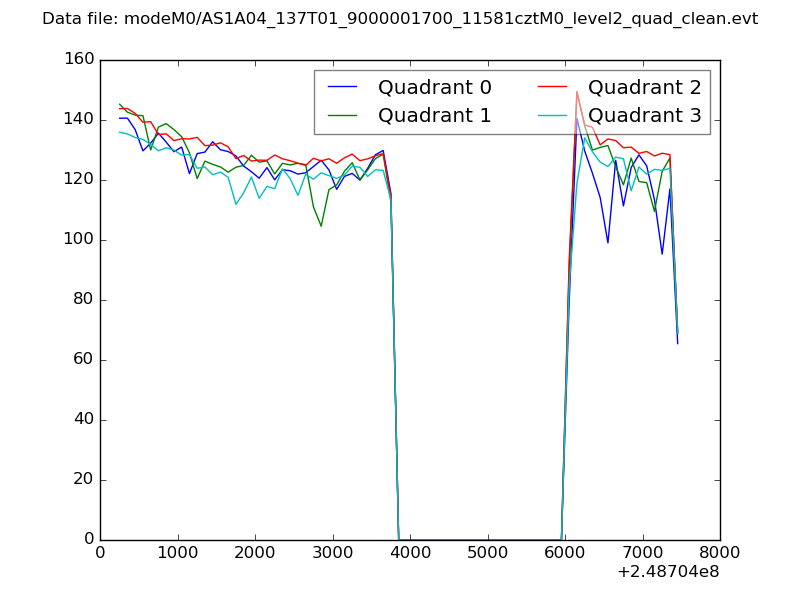 |
|
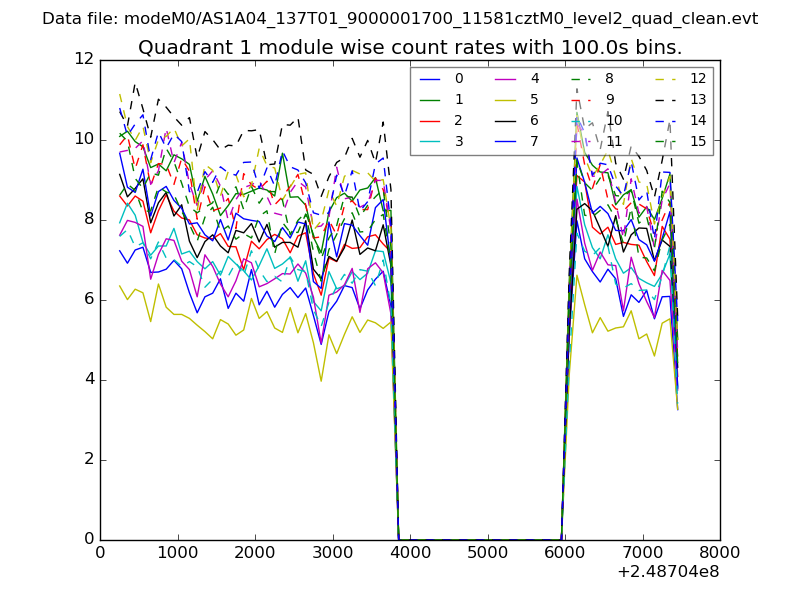
| Module-wise count rates for Quadrant A Data is divided into 100 sec bins |
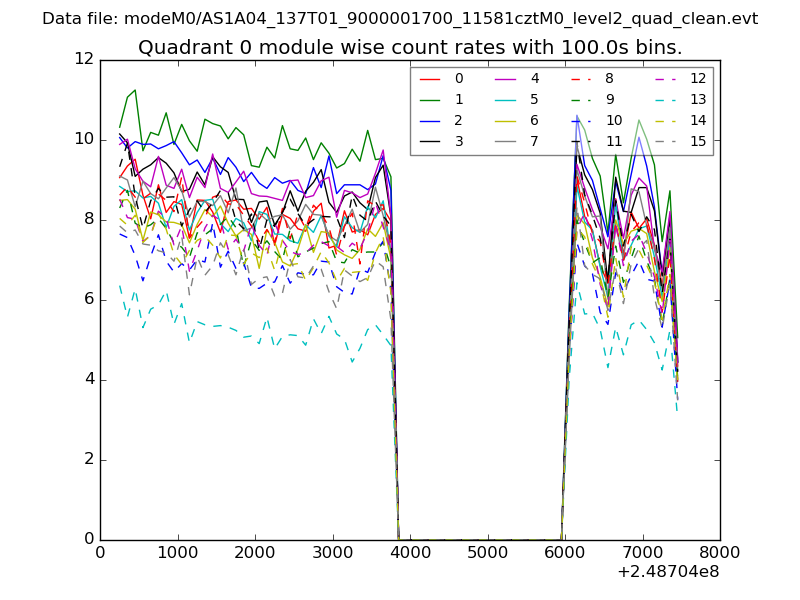 |
 |
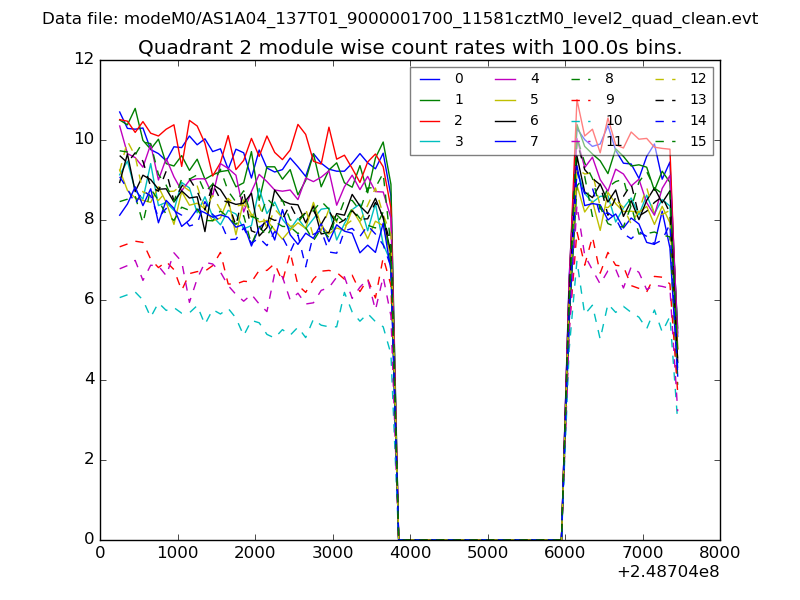
| Module-wise count rates for Quadrant B Data is divided into 100 sec bins |
 |
 |
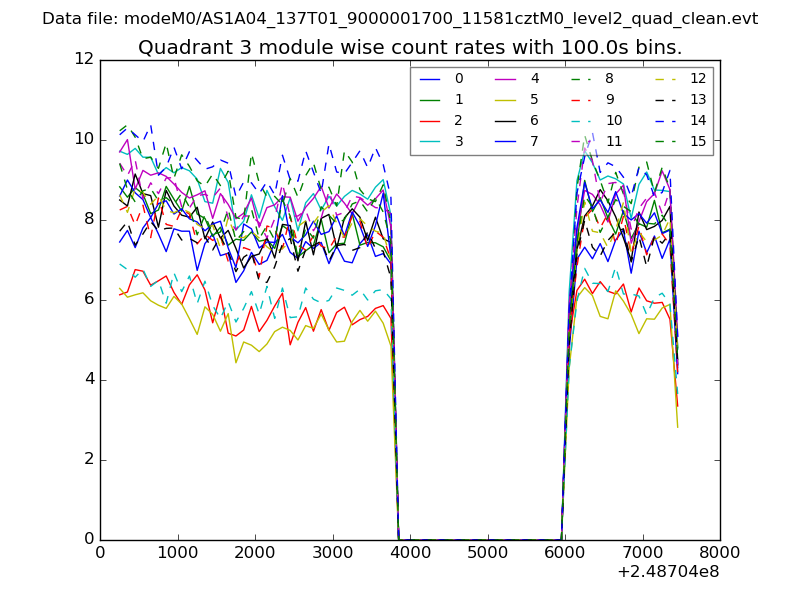
| Module-wise count rates for Quadrant C Data is divided into 100 sec bins |
 |
 |
| Module-wise count rates for Quadrant D Data is divided into 100 sec bins |
 |
 |
| Parameter | Plot |
|---|---|
| CZT HV Monitor | 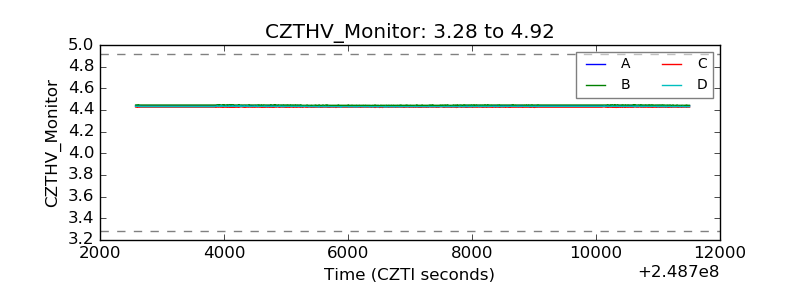 |
| D_VDD | 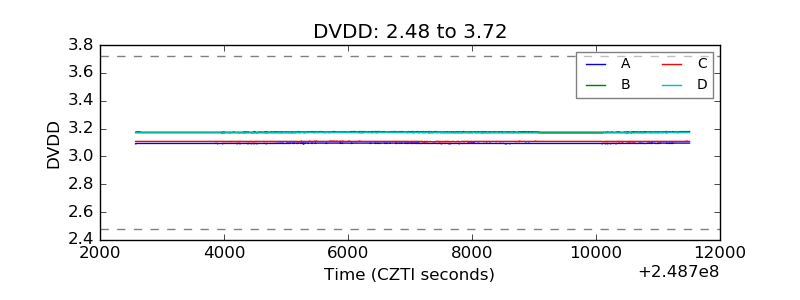 |
| Temperature 1 |  |
| Veto HV Monitor | 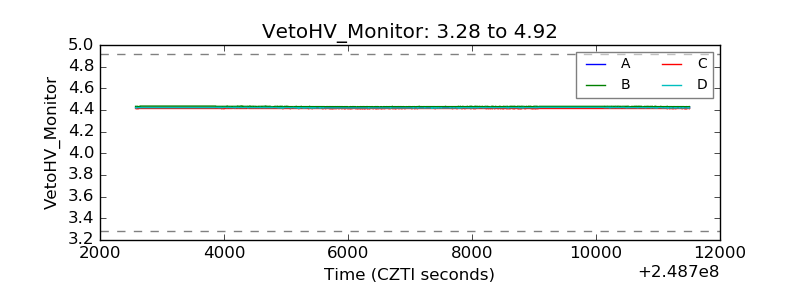 |
| Veto LLD |  |
| Alpha Counter | 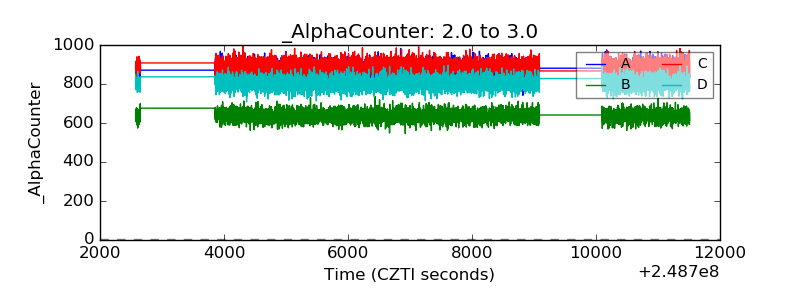 |
| _CPM_Rate | 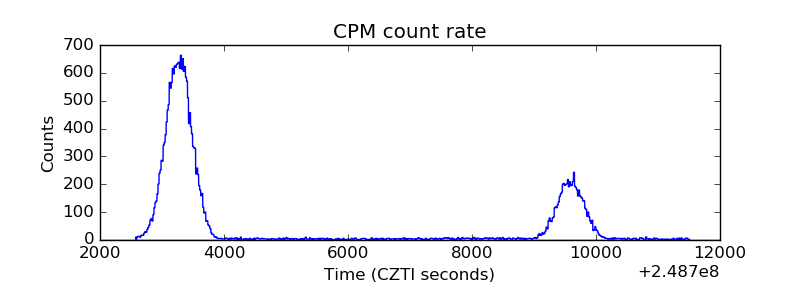 |
| CZT Counter | 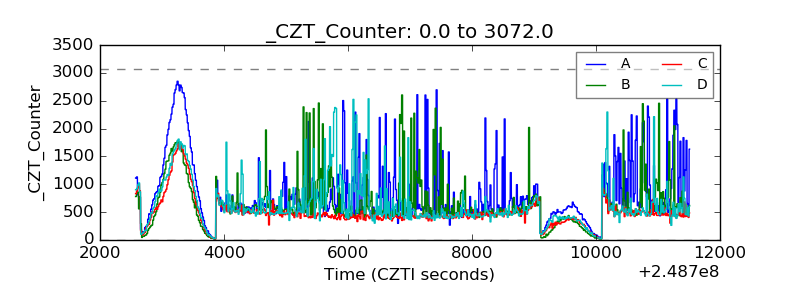 |
| +2.5 Volts monitor |  |
| +5 Volts monitor |  |
| _ROLL_ROT | 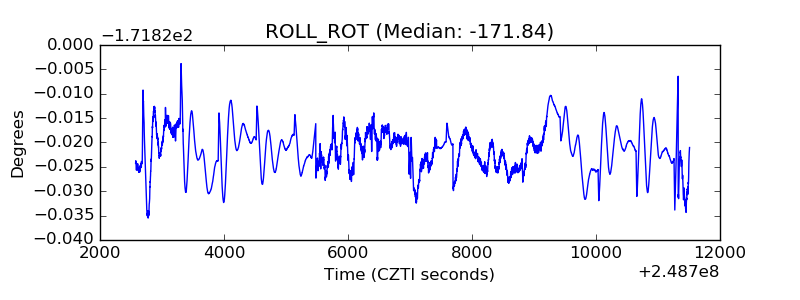 |
| _Roll_DEC | 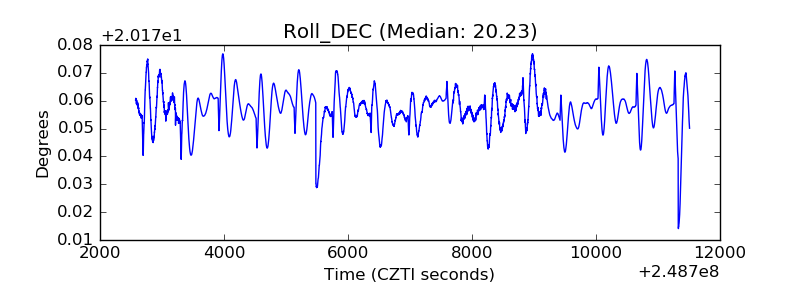 |
| _Roll_RA | 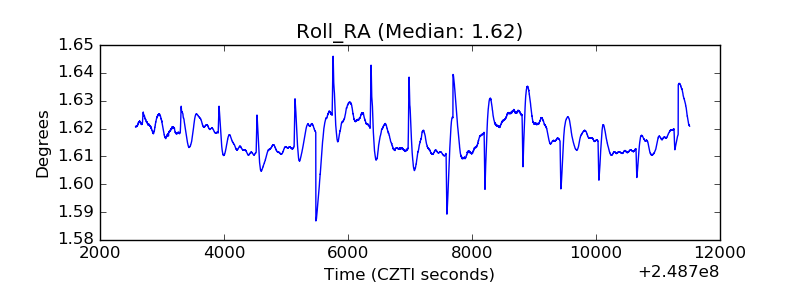 |
| Veto Counter | 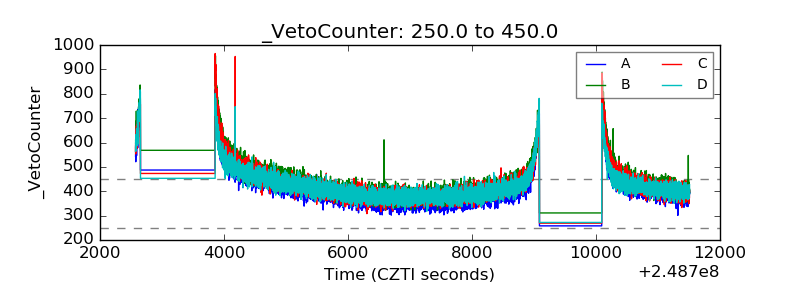 |