| Param | Original file | Final file |
|---|---|---|
| Filename | modeM0/AS1A04_137T01_9000001700_11583cztM0_level2.evt | modeM0/AS1A04_137T01_9000001700_11583cztM0_level2_quad_clean.evt |
| Size (bytes) | 224,303,040 | 35,294,400 |
| Size | 213.9 MB | 33.7 MB |
| Events in quadrant A | 1,826,866 | 231,763 |
| Events in quadrant B | 1,370,170 | 235,073 |
| Events in quadrant C | 923,852 | 247,919 |
| Events in quadrant D | 2,538,926 | 212,325 |
| Mode M0 | |||
|---|---|---|---|
| Quadrant | BADHDUFLAG | Total packets | Discarded packets |
| A | 0 | 6829 | 1 |
| B | 0 | 5299 | 1 |
| C | 0 | 4074 | 1 |
| D | 0 | 8912 | 1 |
| Mode SS | |||
|---|---|---|---|
| Quadrant | BADHDUFLAG | Total packets | Discarded packets |
| A | 0 | 38 | 0 |
| B | 0 | 38 | 0 |
| C | 0 | 38 | 0 |
| D | 0 | 38 | 0 |
| Mode M9 | |||
|---|---|---|---|
| Quadrant | BADHDUFLAG | Total packets | Discarded packets |
| A | 0 | 1 | 0 |
| B | 0 | 1 | 0 |
| C | 0 | 1 | 0 |
| D | 0 | 2 | 0 |
| Quadrant | Total seconds | Saturated seconds | Saturation percentage |
|---|---|---|---|
| A | 1940 | 199 | 10.257732% |
| B | 1940 | 158 | 8.144330% |
| C | 1940 | 6 | 0.309278% |
| D | 1940 | 444 | 22.886598% |
Noise dominated data is calculated using 1-second bins in cleaned event files. If a bin has >2000 counts, and if more than 50% of those come from <1% of pixels, then it is considered to be noise-dominated and hence unusable.
| Quadrant | # 1 sec bins | Bins with >0 counts | Bins with >2000 counts | High rate bins dominated by noise | Noise dominated (total time) | Noise dominated (detector-on time) | Marked lightcurve |
|---|---|---|---|---|---|---|---|
| A | 1941 | 1941 | 86 | 86 | 4.43% | 4.43% | 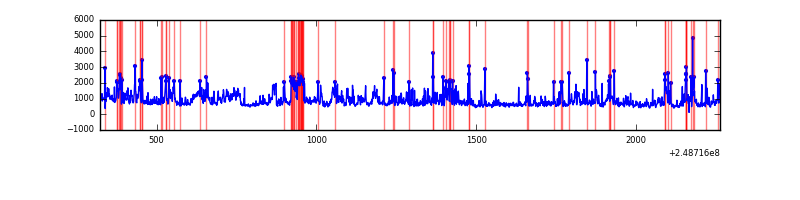 |
| B | 1941 | 1941 | 58 | 58 | 2.99% | 2.99% | 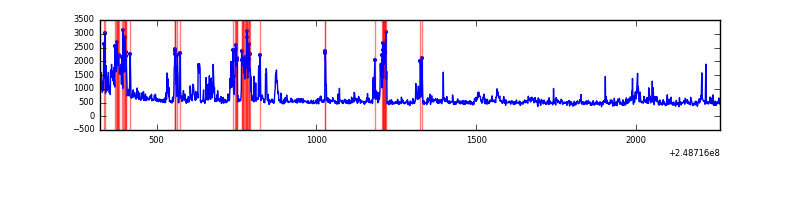 |
| C | 1941 | 1941 | 1 | 1 | 0.05% | 0.05% | 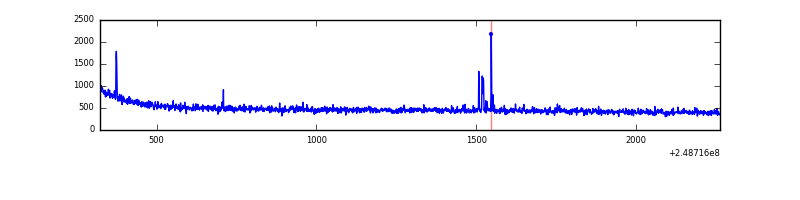 |
| D | 1941 | 1941 | 391 | 391 | 20.14% | 20.14% | 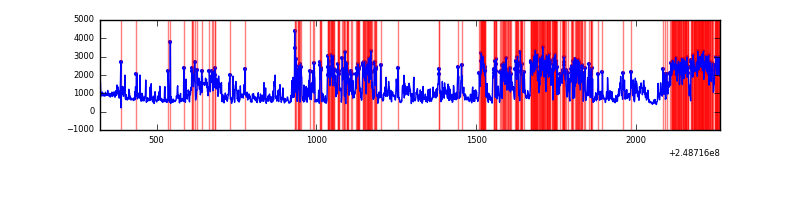 |
Top three noisy pixels from each quadrant. If the there are fewer than three noisy pixels in the level2.evt file, extra rows are filled as -1
| Pixel properties | Quadrant properties | ||||||
|---|---|---|---|---|---|---|---|
| Quadrant | DetID | PixID | Counts | Sigma | Mean | Median | Sigma |
| A | 8 | 5 | 688087 | 13536.29 | 236 | 230 | 50.8 |
| A | 9 | 143 | 83809 | 1644.74 | 236 | 230 | 50.8 |
| A | 1 | 162 | 37761 | 738.57 | 236 | 230 | 50.8 |
| B | 4 | 239 | 335265 | 7100.47 | 232 | 226 | 47.2 |
| B | 15 | 204 | 87638 | 1852.52 | 232 | 226 | 47.2 |
| B | 11 | 51 | 17907 | 374.71 | 232 | 226 | 47.2 |
| C | 0 | 207 | 10715 | 188.04 | 231 | 232 | 55.8 |
| C | 8 | 128 | 4099 | 69.36 | 231 | 232 | 55.8 |
| C | 14 | 234 | 3740 | 62.92 | 231 | 232 | 55.8 |
| D | 2 | 33 | 783749 | 14309.7 | 220 | 214 | 54.8 |
| D | 1 | 52 | 406667 | 7423.05 | 220 | 214 | 54.8 |
| D | 10 | 253 | 311894 | 5692.21 | 220 | 214 | 54.8 |
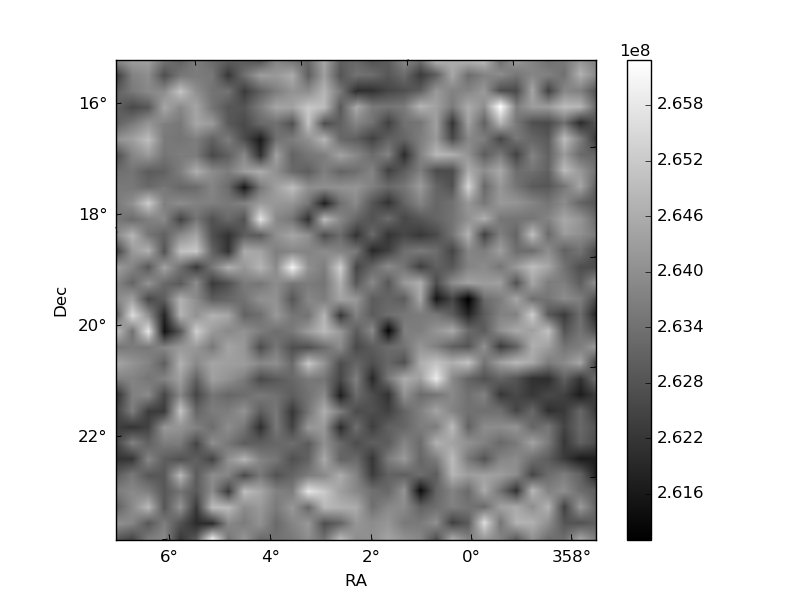
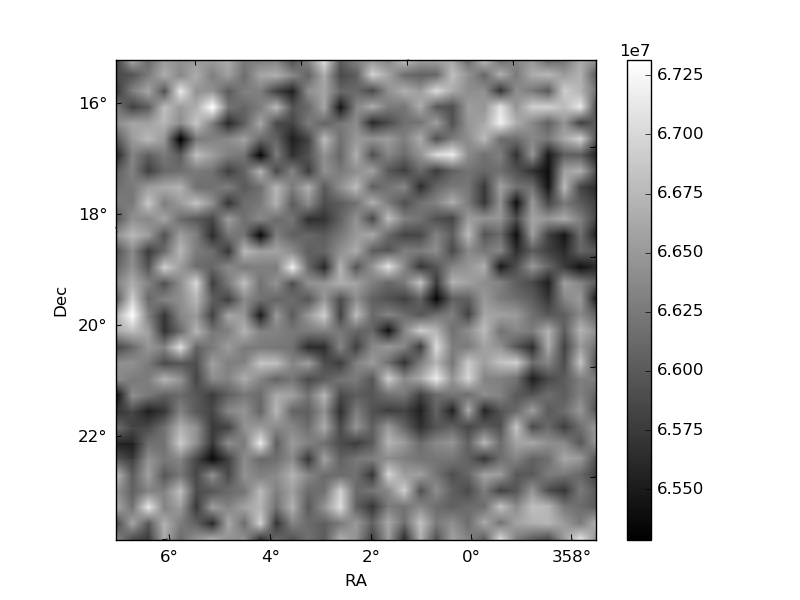
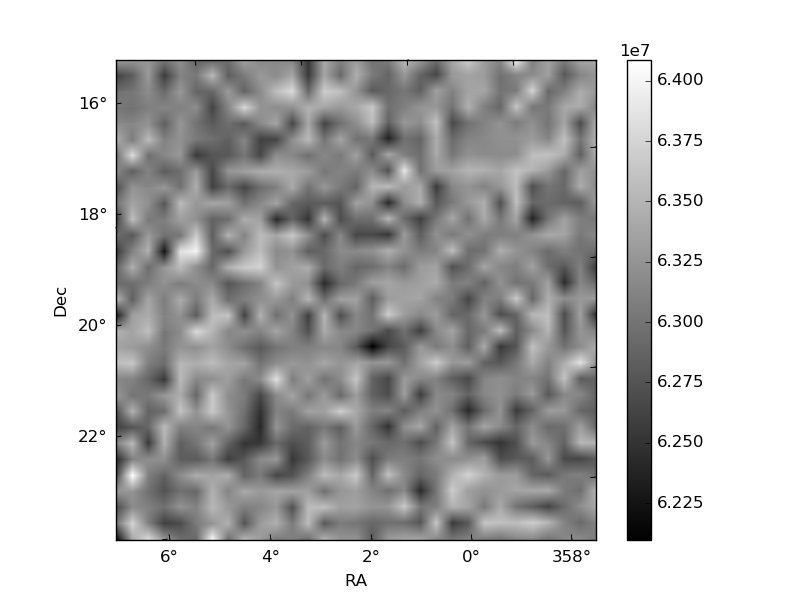
Histogram calculated using DETX and DETY for each event in the final _common_clean file
| Quadrant A | 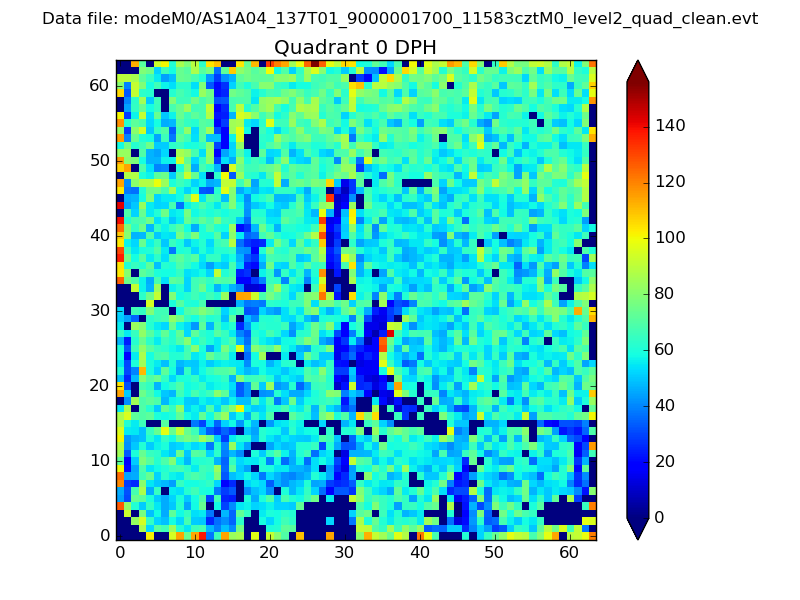 |
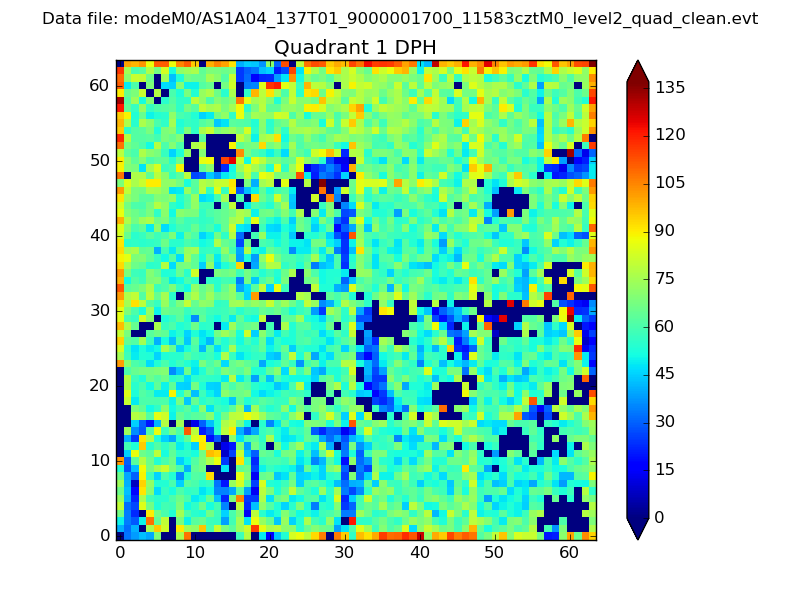 |
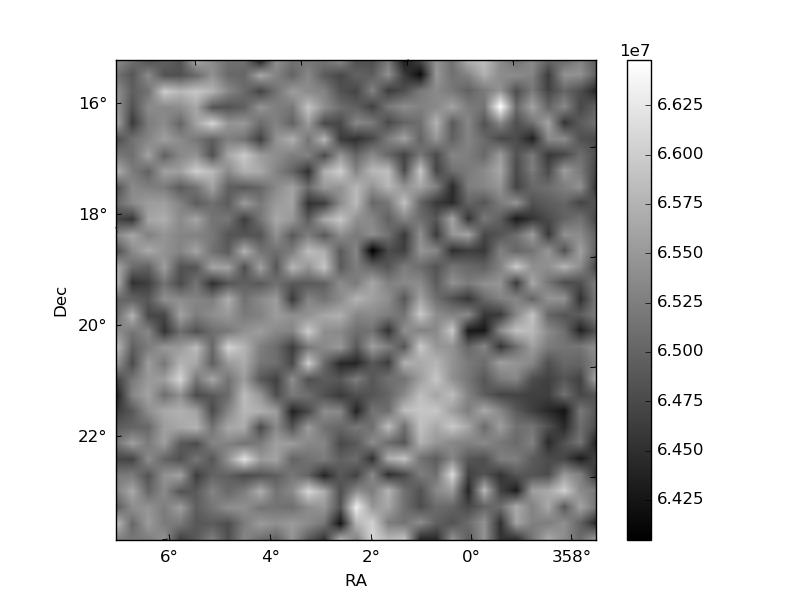
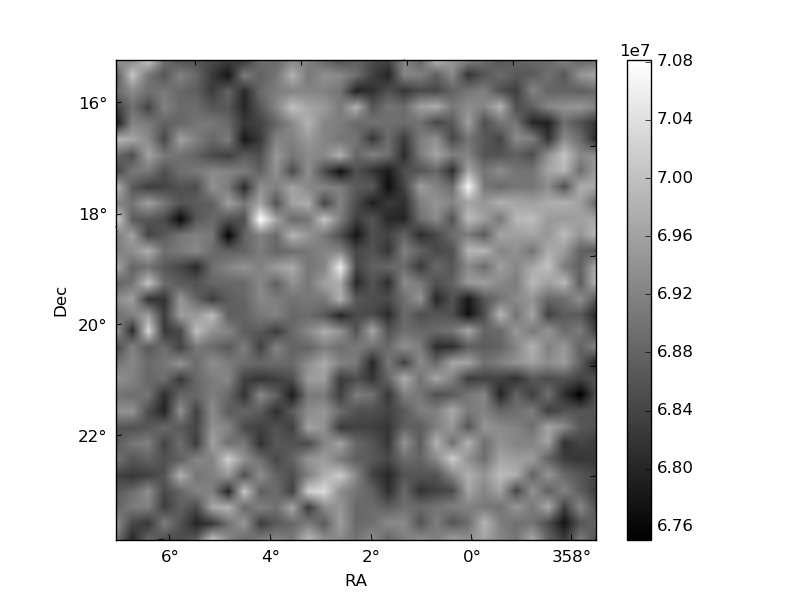
Quadrant B |
|---|---|---|---|
| Quadrant D | 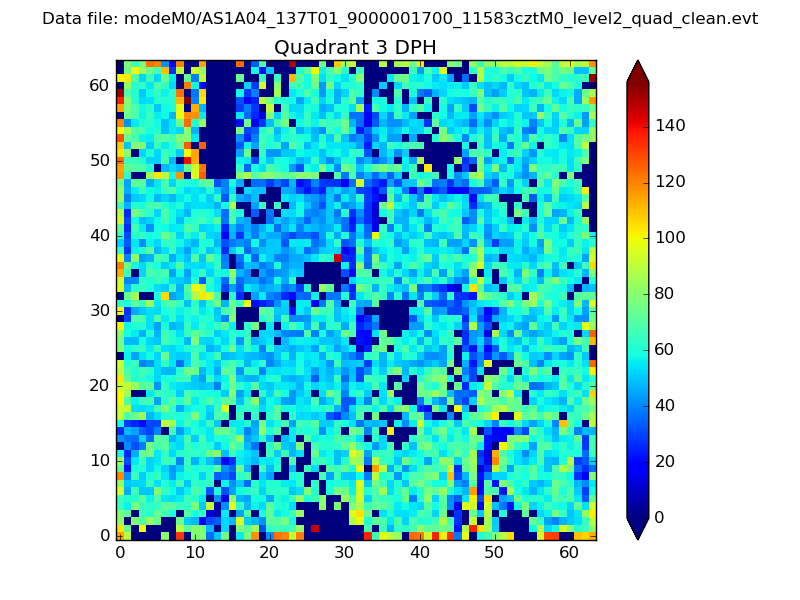 |
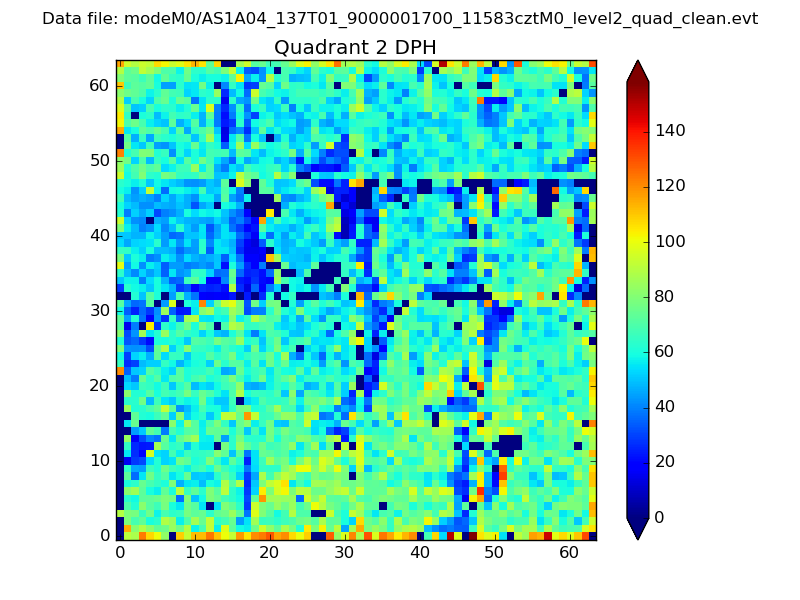 |
Quadrant C |
| Plot type | Count rate plots | Images |
|---|---|---|
| Comparison with Poisson distribution Blue bars denote a histogram of data divided into 1 sec bins. Red curve is a Poisson curve with rate = median count rate of data. |
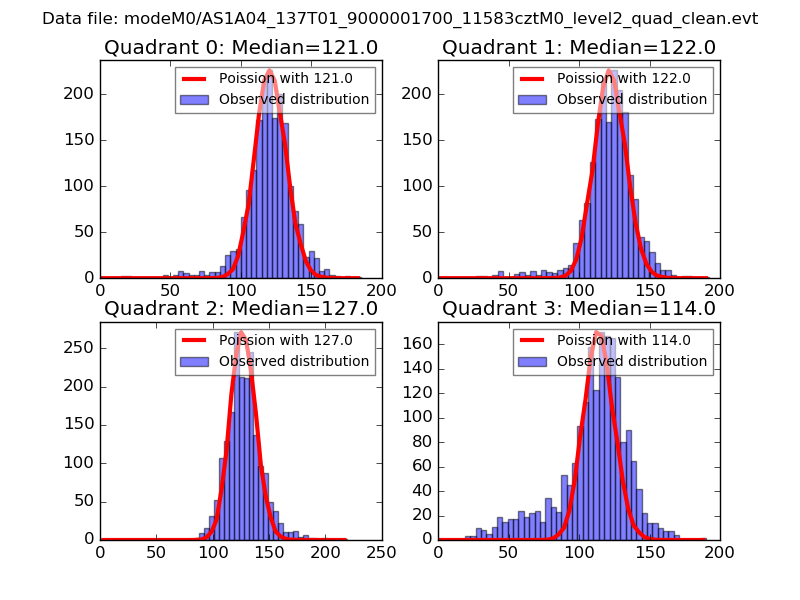 |
 |
| Quadrant-wise count rates Data is divided into 100 sec bins |
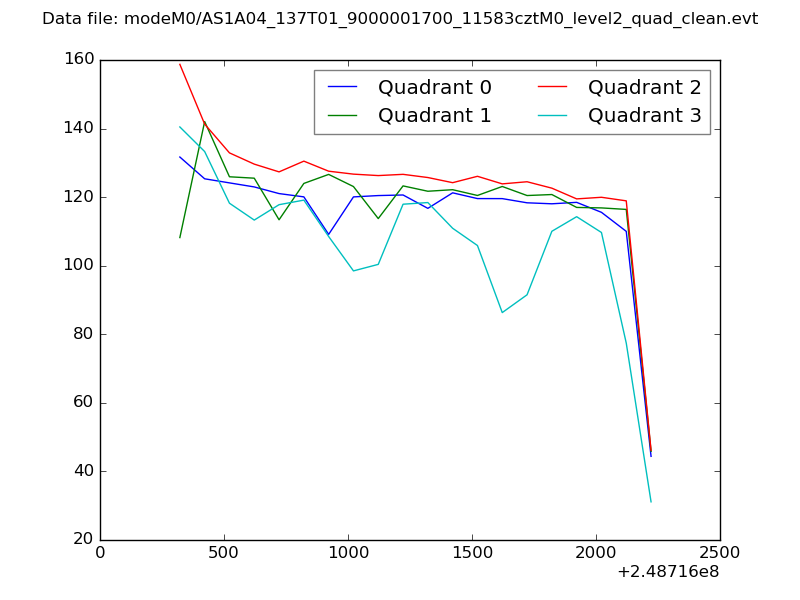 |
|
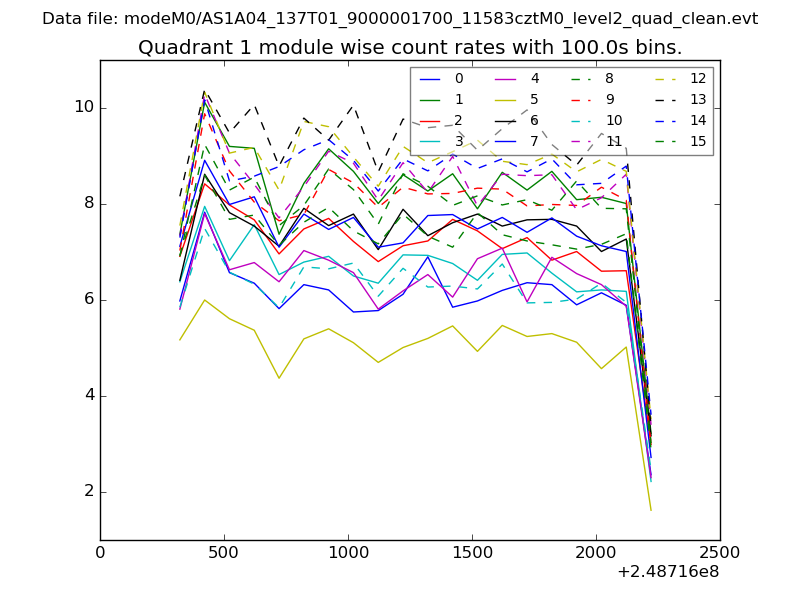
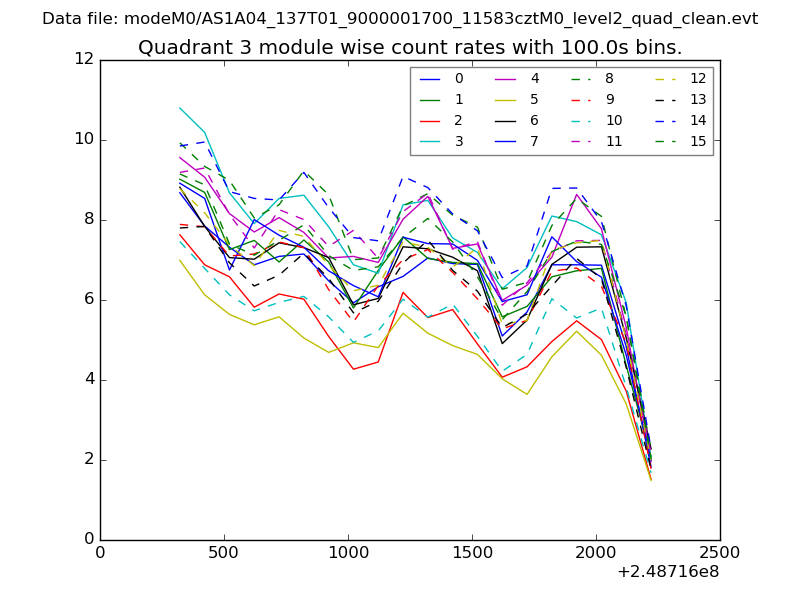
| Module-wise count rates for Quadrant A Data is divided into 100 sec bins |
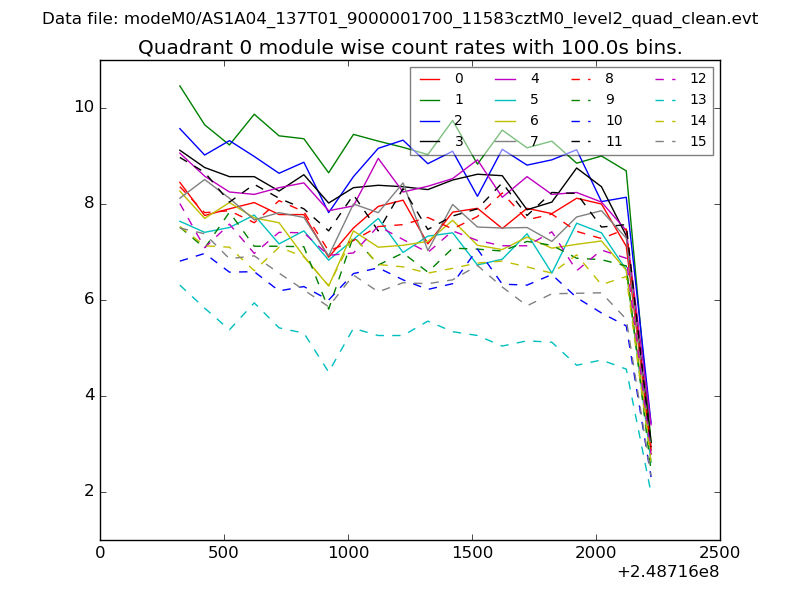 |
 |
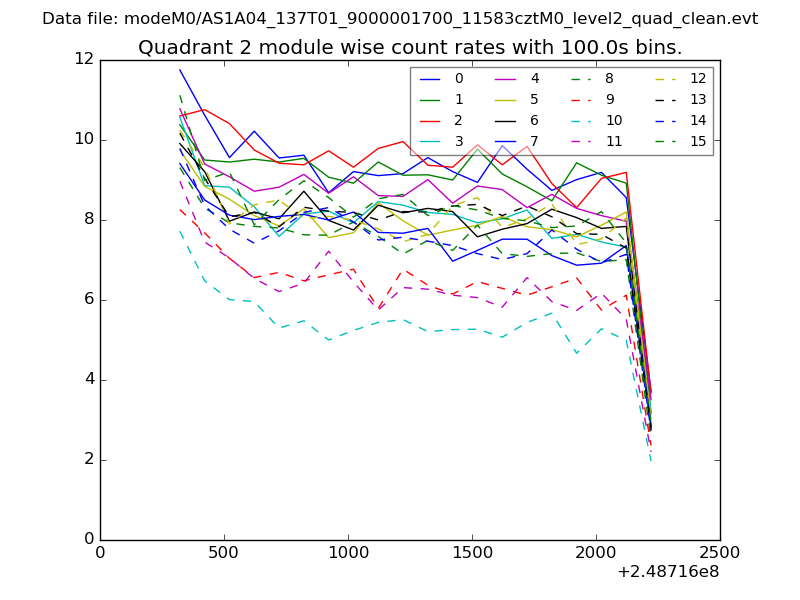
| Module-wise count rates for Quadrant B Data is divided into 100 sec bins |
 |
 |
| Module-wise count rates for Quadrant C Data is divided into 100 sec bins |
 |
 |
| Module-wise count rates for Quadrant D Data is divided into 100 sec bins |
 |
 |
| Parameter | Plot |
|---|---|
| CZT HV Monitor | 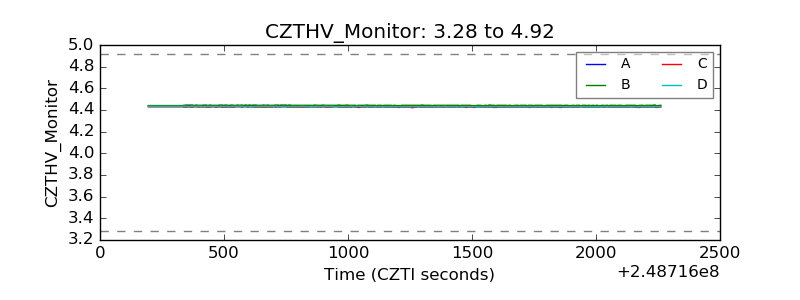 |
| D_VDD | 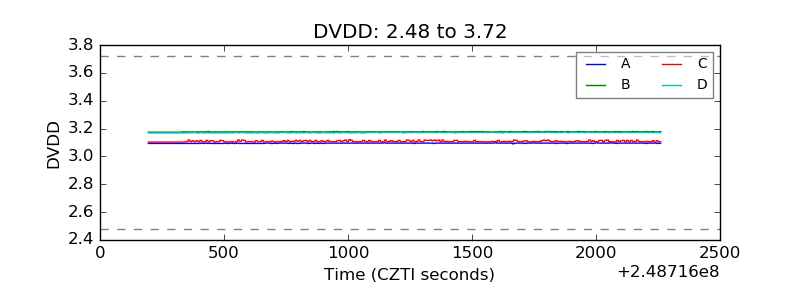 |
| Temperature 1 | 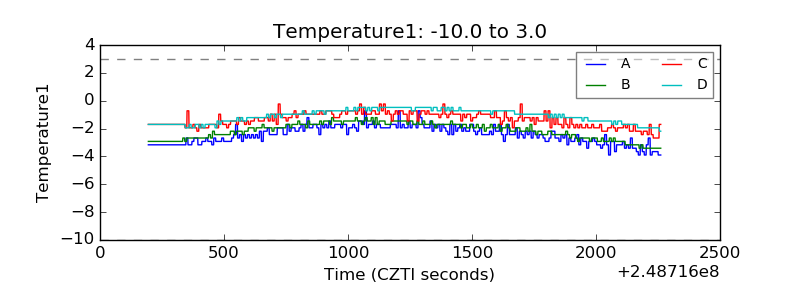 |
| Veto HV Monitor | 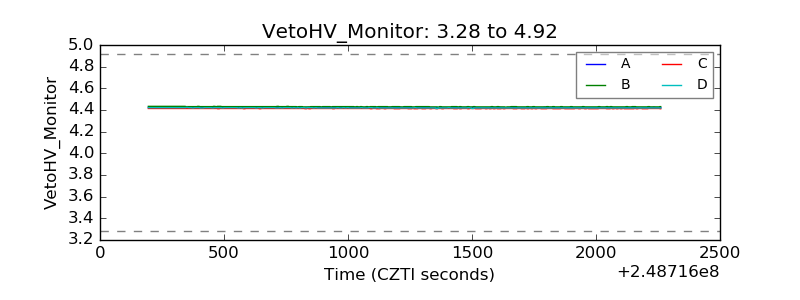 |
| Veto LLD | 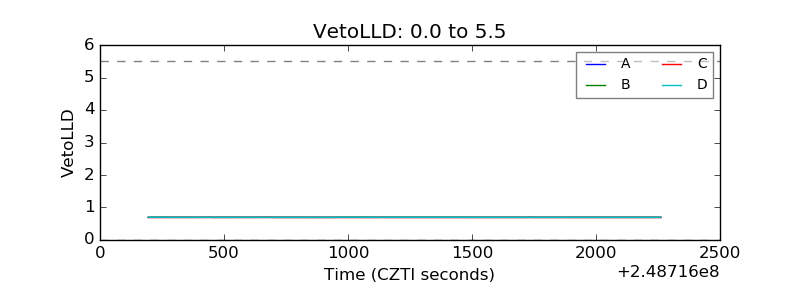 |
| Alpha Counter | 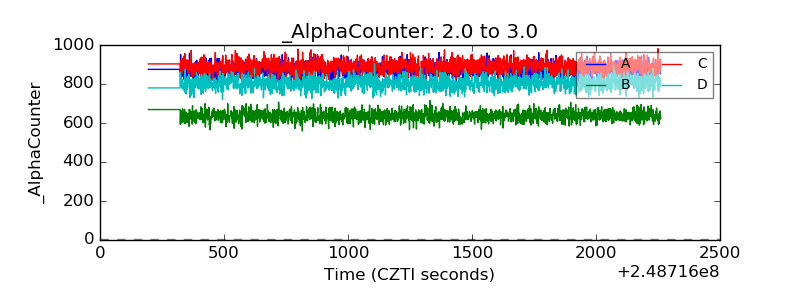 |
| _CPM_Rate | 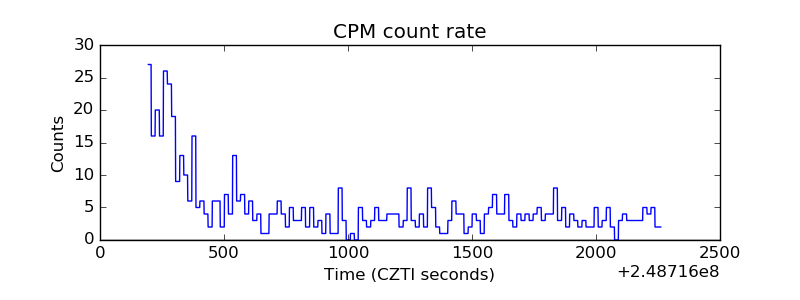 |
| CZT Counter | 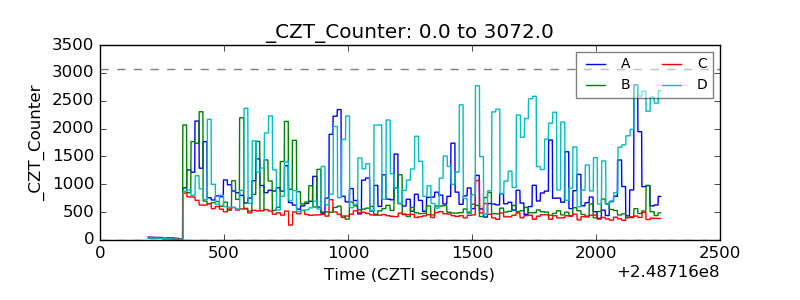 |
| +2.5 Volts monitor | 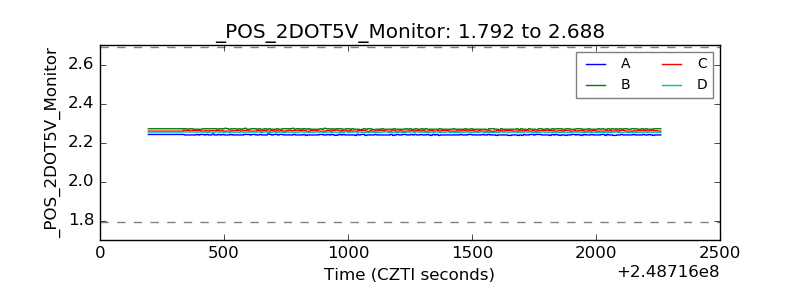 |
| +5 Volts monitor |  |
| _ROLL_ROT | 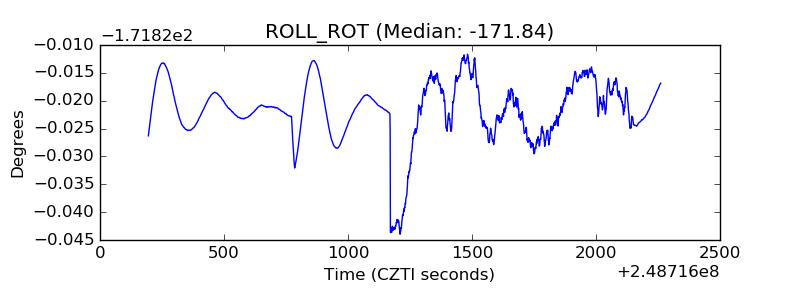 |
| _Roll_DEC | 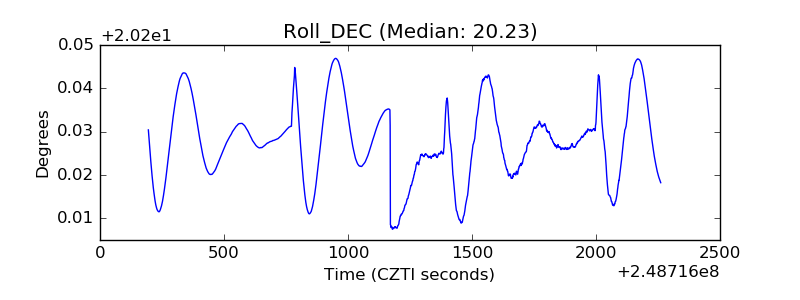 |
| _Roll_RA | 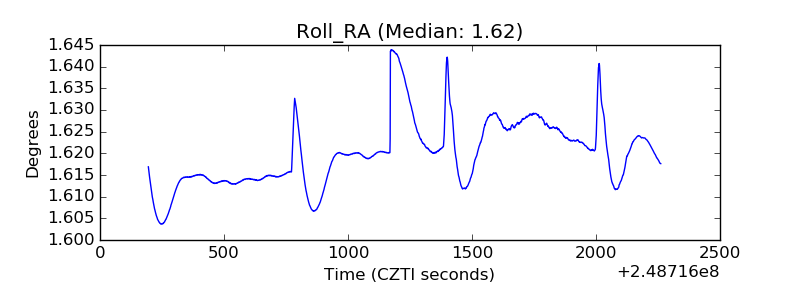 |
| Veto Counter | 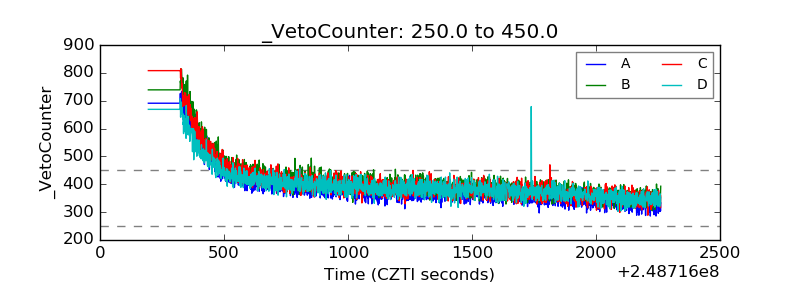 |