| Param | Original file | Final file |
|---|---|---|
| Filename | modeM0/AS1G08_031T01_9000001702cztM0_level2.fits | modeM0/AS1G08_031T01_9000001702cztM0_level2_quad_clean.evt |
| Size (bytes) | 424,062,720 | 384,143,040 |
| Size | 404.4 MB | 366.3 MB |
| Events in quadrant A | 2,523,712 | 2,206,461 |
| Events in quadrant B | 2,456,332 | 2,190,363 |
| Events in quadrant C | 2,552,270 | 2,158,417 |
| Events in quadrant D | 2,142,184 | 1,911,425 |
| Mode M0 | |||
|---|---|---|---|
| Quadrant | BADHDUFLAG | Total packets | Discarded packets |
| A | 0 | 119446 | 0 |
| B | 0 | 114822 | 0 |
| C | 0 | 94070 | 0 |
| D | 0 | 121535 | 0 |
| Mode M9 | |||
|---|---|---|---|
| Quadrant | BADHDUFLAG | Total packets | Discarded packets |
| A | 0 | 53 | 0 |
| B | 0 | 53 | 0 |
| C | 0 | 53 | 0 |
| D | 0 | 53 | 0 |
| Mode SS | |||
|---|---|---|---|
| Quadrant | BADHDUFLAG | Total packets | Discarded packets |
| A | 0 | 944 | 0 |
| B | 0 | 944 | 0 |
| C | 0 | 944 | 0 |
| D | 0 | 944 | 0 |
| Quadrant | Total seconds | Saturated seconds | Saturation percentage |
|---|---|---|---|
| A | 46118 | 1617 | 3.506223% |
| B | 46118 | 1958 | 4.245631% |
| C | 46118 | 176 | 0.381630% |
| D | 46118 | 2751 | 5.965133% |
Noise dominated data is calculated using 1-second bins in cleaned event files. If a bin has >2000 counts, and if more than 50% of those come from <1% of pixels, then it is considered to be noise-dominated and hence unusable.
| Quadrant | # 1 sec bins | Bins with >0 counts | Bins with >2000 counts | High rate bins dominated by noise | Noise dominated (total time) | Noise dominated (detector-on time) | Marked lightcurve |
|---|---|---|---|---|---|---|---|
| A | 51538 | 46117 | 0 | 0 | 0.00% | 0.00% |  |
| B | 51538 | 46110 | 0 | 0 | 0.00% | 0.00% |  |
| C | 51538 | 46118 | 0 | 0 | 0.00% | 0.00% | 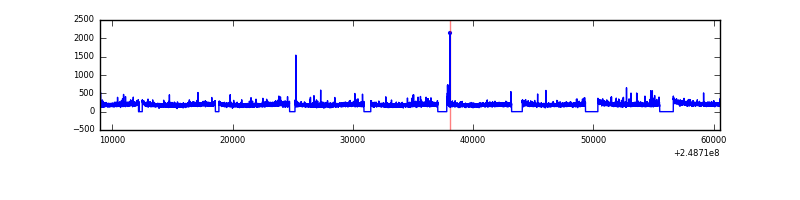 |
| D | 51538 | 46016 | 0 | 0 | 0.00% | 0.00% | 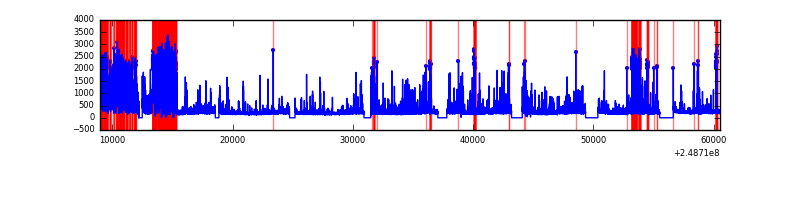 |
Top three noisy pixels from each quadrant. If the there are fewer than three noisy pixels in the level2.evt file, extra rows are filled as -1
| Pixel properties | Quadrant properties | ||||||
|---|---|---|---|---|---|---|---|
| Quadrant | DetID | PixID | Counts | Sigma | Mean | Median | Sigma |
| A | 14 | 188 | 2537 | 11.69 | 656 | 613 | 164.5 |
| A | 0 | 29 | 2390 | 10.8 | 656 | 613 | 164.5 |
| A | 14 | 204 | 2124 | 9.18 | 656 | 613 | 164.5 |
| B | 2 | 9 | 2207 | 12.02 | 648 | 615 | 132.4 |
| B | 14 | 254 | 1705 | 8.23 | 648 | 615 | 132.4 |
| B | 3 | 17 | 1702 | 8.21 | 648 | 615 | 132.4 |
| C | 1 | 80 | 1895 | 7.18 | 672 | 623 | 177.2 |
| C | 1 | 81 | 1850 | 6.93 | 672 | 623 | 177.2 |
| C | 12 | 241 | 1840 | 6.87 | 672 | 623 | 177.2 |
| D | 3 | 14 | 1604 | 6.4 | 609 | 552 | 164.3 |
| D | 3 | 31 | 1602 | 6.39 | 609 | 552 | 164.3 |
| D | 6 | 231 | 1558 | 6.12 | 609 | 552 | 164.3 |
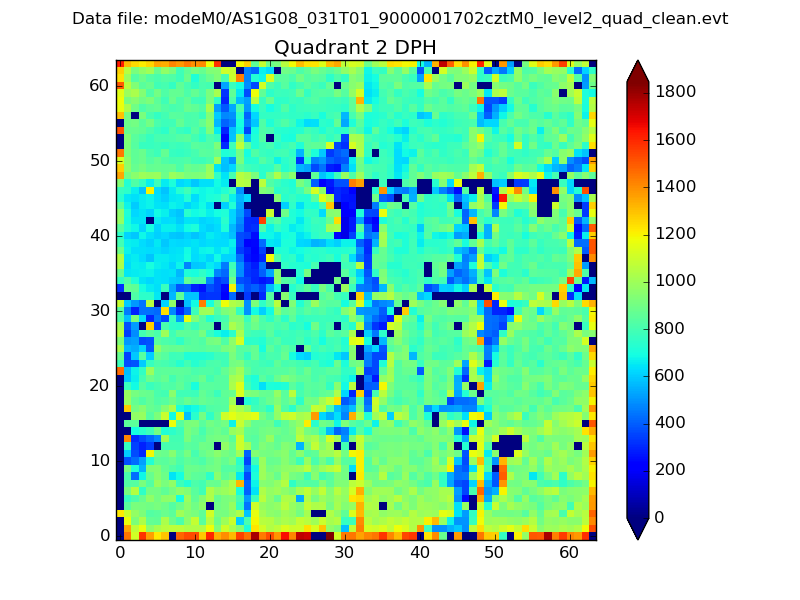
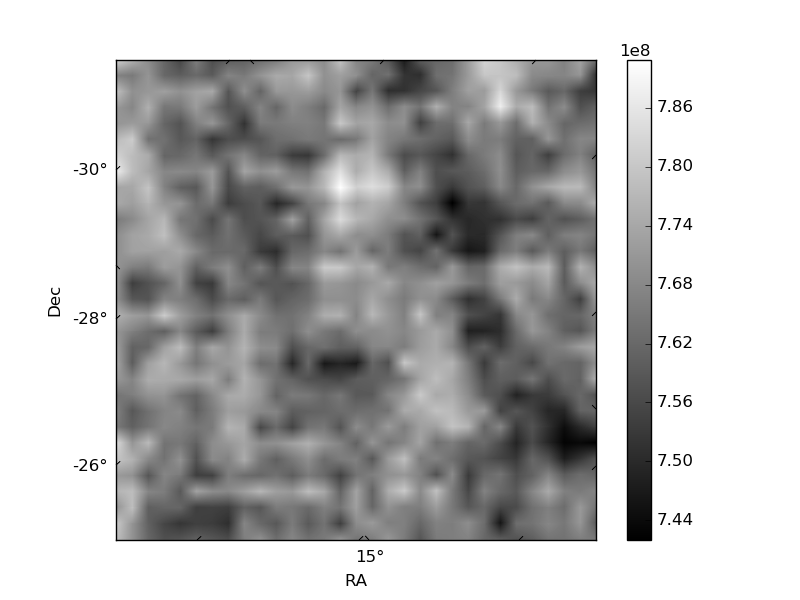
Histogram calculated using DETX and DETY for each event in the final _common_clean file
| Quadrant A | 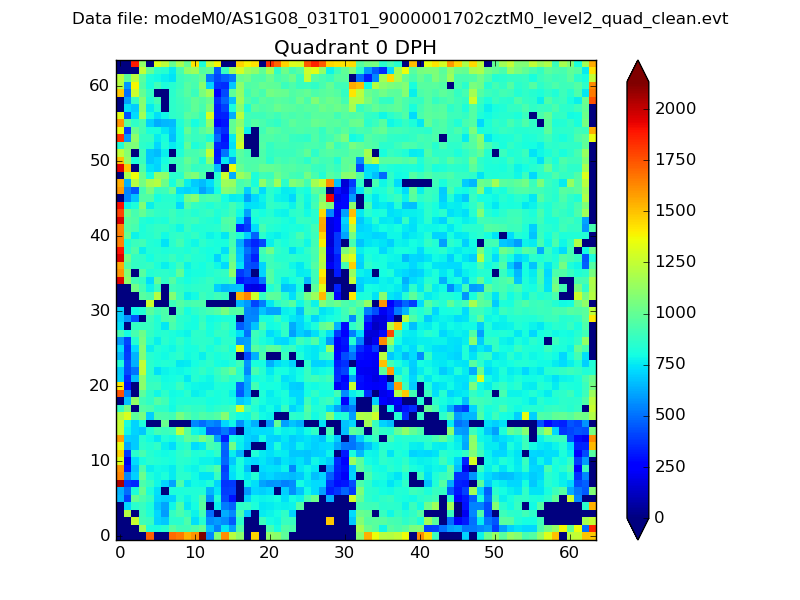 |
 |
Quadrant B |
|---|---|---|---|
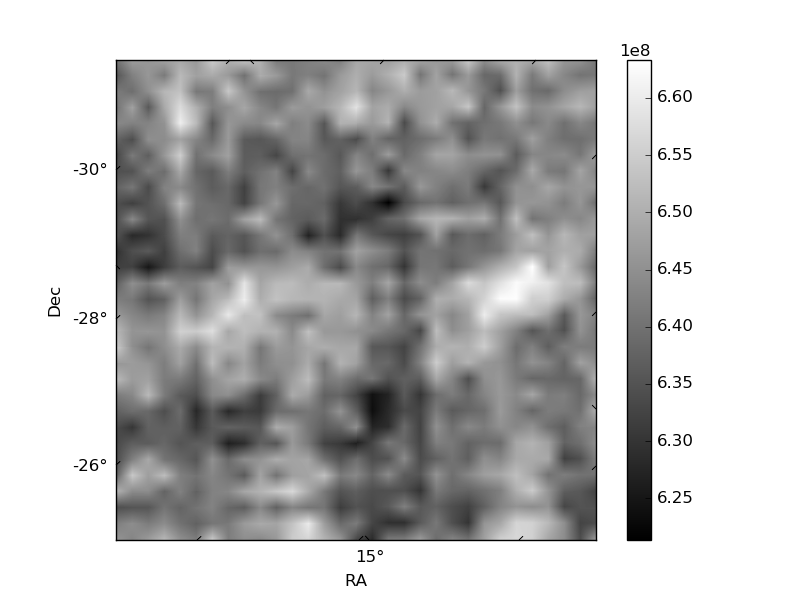
| Quadrant D | 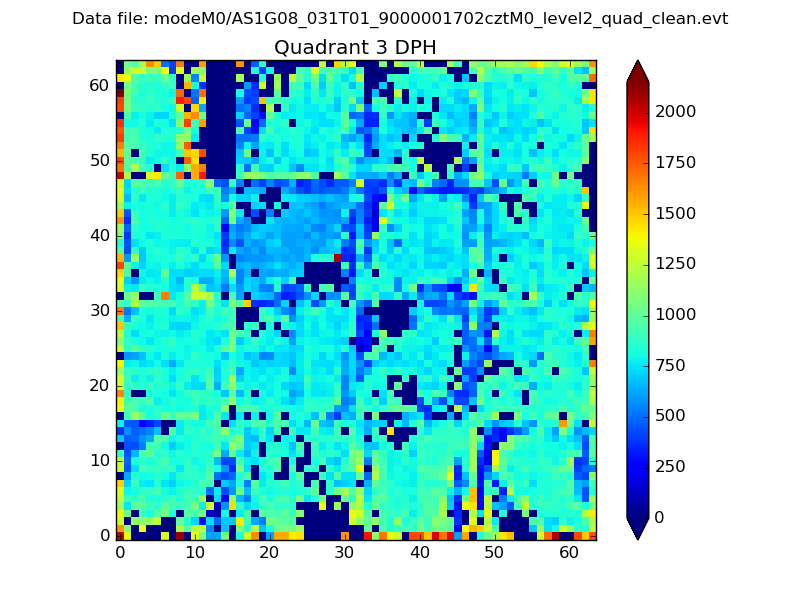 |
 |
Quadrant C |
| Plot type | Count rate plots | Images |
|---|---|---|
| Comparison with Poisson distribution Blue bars denote a histogram of data divided into 1 sec bins. Red curve is a Poisson curve with rate = median count rate of data. |
 |
 |
| Quadrant-wise count rates Data is divided into 100 sec bins |
 |
|
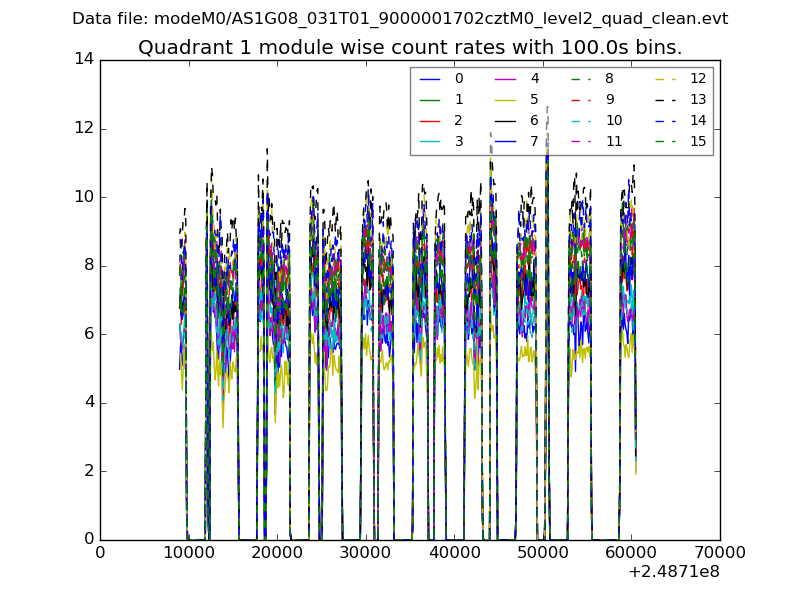
| Module-wise count rates for Quadrant A Data is divided into 100 sec bins |
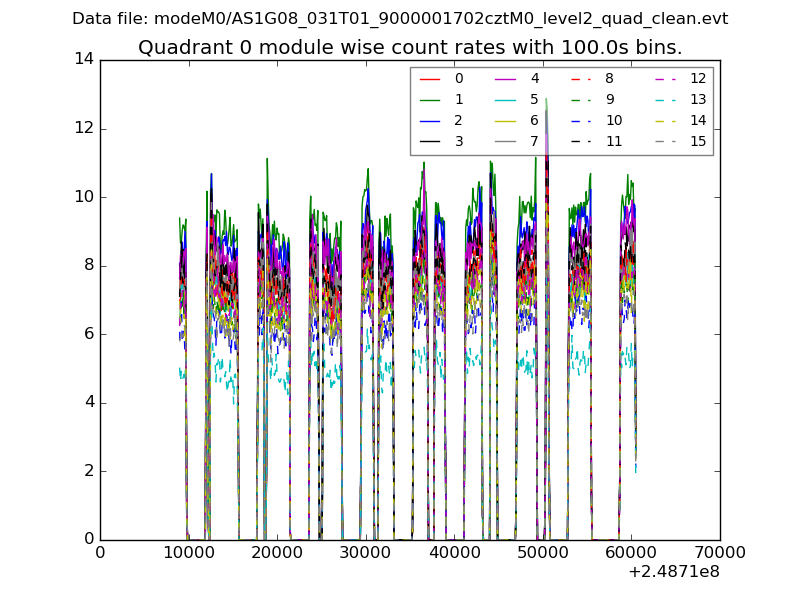 |
 |
| Module-wise count rates for Quadrant B Data is divided into 100 sec bins |
 |
 |
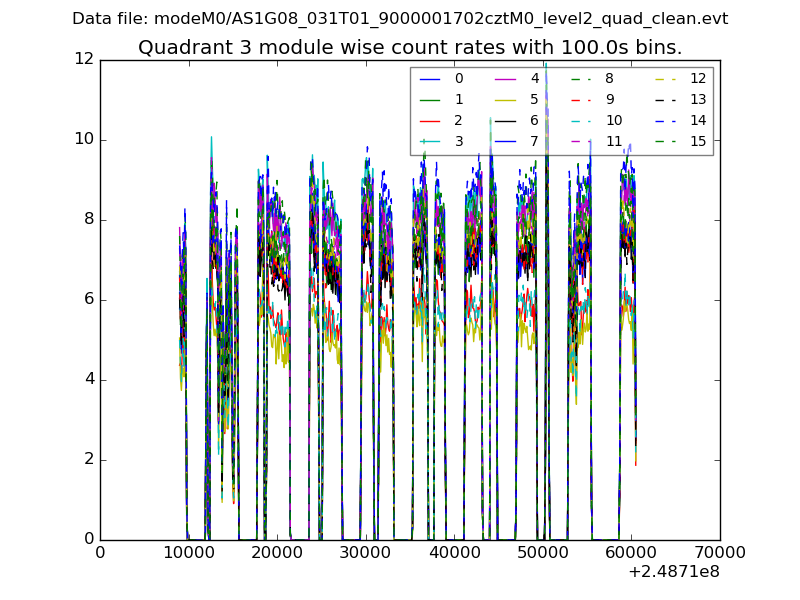
| Module-wise count rates for Quadrant C Data is divided into 100 sec bins |
 |
 |
| Module-wise count rates for Quadrant D Data is divided into 100 sec bins |
 |
 |
| Parameter | Plot |
|---|---|
| CZT HV Monitor |  |
| D_VDD | 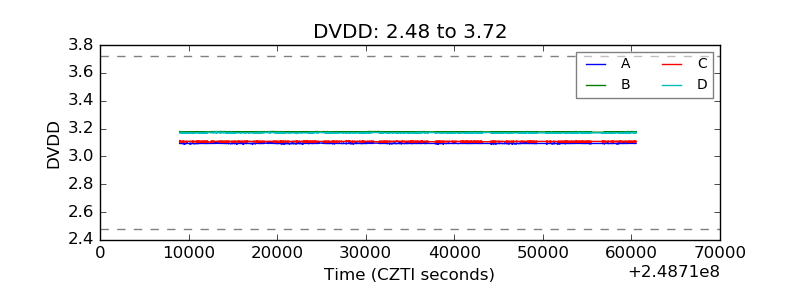 |
| Temperature 1 |  |
| Veto HV Monitor |  |
| Veto LLD | 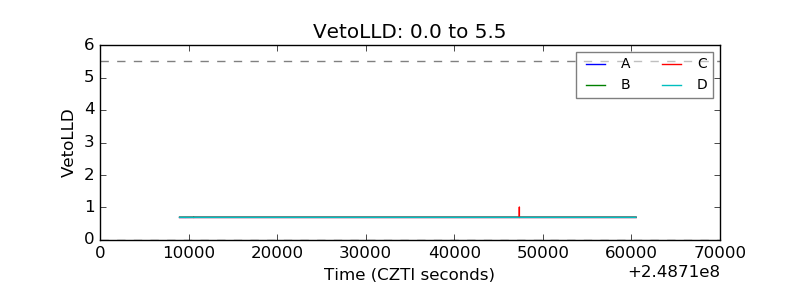 |
| Alpha Counter |  |
| _CPM_Rate |  |
| CZT Counter |  |
| +2.5 Volts monitor | 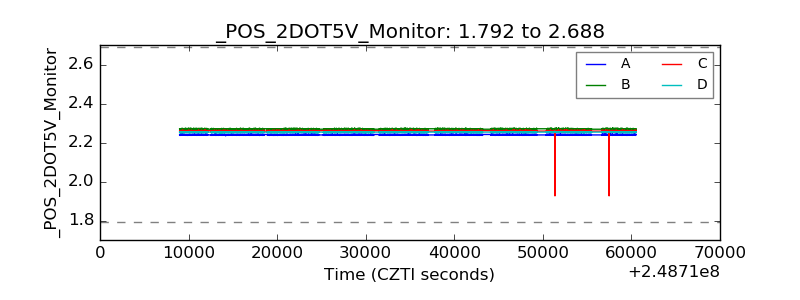 |
| +5 Volts monitor |  |
| _ROLL_ROT |  |
| _Roll_DEC | 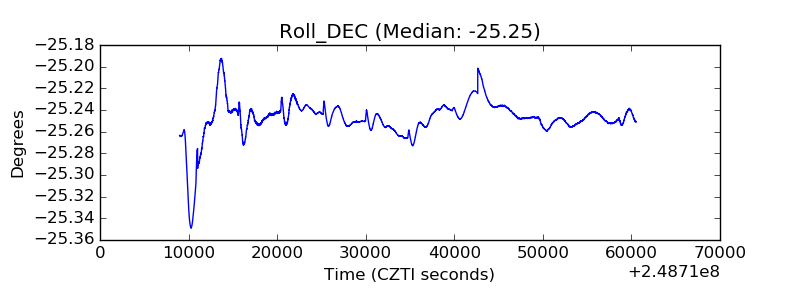 |
| _Roll_RA | 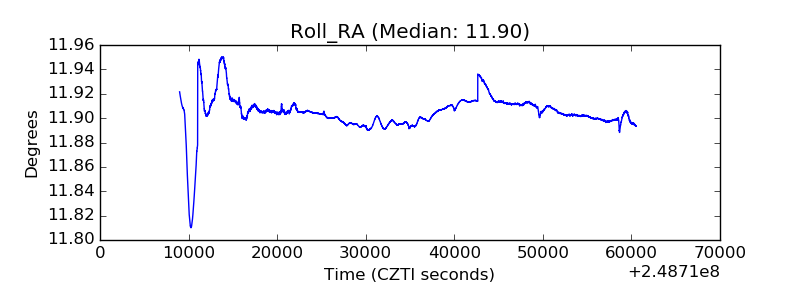 |
| Veto Counter | 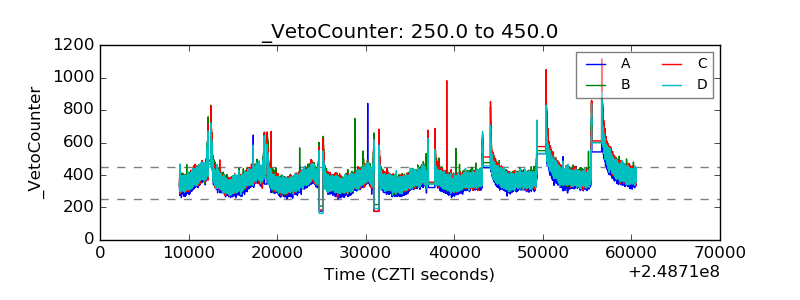 |