| Param | Original file | Final file |
|---|---|---|
| Filename | modeM0/AS1G08_031T01_9000001702_11583cztM0_level2.evt | modeM0/AS1G08_031T01_9000001702_11583cztM0_level2_quad_clean.evt |
| Size (bytes) | 542,885,760 | 50,215,680 |
| Size | 517.7 MB | 47.9 MB |
| Events in quadrant A | 3,932,645 | 311,848 |
| Events in quadrant B | 3,524,243 | 305,294 |
| Events in quadrant C | 2,238,486 | 313,622 |
| Events in quadrant D | 6,422,124 | 252,957 |
| Mode M0 | |||
|---|---|---|---|
| Quadrant | BADHDUFLAG | Total packets | Discarded packets |
| A | 0 | 15035 | 2 |
| B | 0 | 13479 | 1 |
| C | 0 | 9949 | 1 |
| D | 0 | 22388 | 1 |
| Mode M9 | |||
|---|---|---|---|
| Quadrant | BADHDUFLAG | Total packets | Discarded packets |
| A | 0 | 4 | 0 |
| B | 0 | 4 | 0 |
| C | 0 | 4 | 0 |
| D | 0 | 4 | 0 |
| Mode SS | |||
|---|---|---|---|
| Quadrant | BADHDUFLAG | Total packets | Discarded packets |
| A | 0 | 98 | 0 |
| B | 0 | 98 | 0 |
| C | 0 | 98 | 0 |
| D | 0 | 98 | 0 |
| Quadrant | Total seconds | Saturated seconds | Saturation percentage |
|---|---|---|---|
| A | 4787 | 370 | 7.729267% |
| B | 4787 | 376 | 7.854606% |
| C | 4787 | 28 | 0.584917% |
| D | 4787 | 1319 | 27.553792% |
Noise dominated data is calculated using 1-second bins in cleaned event files. If a bin has >2000 counts, and if more than 50% of those come from <1% of pixels, then it is considered to be noise-dominated and hence unusable.
| Quadrant | # 1 sec bins | Bins with >0 counts | Bins with >2000 counts | High rate bins dominated by noise | Noise dominated (total time) | Noise dominated (detector-on time) | Marked lightcurve |
|---|---|---|---|---|---|---|---|
| A | 5088 | 4790 | 156 | 156 | 3.07% | 3.26% | 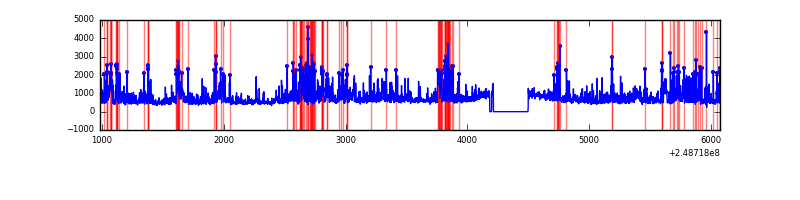 |
| B | 5088 | 4790 | 207 | 207 | 4.07% | 4.32% | 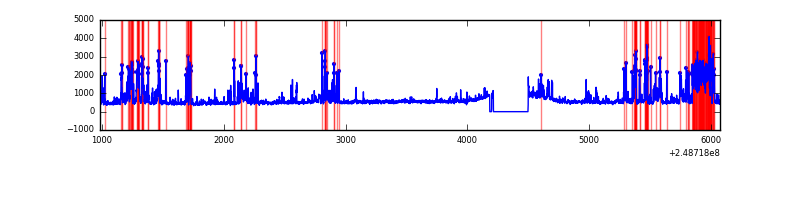 |
| C | 5088 | 4790 | 0 | 0 | 0.00% | 0.00% | 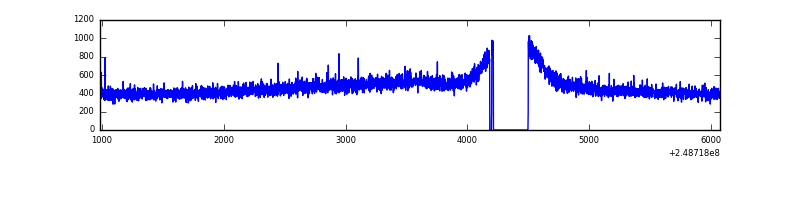 |
| D | 5088 | 4790 | 1059 | 1059 | 20.81% | 22.11% | 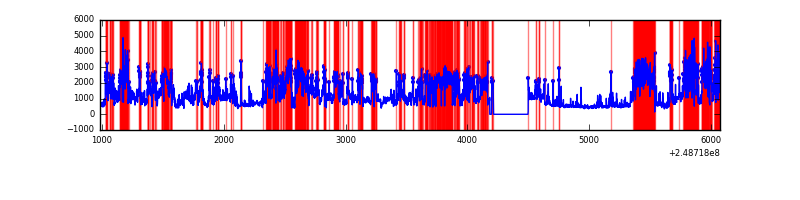 |
Top three noisy pixels from each quadrant. If the there are fewer than three noisy pixels in the level2.evt file, extra rows are filled as -1
| Pixel properties | Quadrant properties | ||||||
|---|---|---|---|---|---|---|---|
| Quadrant | DetID | PixID | Counts | Sigma | Mean | Median | Sigma |
| A | 8 | 5 | 1405815 | 11626.78 | 582 | 568 | 120.9 |
| A | 1 | 162 | 88554 | 727.98 | 582 | 568 | 120.9 |
| A | 1 | 178 | 49572 | 405.45 | 582 | 568 | 120.9 |
| B | 4 | 239 | 722987 | 6300.08 | 584 | 568 | 114.7 |
| B | 3 | 64 | 379457 | 3304.22 | 584 | 568 | 114.7 |
| B | 11 | 51 | 76748 | 664.35 | 584 | 568 | 114.7 |
| C | 13 | 61 | 4125 | 26.37 | 573 | 576 | 134.6 |
| C | 12 | 4 | 1650 | 7.98 | 573 | 576 | 134.6 |
| C | 3 | 202 | 1382 | 5.99 | 573 | 576 | 134.6 |
| D | 1 | 52 | 4119702 | 33734.58 | 504 | 489 | 122.1 |
| D | 2 | 120 | 143914 | 1174.59 | 504 | 489 | 122.1 |
| D | 7 | 71 | 132137 | 1078.14 | 504 | 489 | 122.1 |
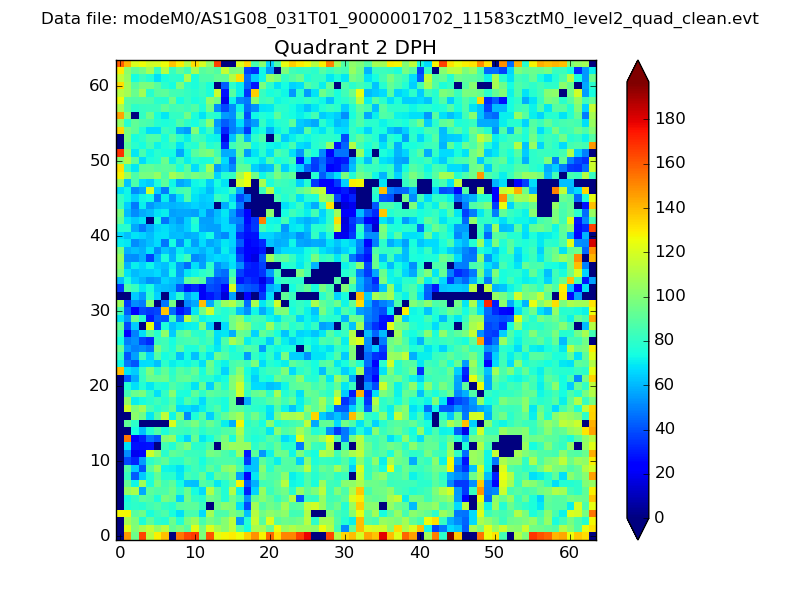
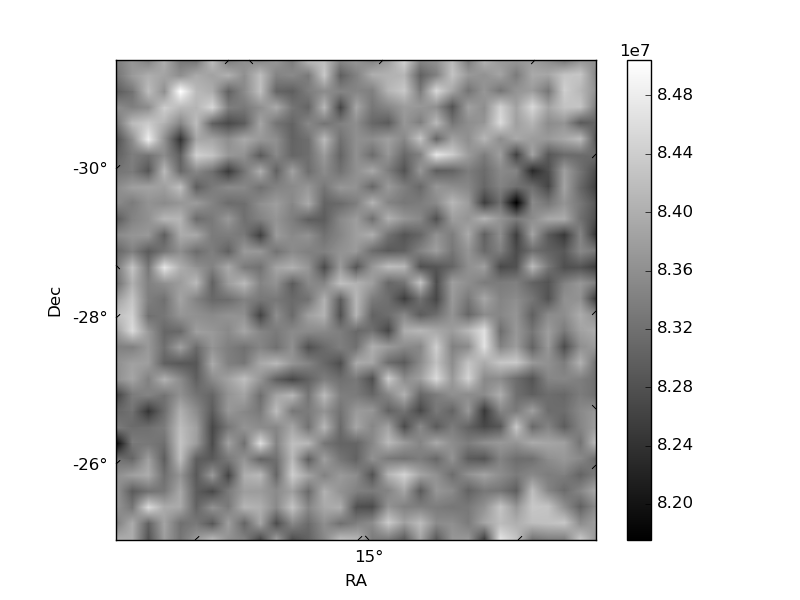
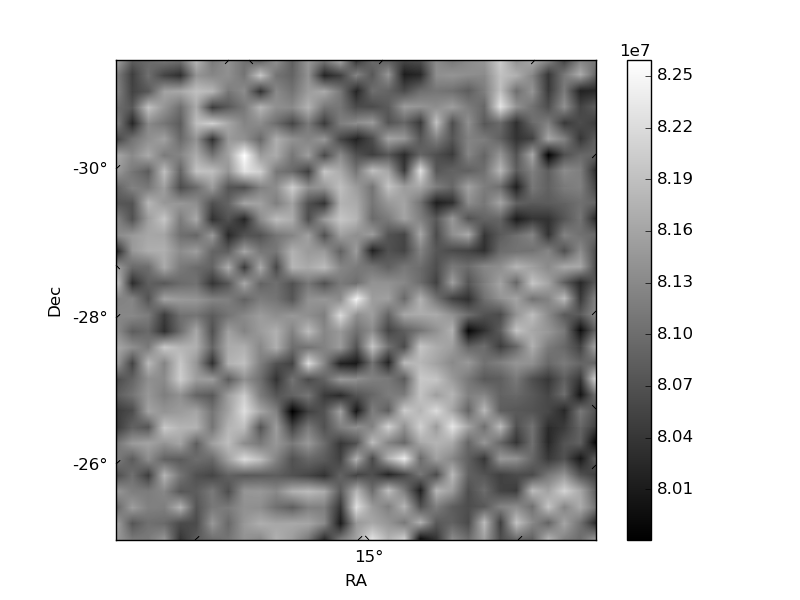
Histogram calculated using DETX and DETY for each event in the final _common_clean file
| Quadrant A | 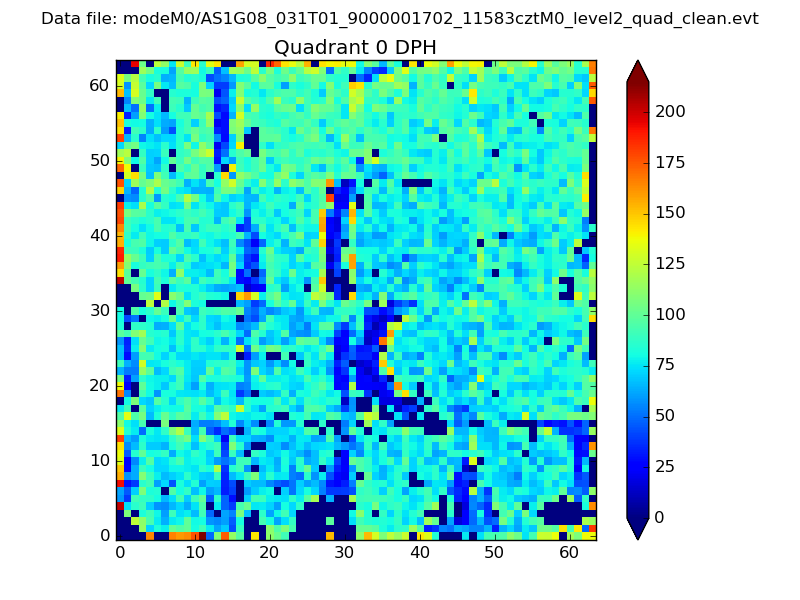 |
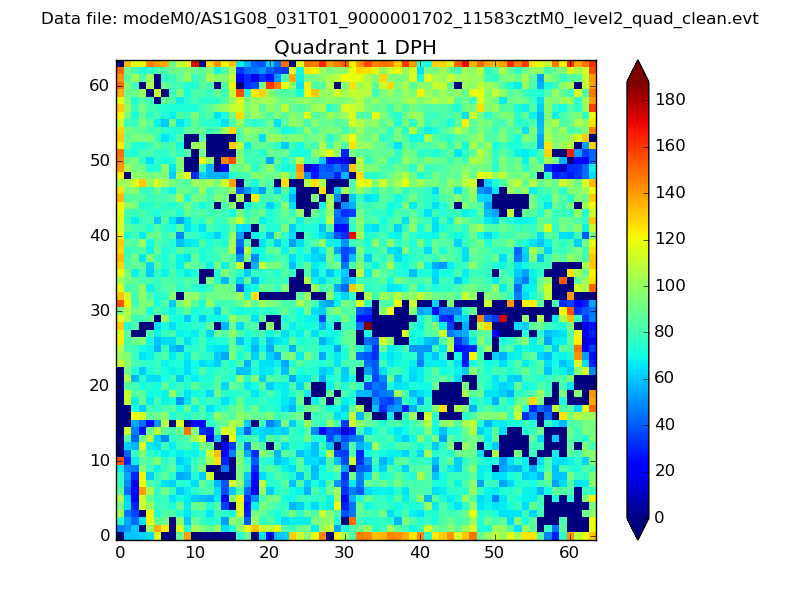 |
Quadrant B |
|---|---|---|---|
| Quadrant D | 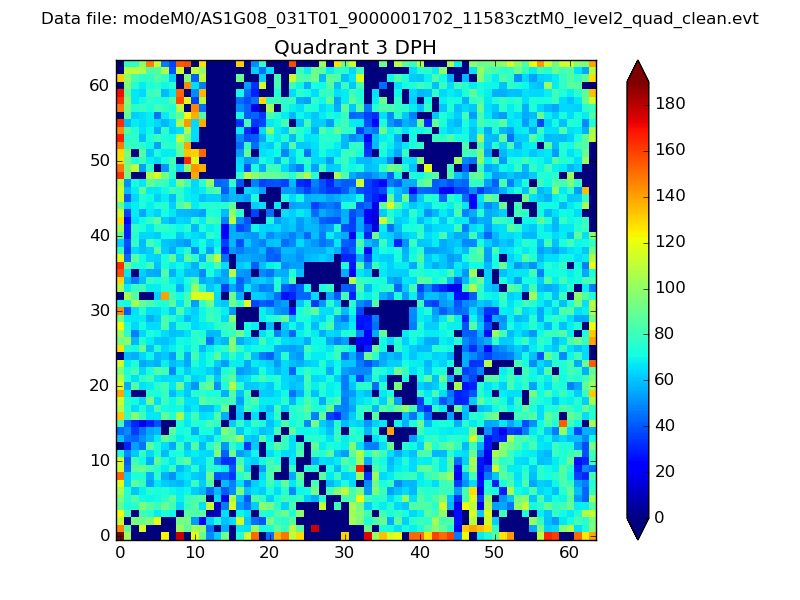 |
 |
Quadrant C |
| Plot type | Count rate plots | Images |
|---|---|---|
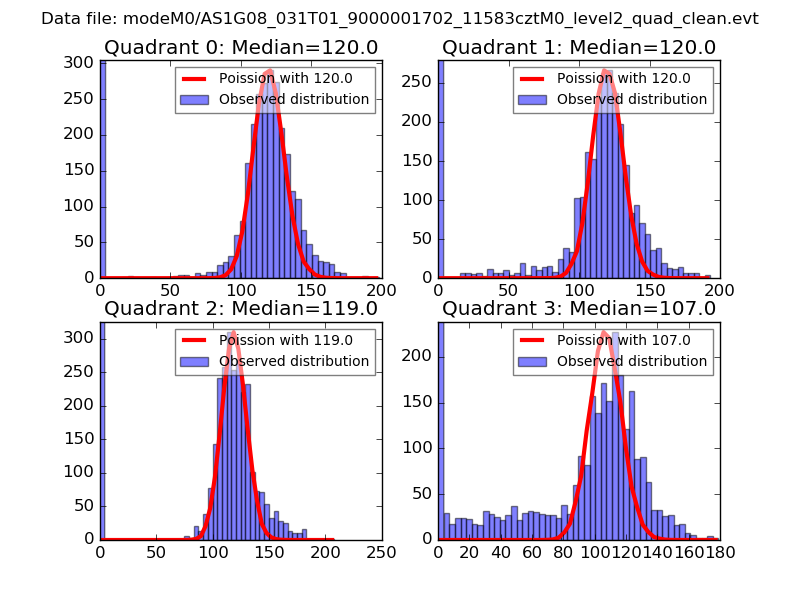
| Comparison with Poisson distribution Blue bars denote a histogram of data divided into 1 sec bins. Red curve is a Poisson curve with rate = median count rate of data. |
 |
 |
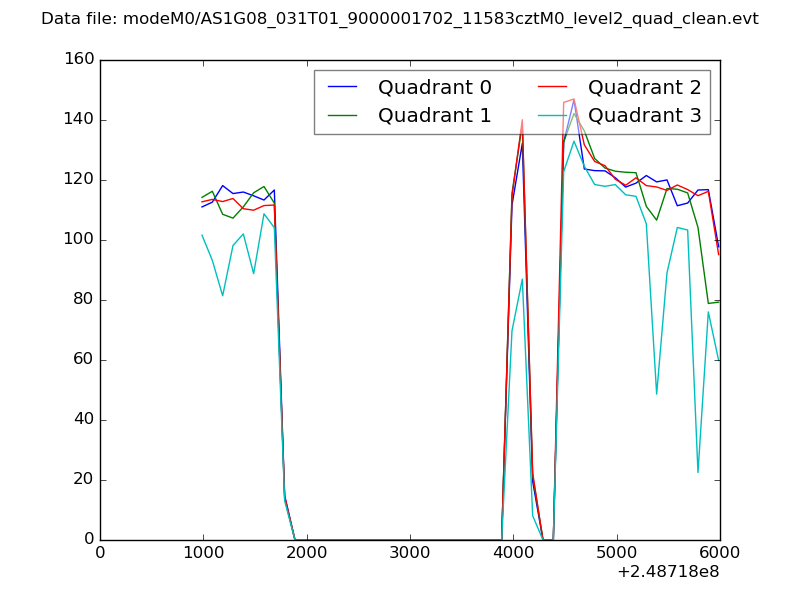
| Quadrant-wise count rates Data is divided into 100 sec bins |
 |
|
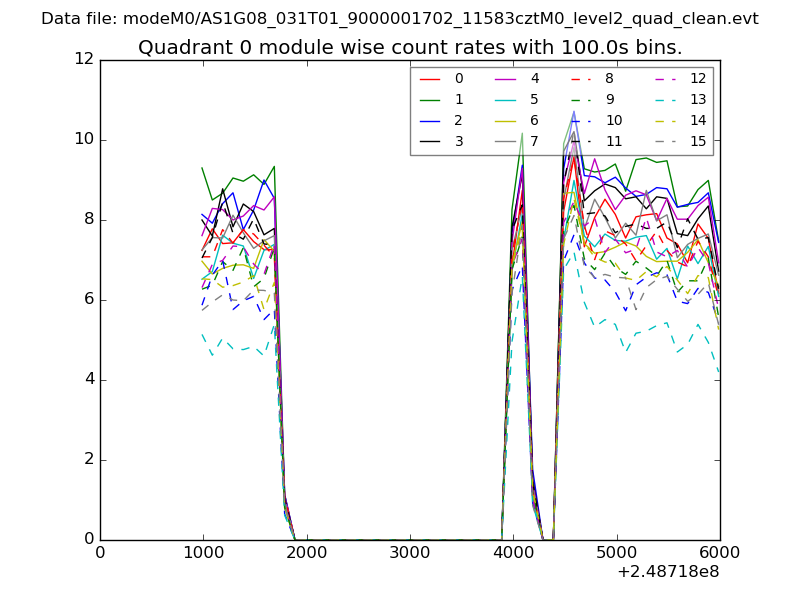
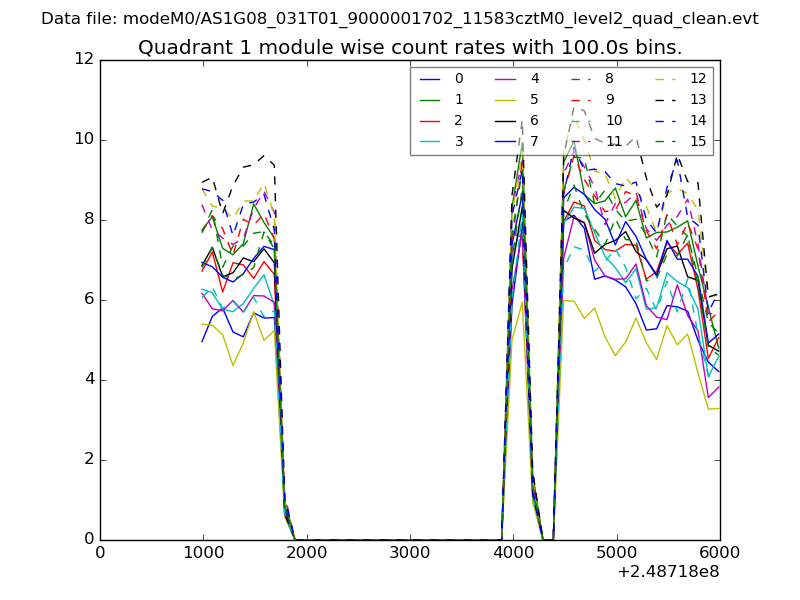
| Module-wise count rates for Quadrant A Data is divided into 100 sec bins |
 |
 |
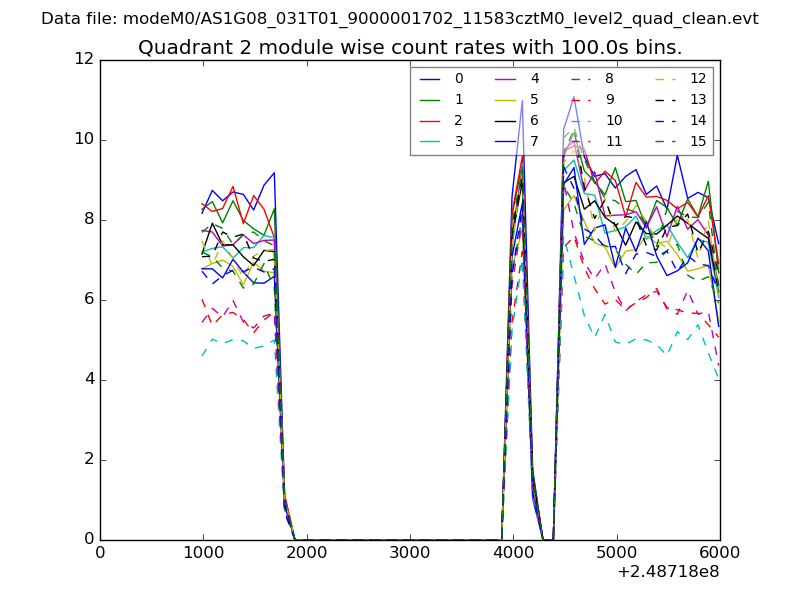
| Module-wise count rates for Quadrant B Data is divided into 100 sec bins |
 |
 |
| Module-wise count rates for Quadrant C Data is divided into 100 sec bins |
 |
 |
| Module-wise count rates for Quadrant D Data is divided into 100 sec bins |
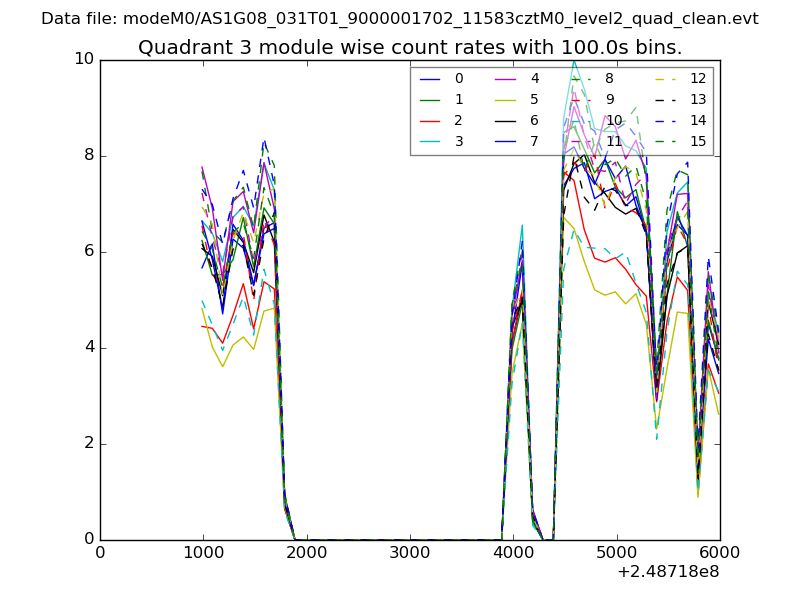 |
 |
| Parameter | Plot |
|---|---|
| CZT HV Monitor | 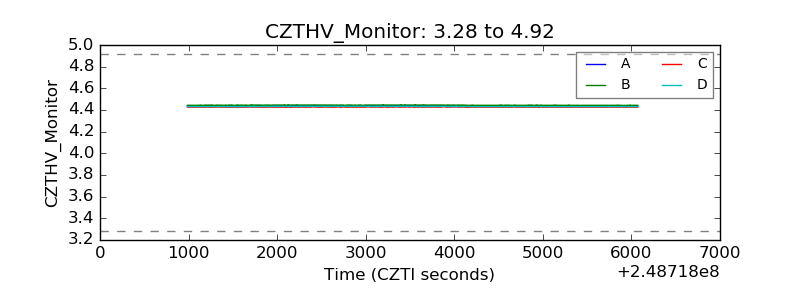 |
| D_VDD | 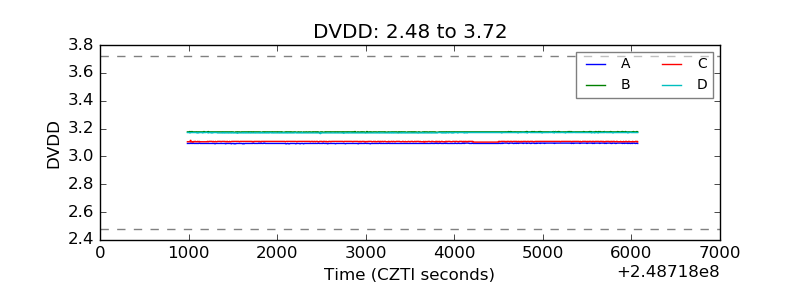 |
| Temperature 1 | 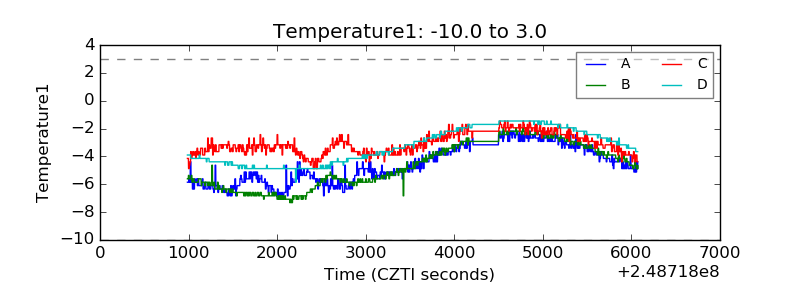 |
| Veto HV Monitor | 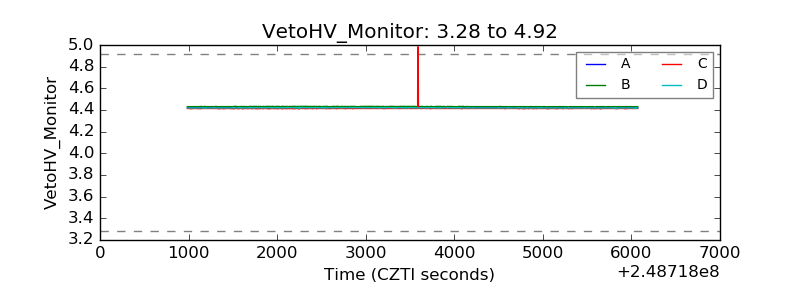 |
| Veto LLD | 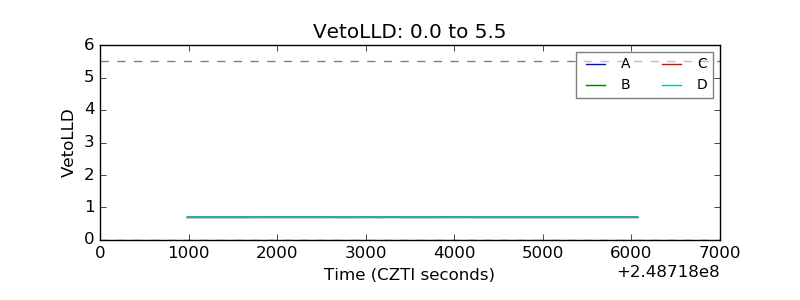 |
| Alpha Counter | 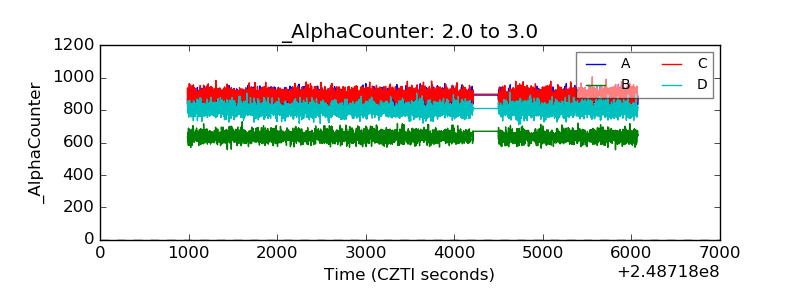 |
| _CPM_Rate | 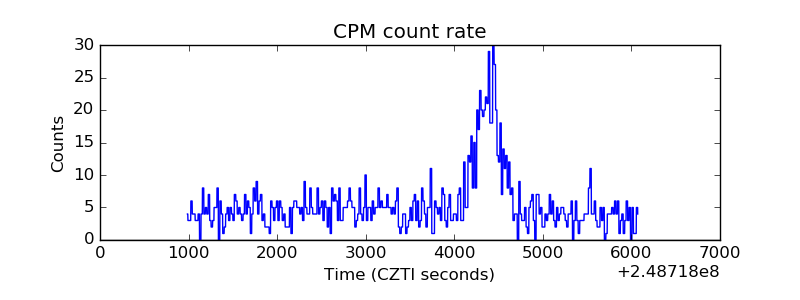 |
| CZT Counter | 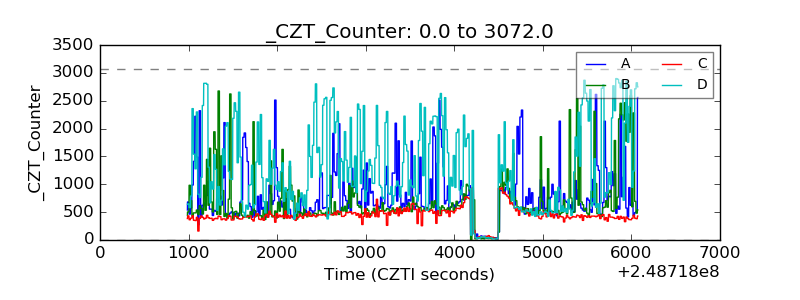 |
| +2.5 Volts monitor |  |
| +5 Volts monitor |  |
| _ROLL_ROT | 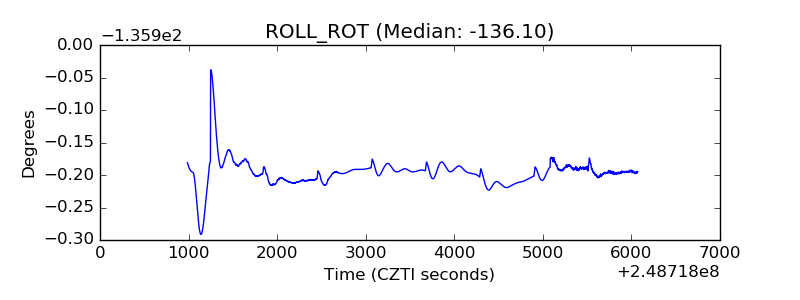 |
| _Roll_DEC | 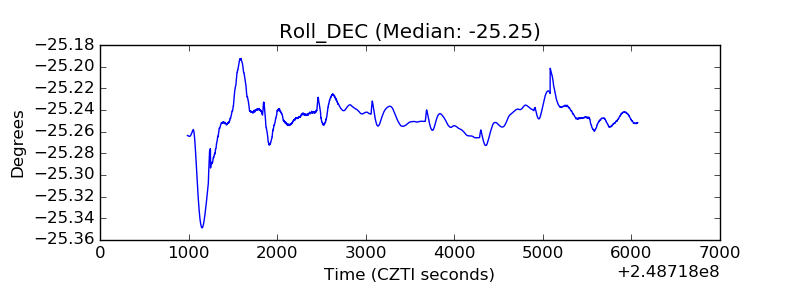 |
| _Roll_RA | 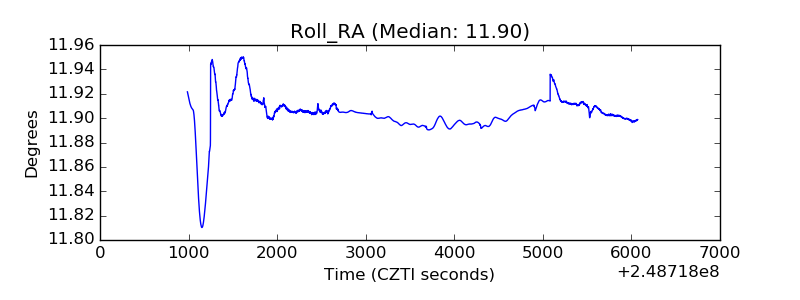 |
| Veto Counter | 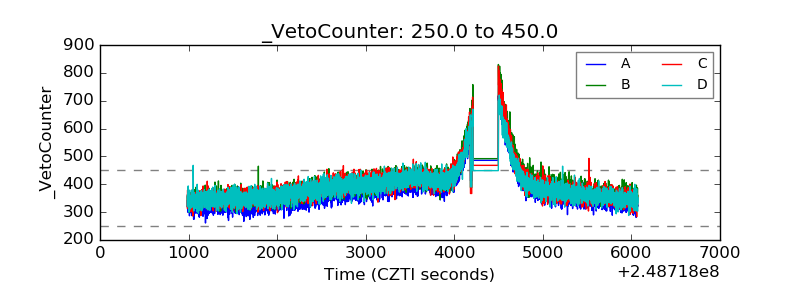 |