| Param | Original file | Final file |
|---|---|---|
| Filename | modeM0/AS1G08_031T01_9000001702_11584cztM0_level2.evt | modeM0/AS1G08_031T01_9000001702_11584cztM0_level2_quad_clean.evt |
| Size (bytes) | 681,301,440 | 90,244,800 |
| Size | 649.7 MB | 86.1 MB |
| Events in quadrant A | 5,535,176 | 580,925 |
| Events in quadrant B | 5,149,988 | 573,987 |
| Events in quadrant C | 3,151,126 | 586,784 |
| Events in quadrant D | 6,310,896 | 490,297 |
| Mode M0 | |||
|---|---|---|---|
| Quadrant | BADHDUFLAG | Total packets | Discarded packets |
| A | 0 | 21472 | 2 |
| B | 0 | 19962 | 1 |
| C | 0 | 14604 | 1 |
| D | 0 | 23691 | 1 |
| Mode M9 | |||
|---|---|---|---|
| Quadrant | BADHDUFLAG | Total packets | Discarded packets |
| A | 0 | 3 | 0 |
| B | 0 | 3 | 0 |
| C | 0 | 3 | 0 |
| D | 0 | 3 | 0 |
| Mode SS | |||
|---|---|---|---|
| Quadrant | BADHDUFLAG | Total packets | Discarded packets |
| A | 0 | 146 | 0 |
| B | 0 | 146 | 0 |
| C | 0 | 146 | 0 |
| D | 0 | 146 | 0 |
| Quadrant | Total seconds | Saturated seconds | Saturation percentage |
|---|---|---|---|
| A | 7183 | 306 | 4.260058% |
| B | 7183 | 486 | 6.765975% |
| C | 7183 | 12 | 0.167061% |
| D | 7183 | 1017 | 14.158430% |
Noise dominated data is calculated using 1-second bins in cleaned event files. If a bin has >2000 counts, and if more than 50% of those come from <1% of pixels, then it is considered to be noise-dominated and hence unusable.
| Quadrant | # 1 sec bins | Bins with >0 counts | Bins with >2000 counts | High rate bins dominated by noise | Noise dominated (total time) | Noise dominated (detector-on time) | Marked lightcurve |
|---|---|---|---|---|---|---|---|
| A | 7484 | 7185 | 125 | 125 | 1.67% | 1.74% | 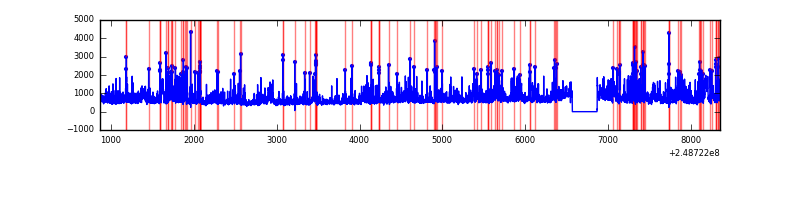 |
| B | 7484 | 7185 | 356 | 356 | 4.76% | 4.95% | 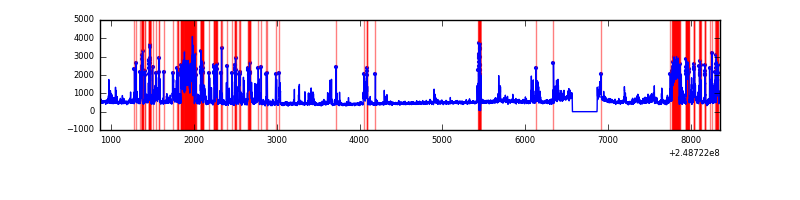 |
| C | 7484 | 7185 | 0 | 0 | 0.00% | 0.00% | 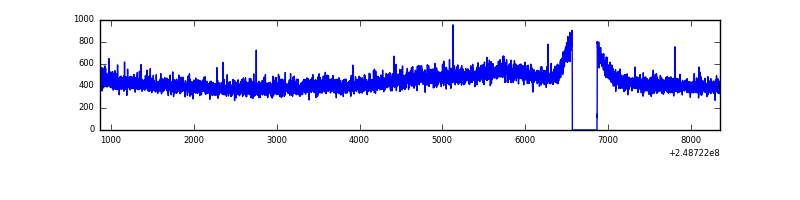 |
| D | 7484 | 7185 | 927 | 927 | 12.39% | 12.90% | 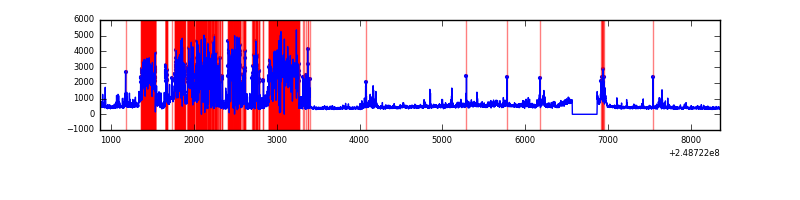 |
Top three noisy pixels from each quadrant. If the there are fewer than three noisy pixels in the level2.evt file, extra rows are filled as -1
| Pixel properties | Quadrant properties | ||||||
|---|---|---|---|---|---|---|---|
| Quadrant | DetID | PixID | Counts | Sigma | Mean | Median | Sigma |
| A | 8 | 5 | 1824724 | 10712.29 | 830 | 809 | 170.3 |
| A | 1 | 162 | 183770 | 1074.57 | 830 | 809 | 170.3 |
| A | 1 | 178 | 105938 | 617.45 | 830 | 809 | 170.3 |
| B | 4 | 239 | 1321496 | 8326.92 | 823 | 802 | 158.6 |
| B | 3 | 64 | 330116 | 2076.31 | 823 | 802 | 158.6 |
| B | 11 | 51 | 119998 | 751.53 | 823 | 802 | 158.6 |
| C | 13 | 61 | 5768 | 26.23 | 806 | 812 | 189.0 |
| C | 14 | 239 | 5267 | 23.58 | 806 | 812 | 189.0 |
| C | 12 | 4 | 2196 | 7.32 | 806 | 812 | 189.0 |
| D | 1 | 52 | 2916821 | 16079.5 | 747 | 724 | 181.4 |
| D | 10 | 199 | 153077 | 840.08 | 747 | 724 | 181.4 |
| D | 7 | 71 | 128278 | 703.34 | 747 | 724 | 181.4 |
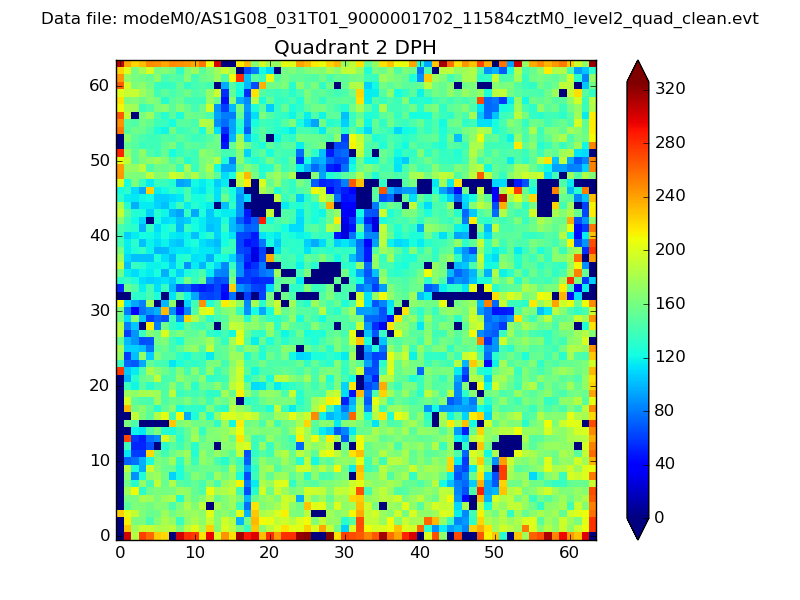
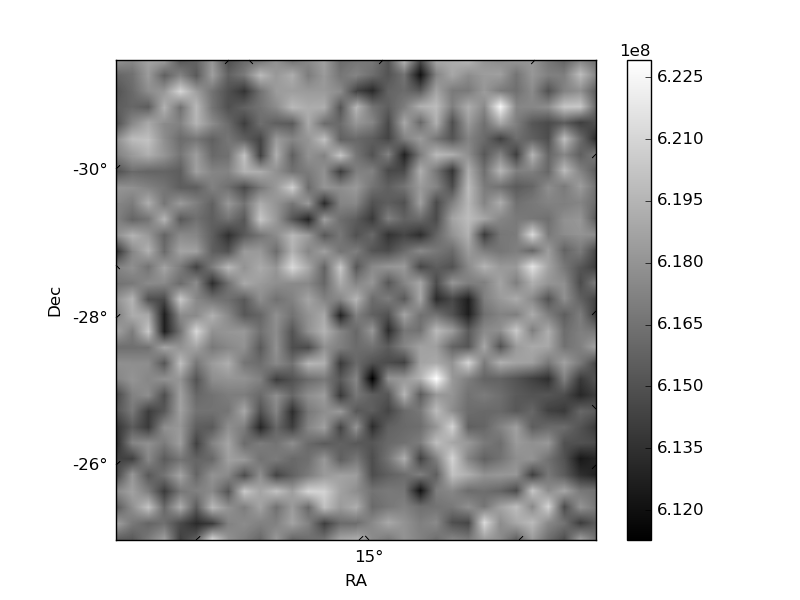
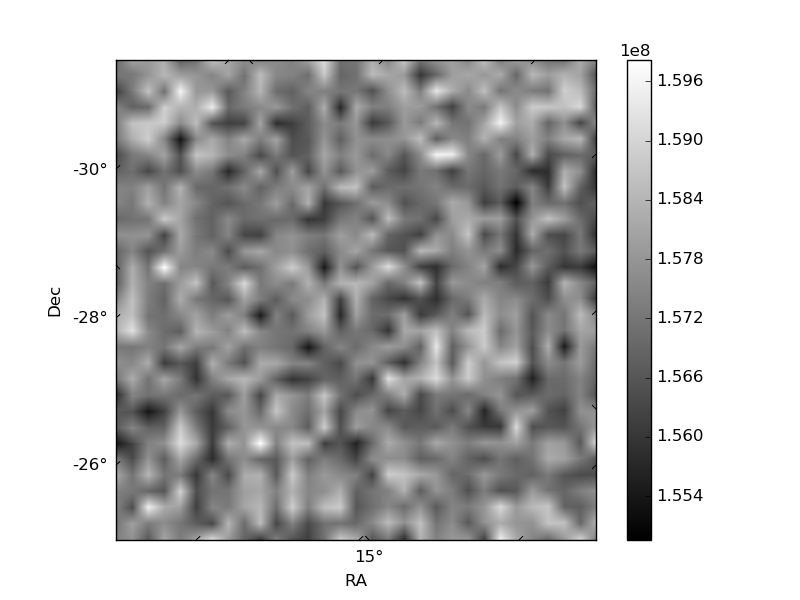
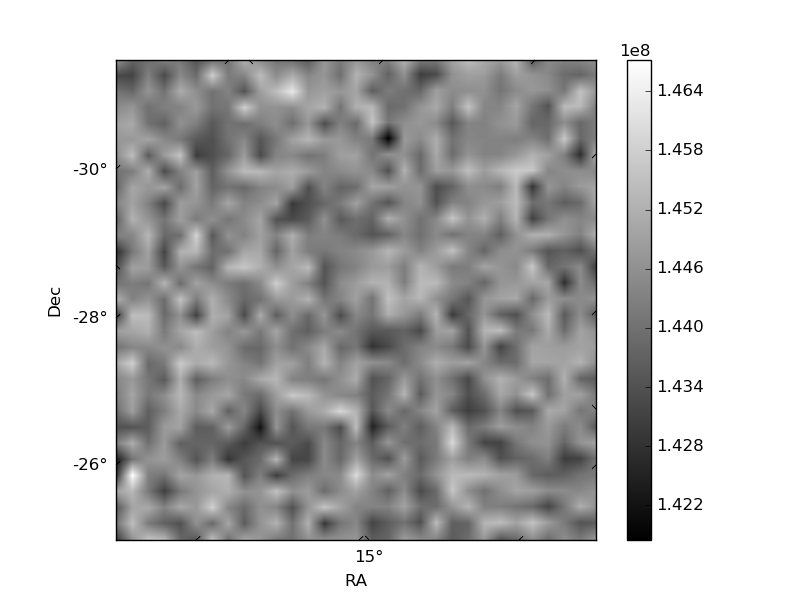
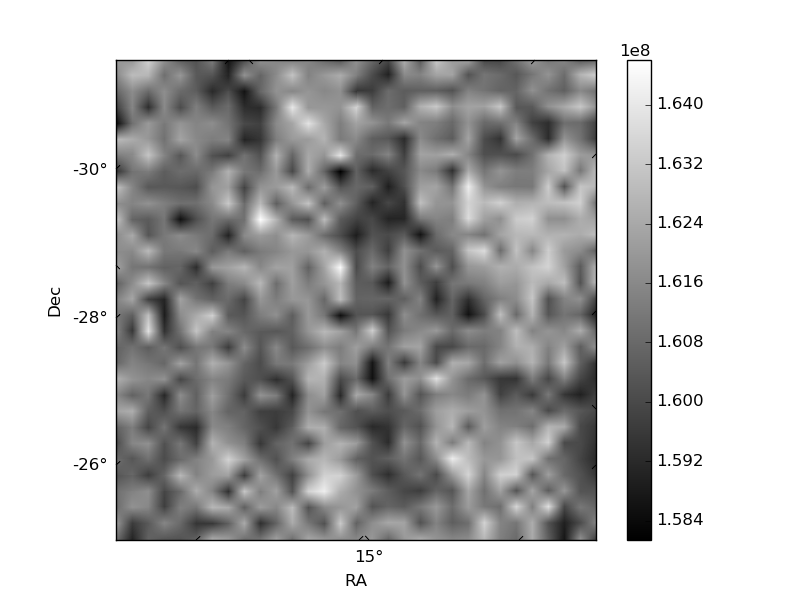
Histogram calculated using DETX and DETY for each event in the final _common_clean file
| Quadrant A | 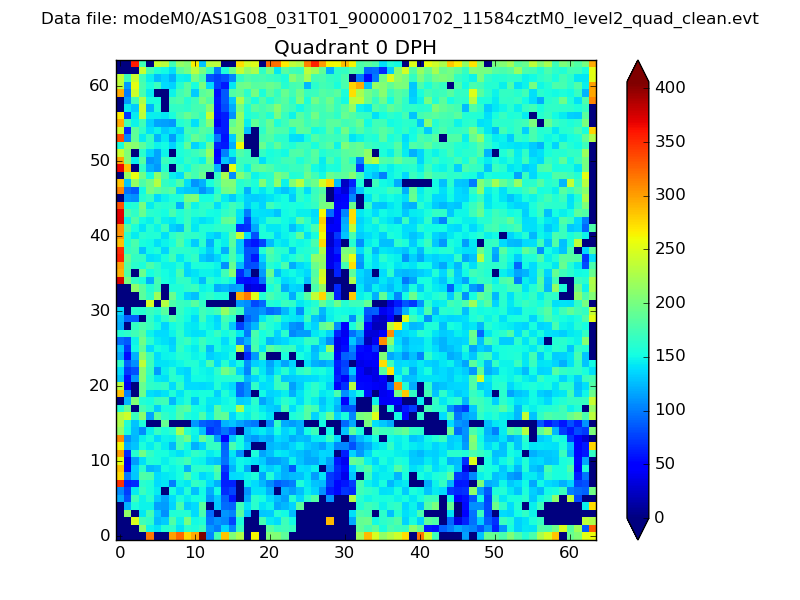 |
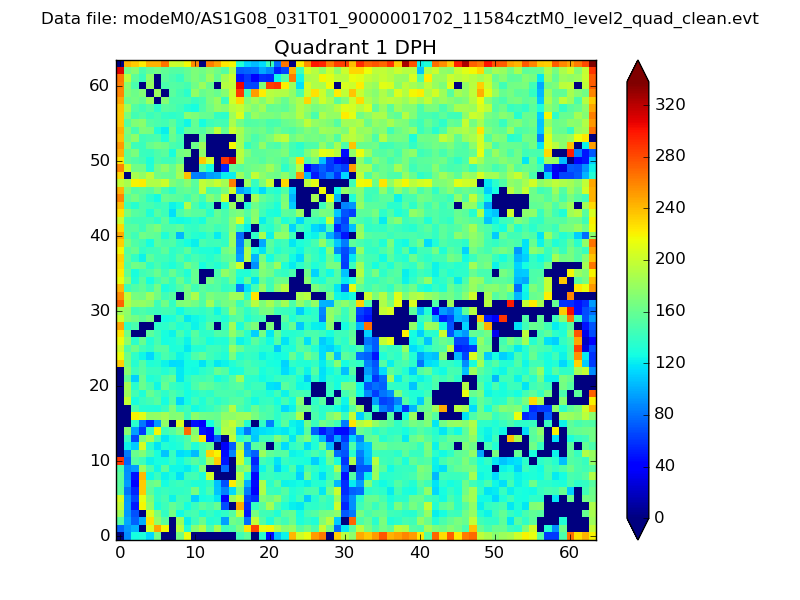 |
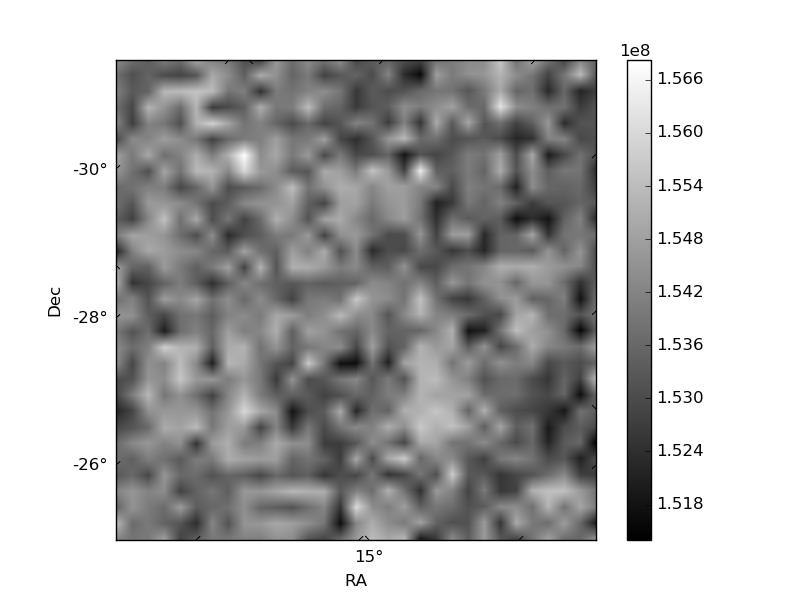
Quadrant B |
|---|---|---|---|
| Quadrant D | 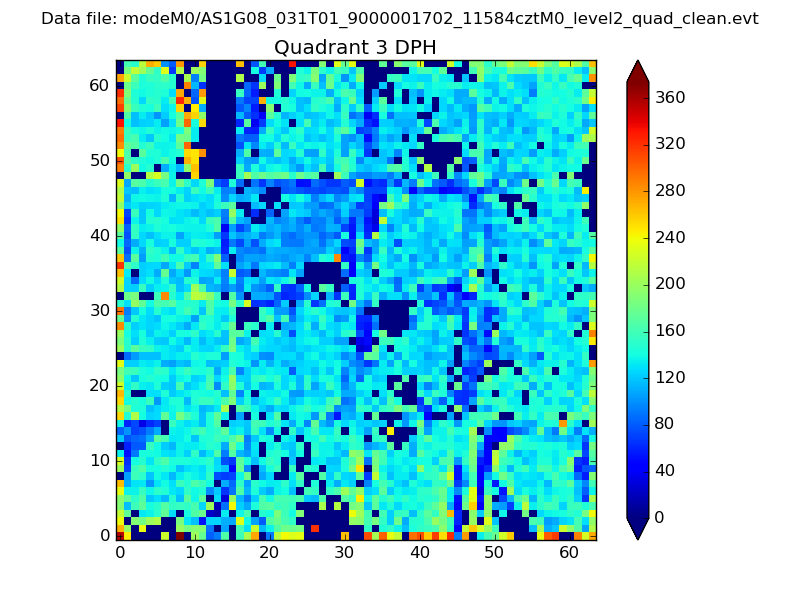 |
 |
Quadrant C |
| Plot type | Count rate plots | Images |
|---|---|---|
| Comparison with Poisson distribution Blue bars denote a histogram of data divided into 1 sec bins. Red curve is a Poisson curve with rate = median count rate of data. |
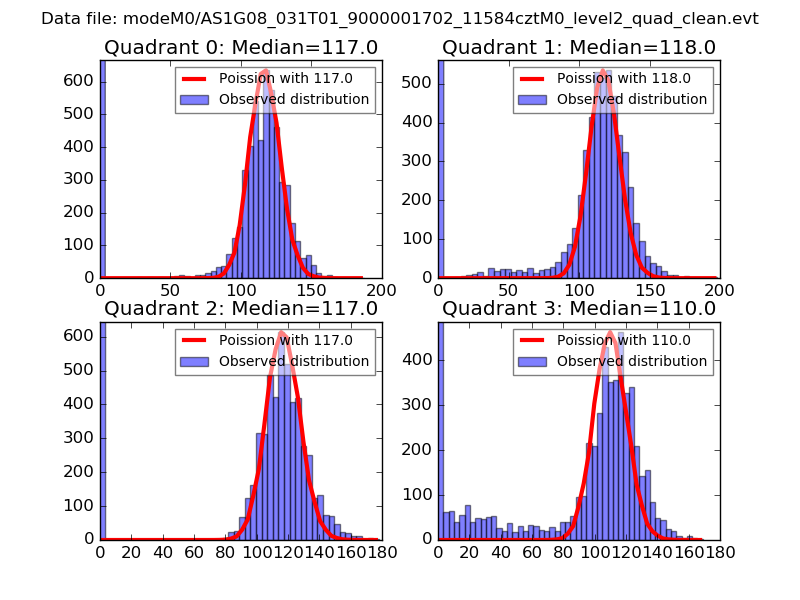 |
 |
| Quadrant-wise count rates Data is divided into 100 sec bins |
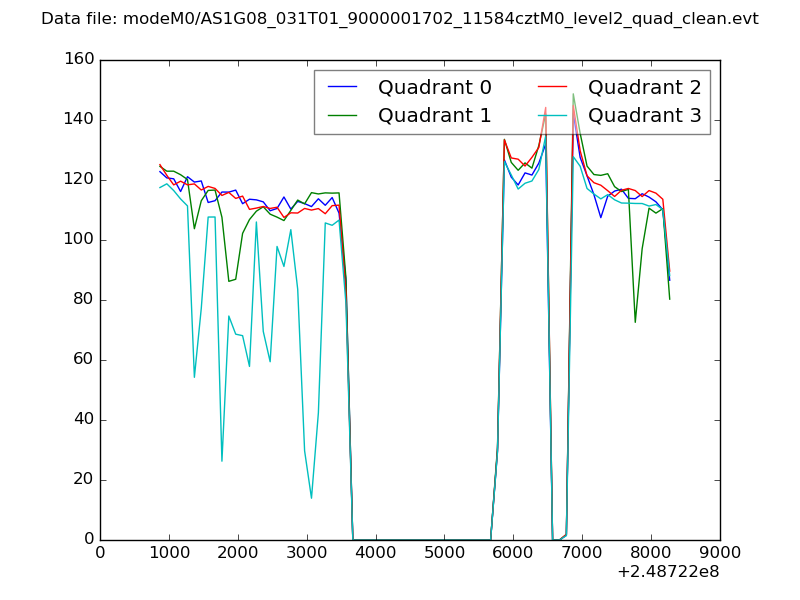 |
|
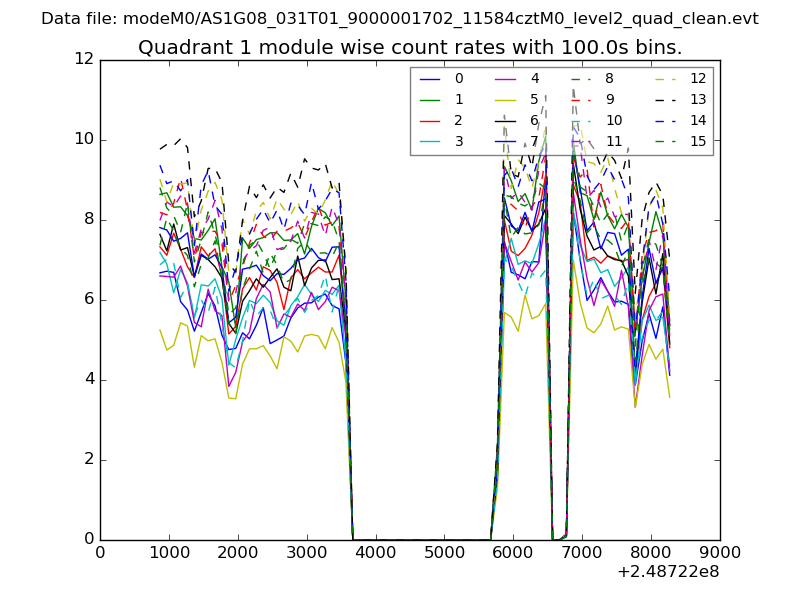
| Module-wise count rates for Quadrant A Data is divided into 100 sec bins |
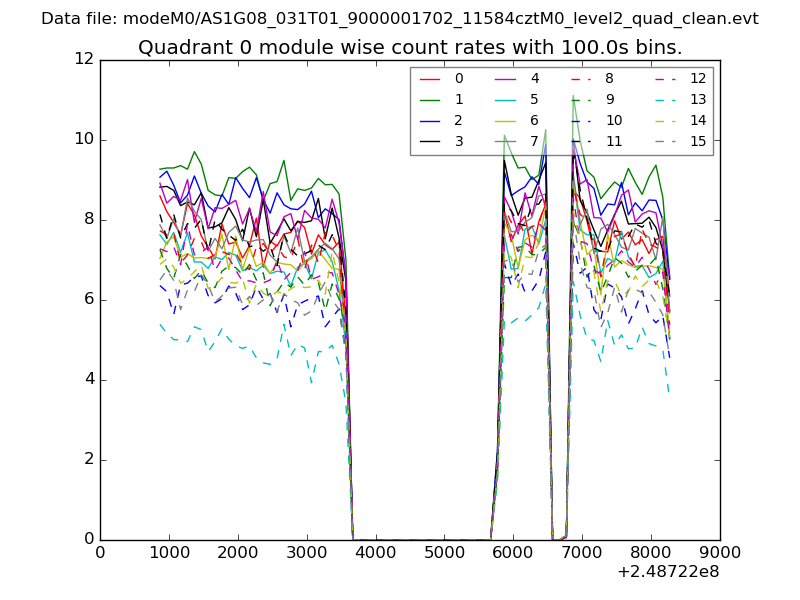 |
 |
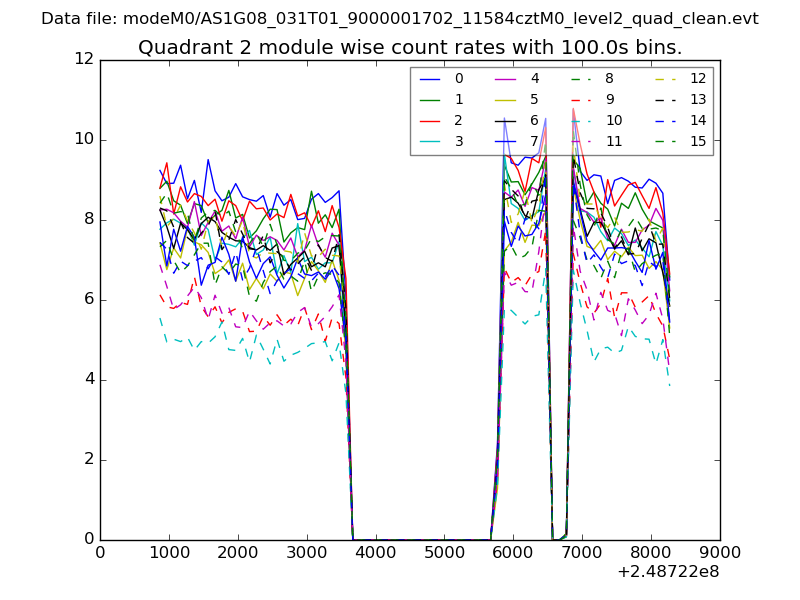
| Module-wise count rates for Quadrant B Data is divided into 100 sec bins |
 |
 |
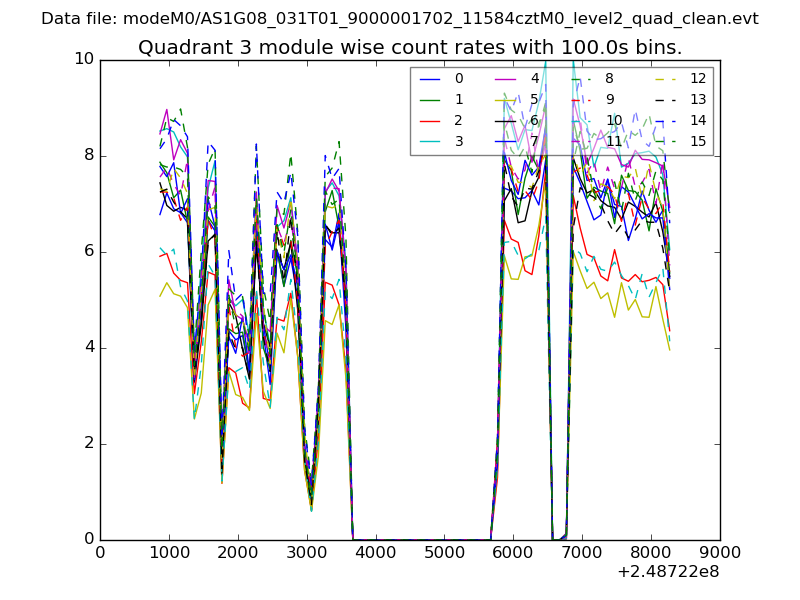
| Module-wise count rates for Quadrant C Data is divided into 100 sec bins |
 |
 |
| Module-wise count rates for Quadrant D Data is divided into 100 sec bins |
 |
 |
| Parameter | Plot |
|---|---|
| CZT HV Monitor | 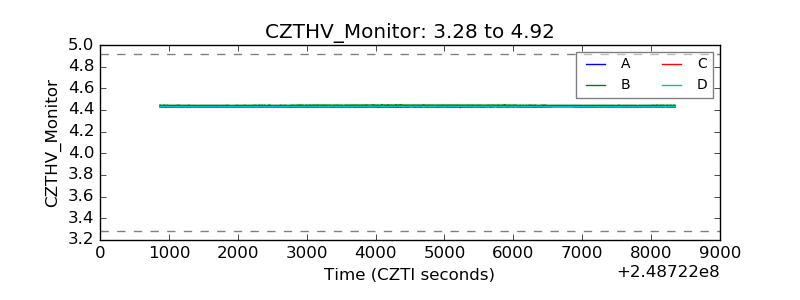 |
| D_VDD | 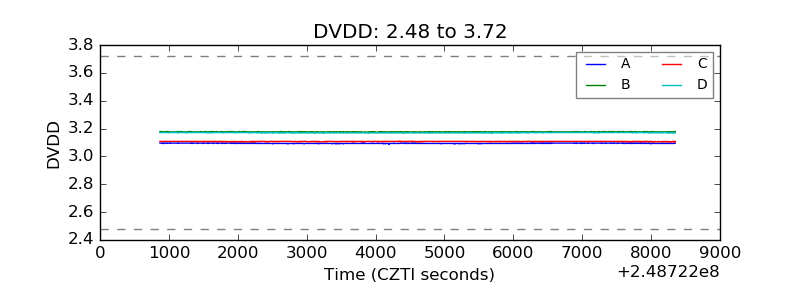 |
| Temperature 1 | 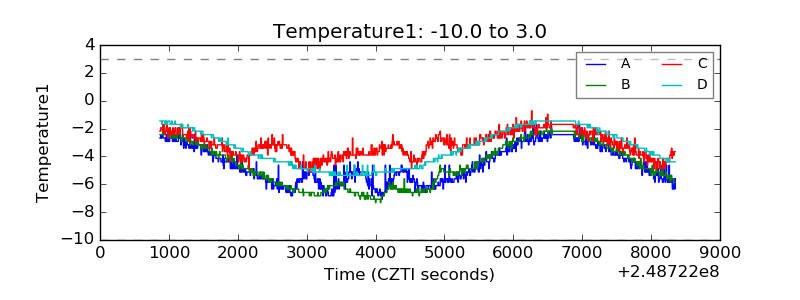 |
| Veto HV Monitor | 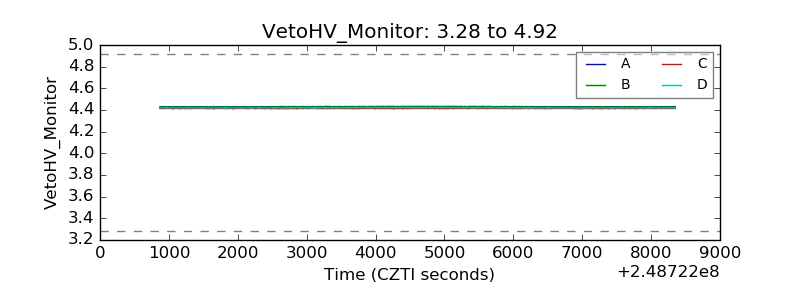 |
| Veto LLD | 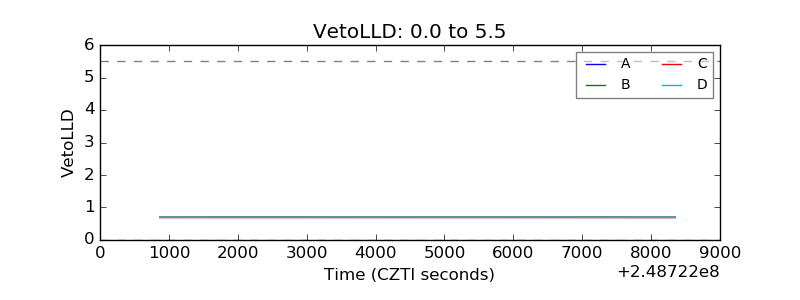 |
| Alpha Counter | 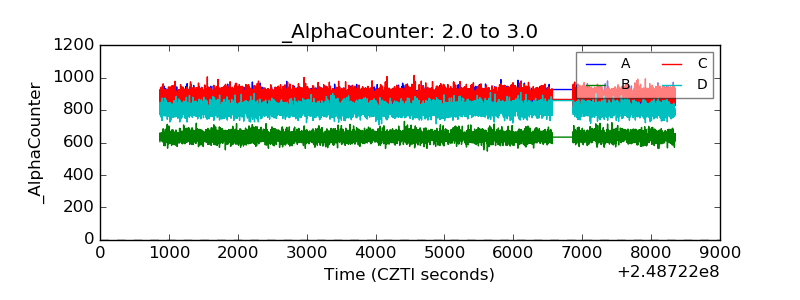 |
| _CPM_Rate | 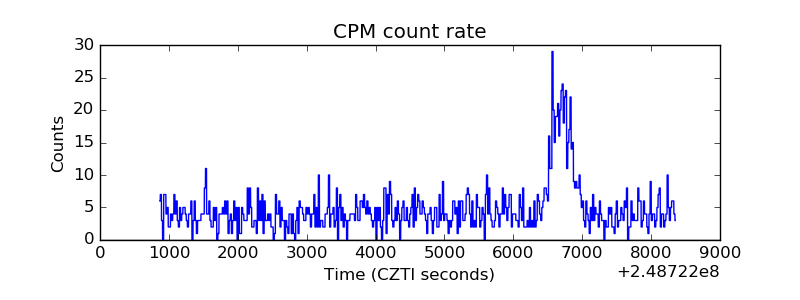 |
| CZT Counter | 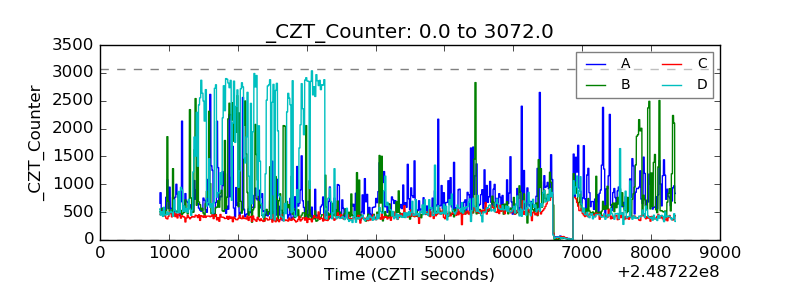 |
| +2.5 Volts monitor |  |
| +5 Volts monitor |  |
| _ROLL_ROT | 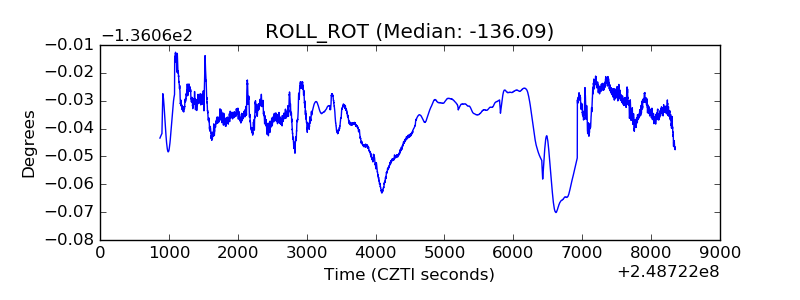 |
| _Roll_DEC | 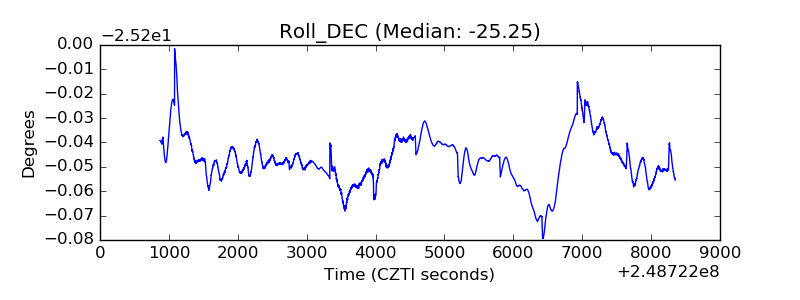 |
| _Roll_RA | 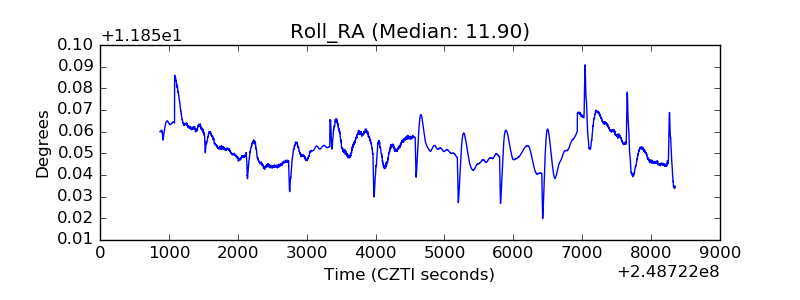 |
| Veto Counter | 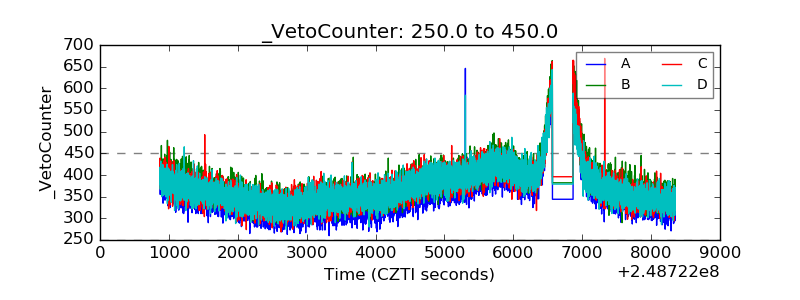 |