| Param | Original file | Final file |
|---|---|---|
| Filename | modeM0/AS1G08_031T01_9000001702_11587cztM0_level2.evt | modeM0/AS1G08_031T01_9000001702_11587cztM0_level2_quad_clean.evt |
| Size (bytes) | 1,007,003,520 | 163,298,880 |
| Size | 960.4 MB | 155.7 MB |
| Events in quadrant A | 8,719,629 | 1,014,436 |
| Events in quadrant B | 8,047,603 | 1,017,267 |
| Events in quadrant C | 5,851,380 | 1,021,855 |
| Events in quadrant D | 6,982,901 | 976,501 |
| Mode M0 | |||
|---|---|---|---|
| Quadrant | BADHDUFLAG | Total packets | Discarded packets |
| A | 0 | 34848 | 4 |
| B | 0 | 32612 | 3 |
| C | 0 | 26858 | 3 |
| D | 0 | 30130 | 3 |
| Mode M9 | |||
|---|---|---|---|
| Quadrant | BADHDUFLAG | Total packets | Discarded packets |
| A | 0 | 17 | 0 |
| B | 0 | 17 | 0 |
| C | 0 | 17 | 0 |
| D | 0 | 17 | 0 |
| Mode SS | |||
|---|---|---|---|
| Quadrant | BADHDUFLAG | Total packets | Discarded packets |
| A | 0 | 272 | 0 |
| B | 0 | 272 | 0 |
| C | 0 | 272 | 0 |
| D | 0 | 272 | 0 |
| Quadrant | Total seconds | Saturated seconds | Saturation percentage |
|---|---|---|---|
| A | 13244 | 578 | 4.364240% |
| B | 13244 | 523 | 3.948958% |
| C | 13244 | 26 | 0.196315% |
| D | 13244 | 219 | 1.653579% |
Noise dominated data is calculated using 1-second bins in cleaned event files. If a bin has >2000 counts, and if more than 50% of those come from <1% of pixels, then it is considered to be noise-dominated and hence unusable.
| Quadrant | # 1 sec bins | Bins with >0 counts | Bins with >2000 counts | High rate bins dominated by noise | Noise dominated (total time) | Noise dominated (detector-on time) | Marked lightcurve |
|---|---|---|---|---|---|---|---|
| A | 15015 | 13246 | 315 | 315 | 2.10% | 2.38% | 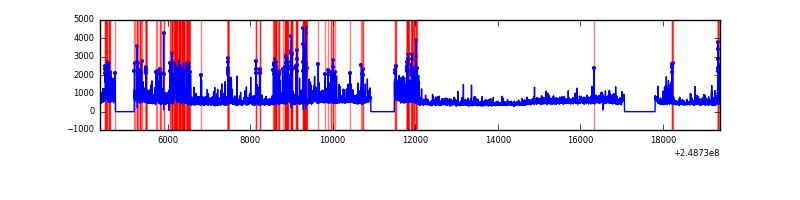 |
| B | 15015 | 13246 | 251 | 251 | 1.67% | 1.89% | 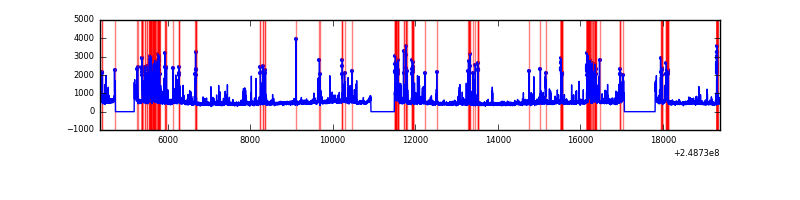 |
| C | 15015 | 13246 | 2 | 2 | 0.01% | 0.02% | 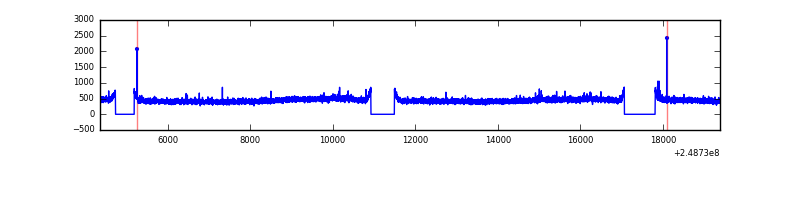 |
| D | 15015 | 13246 | 167 | 167 | 1.11% | 1.26% | 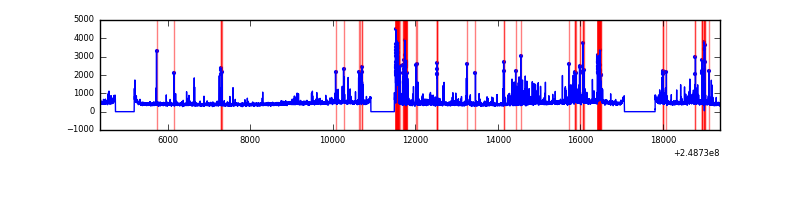 |
Top three noisy pixels from each quadrant. If the there are fewer than three noisy pixels in the level2.evt file, extra rows are filled as -1
| Pixel properties | Quadrant properties | ||||||
|---|---|---|---|---|---|---|---|
| Quadrant | DetID | PixID | Counts | Sigma | Mean | Median | Sigma |
| A | 8 | 5 | 2042875 | 6562.0 | 1520 | 1485 | 311.1 |
| A | 1 | 162 | 310127 | 992.12 | 1520 | 1485 | 311.1 |
| A | 1 | 178 | 177465 | 565.68 | 1520 | 1485 | 311.1 |
| B | 4 | 239 | 1582295 | 5385.53 | 1526 | 1489 | 293.5 |
| B | 4 | 81 | 193010 | 652.48 | 1526 | 1489 | 293.5 |
| B | 11 | 51 | 98971 | 332.1 | 1526 | 1489 | 293.5 |
| C | 9 | 54 | 29413 | 80.74 | 1491 | 1497 | 345.8 |
| C | 13 | 61 | 10972 | 27.4 | 1491 | 1497 | 345.8 |
| C | 12 | 4 | 4993 | 10.11 | 1491 | 1497 | 345.8 |
| D | 1 | 52 | 552623 | 1547.85 | 1474 | 1431 | 356.1 |
| D | 13 | 122 | 326905 | 913.99 | 1474 | 1431 | 356.1 |
| D | 10 | 199 | 147628 | 410.55 | 1474 | 1431 | 356.1 |
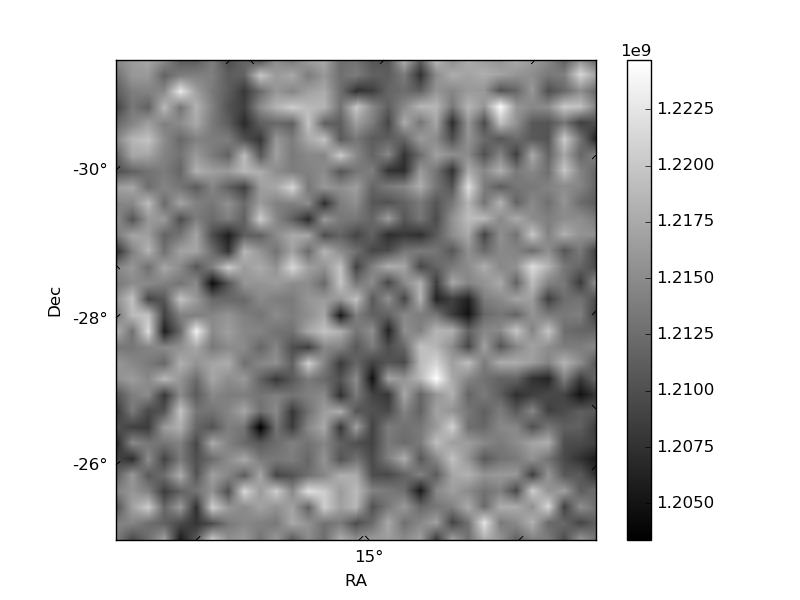
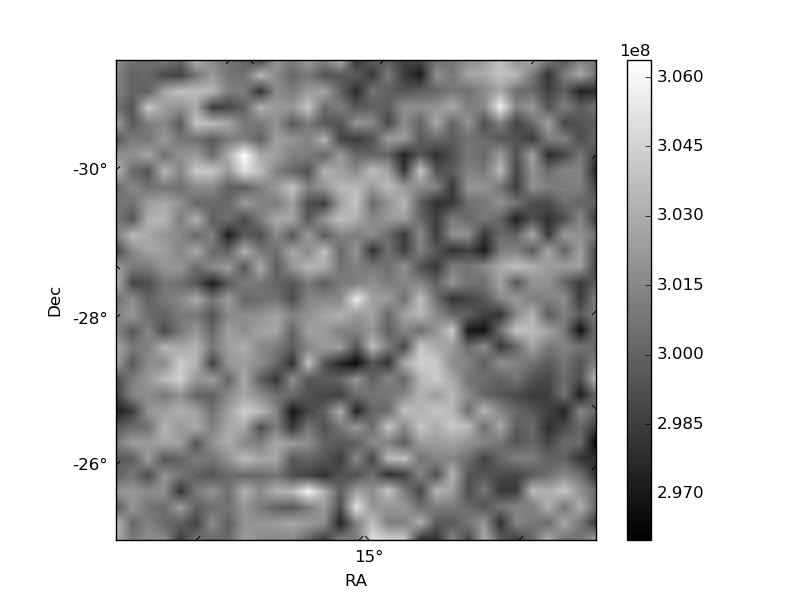
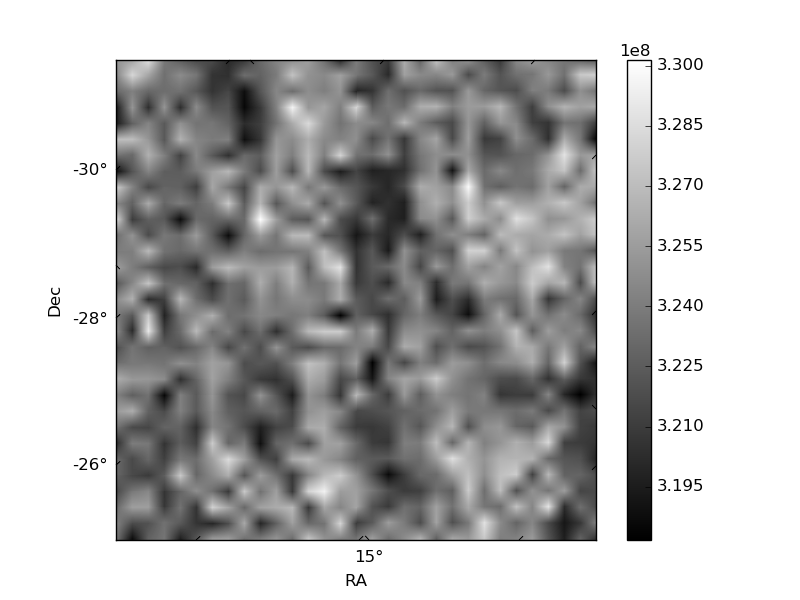
Histogram calculated using DETX and DETY for each event in the final _common_clean file
| Quadrant A | 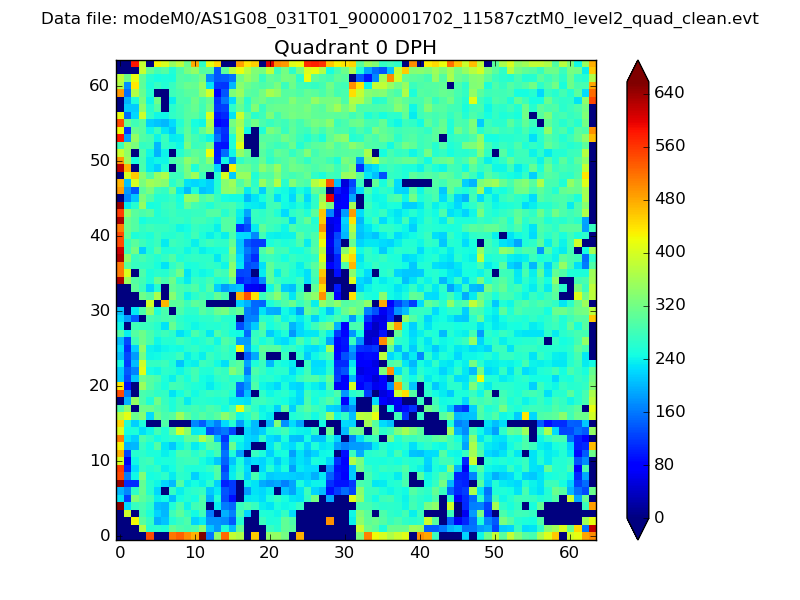 |
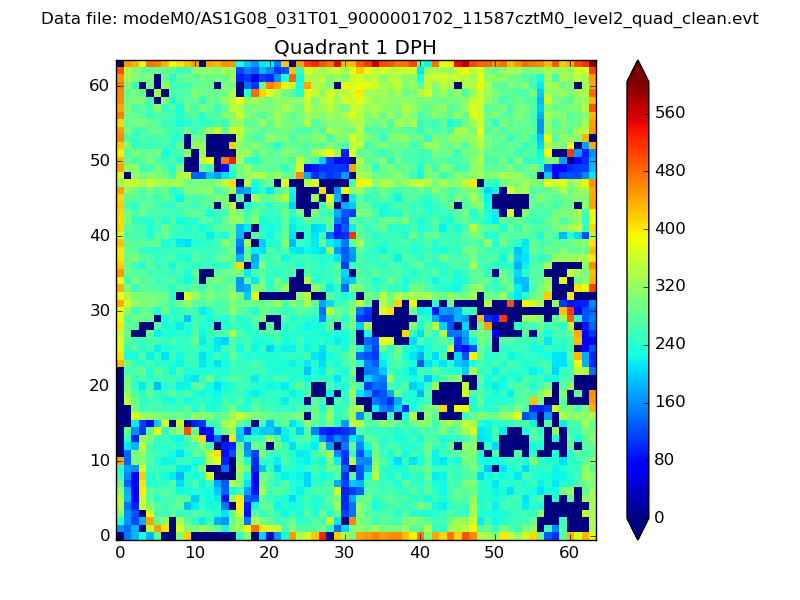 |
Quadrant B |
|---|---|---|---|
| Quadrant D | 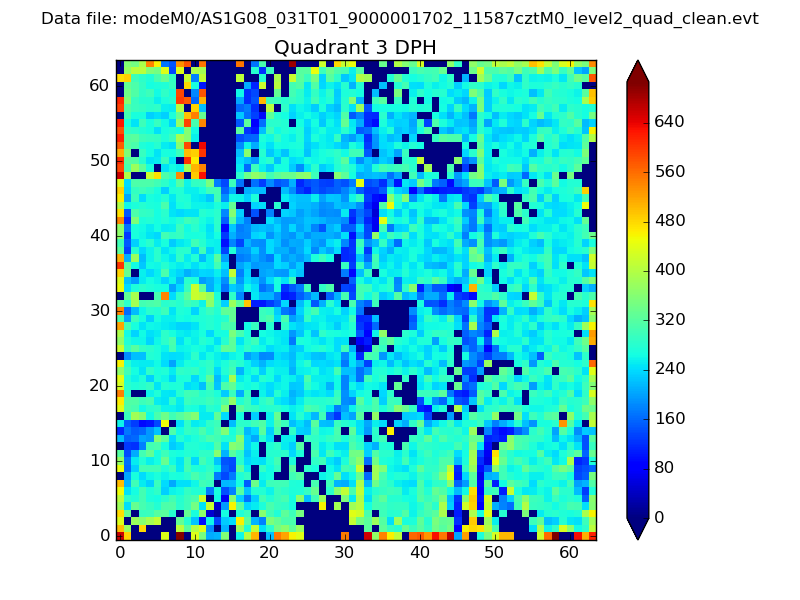 |
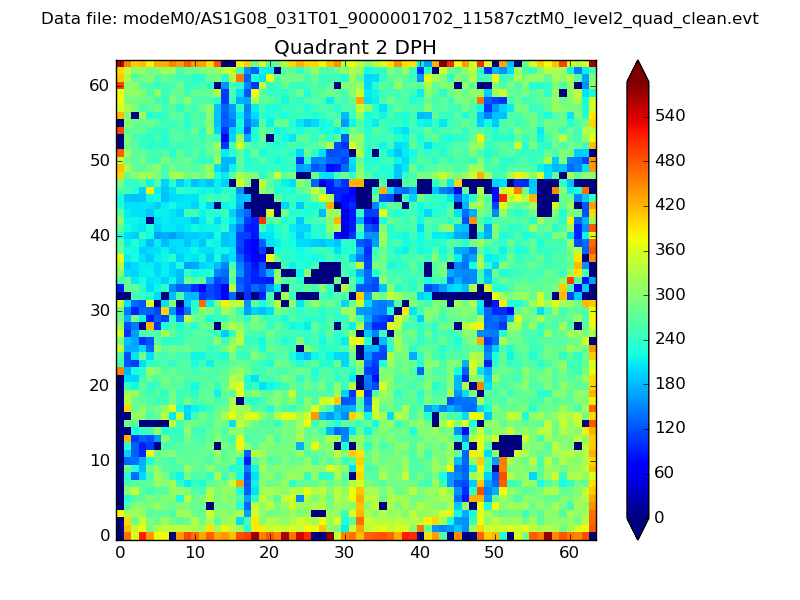 |
Quadrant C |
| Plot type | Count rate plots | Images |
|---|---|---|
| Comparison with Poisson distribution Blue bars denote a histogram of data divided into 1 sec bins. Red curve is a Poisson curve with rate = median count rate of data. |
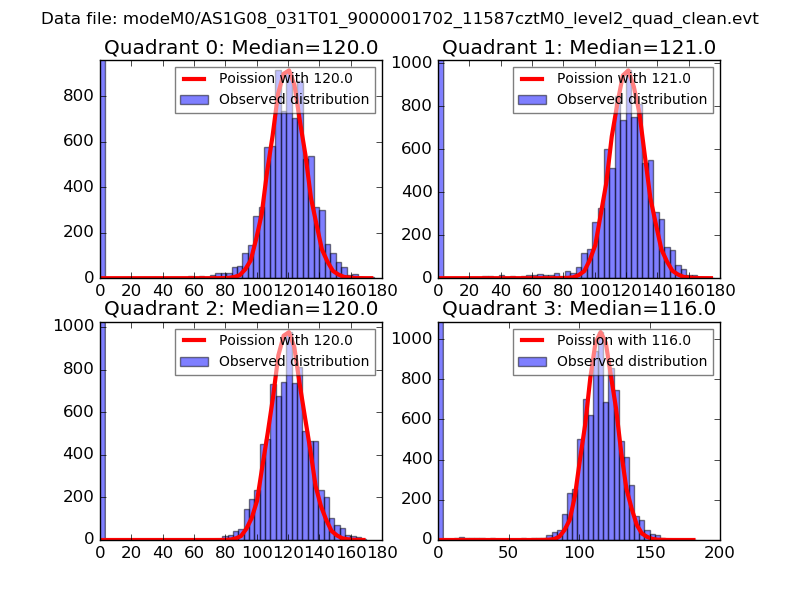 |
 |
| Quadrant-wise count rates Data is divided into 100 sec bins |
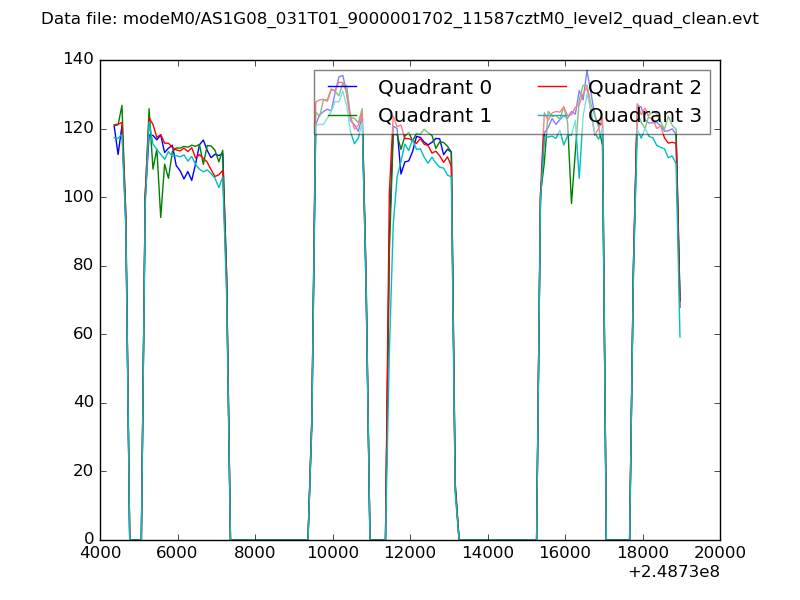 |
|
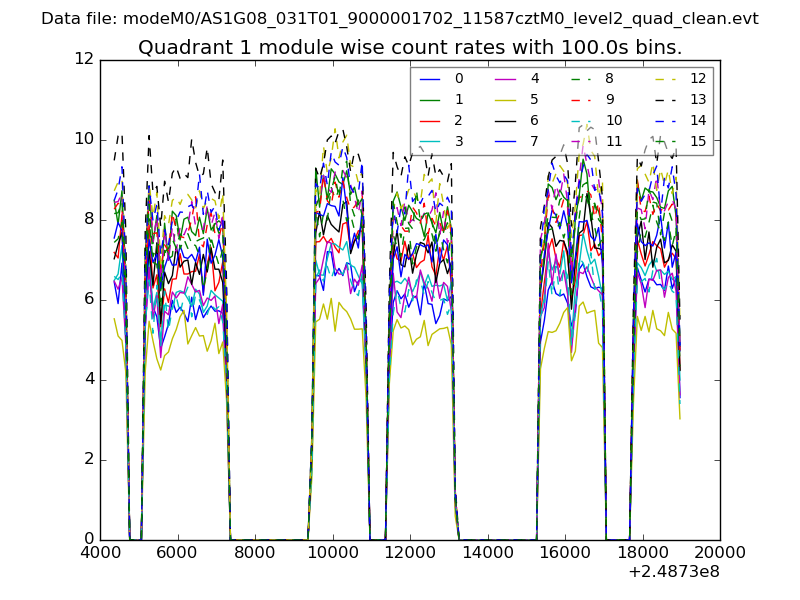
| Module-wise count rates for Quadrant A Data is divided into 100 sec bins |
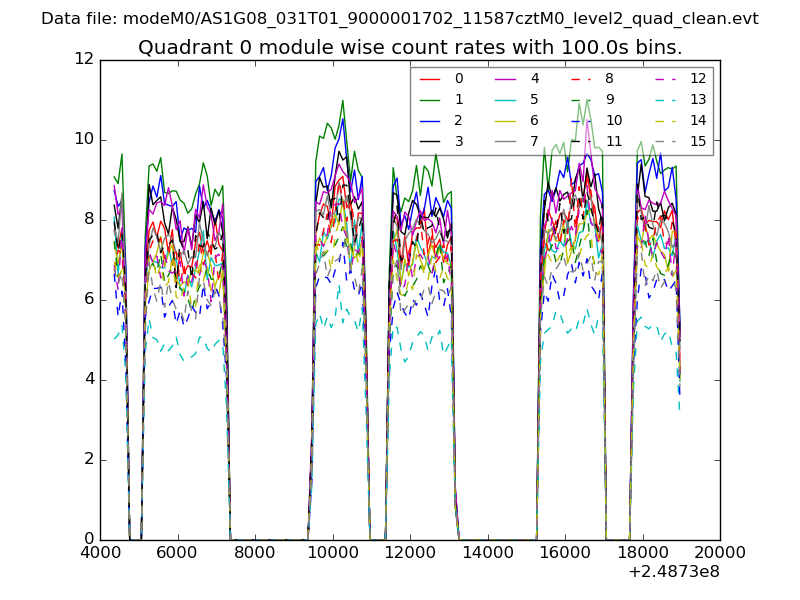 |
 |
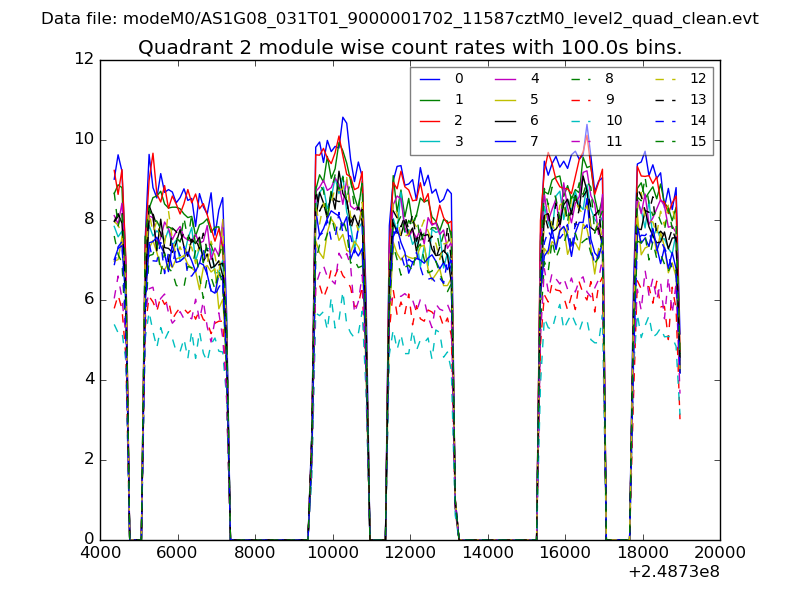
| Module-wise count rates for Quadrant B Data is divided into 100 sec bins |
 |
 |
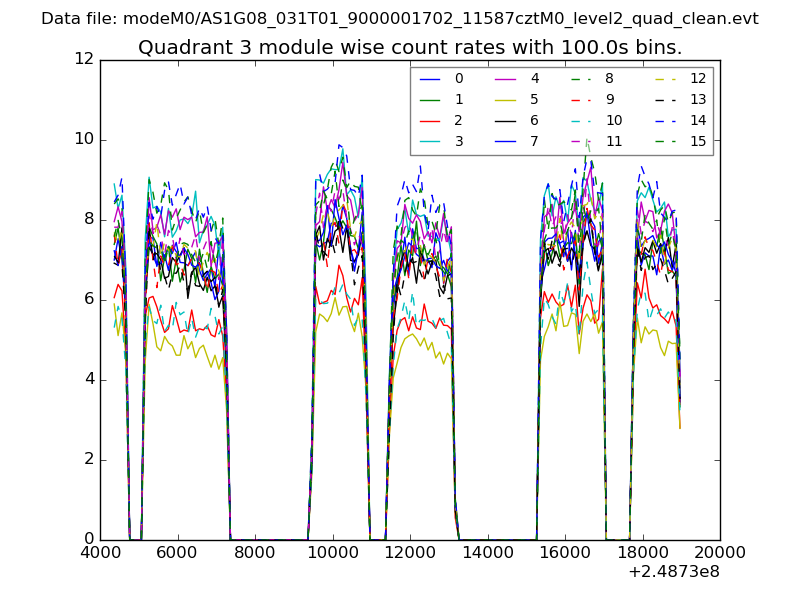
| Module-wise count rates for Quadrant C Data is divided into 100 sec bins |
 |
 |
| Module-wise count rates for Quadrant D Data is divided into 100 sec bins |
 |
 |
| Parameter | Plot |
|---|---|
| CZT HV Monitor | 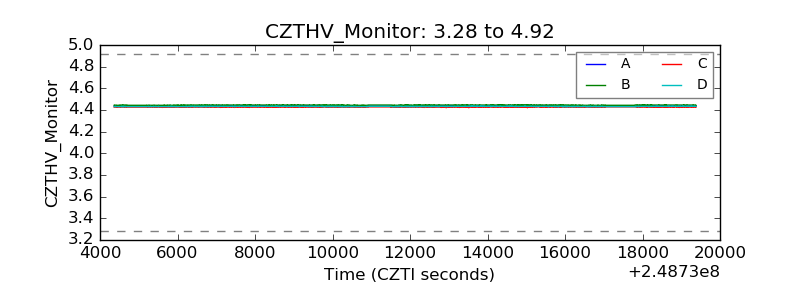 |
| D_VDD | 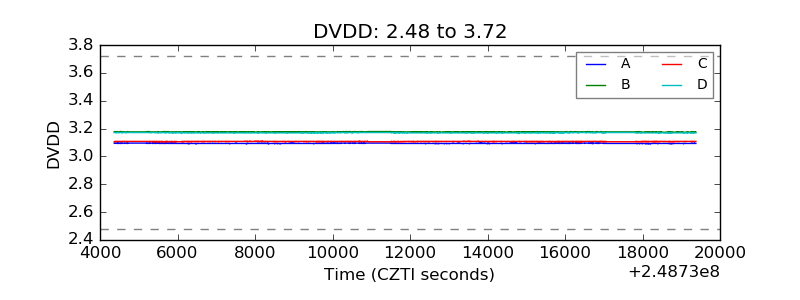 |
| Temperature 1 | 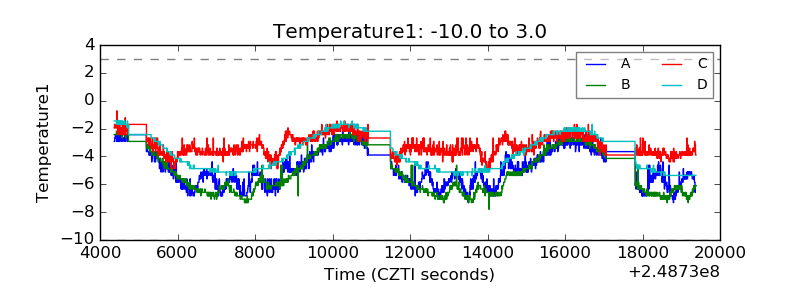 |
| Veto HV Monitor | 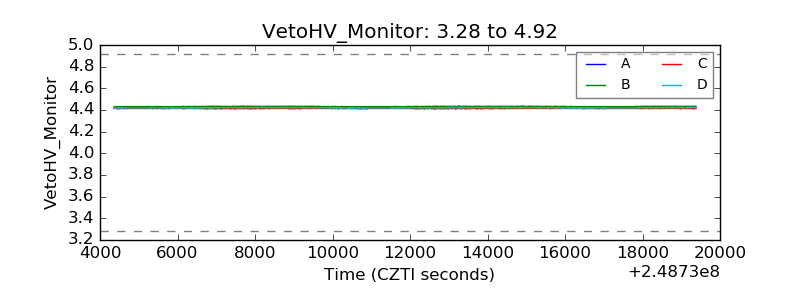 |
| Veto LLD | 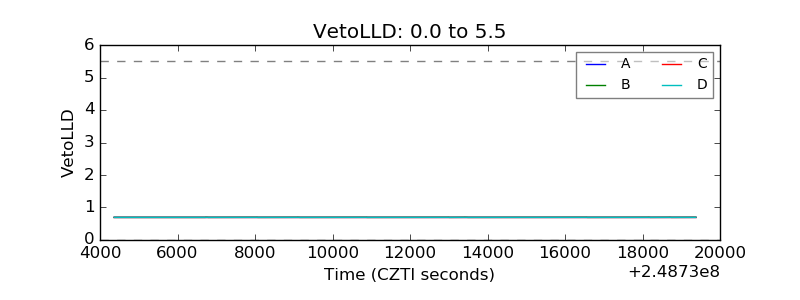 |
| Alpha Counter | 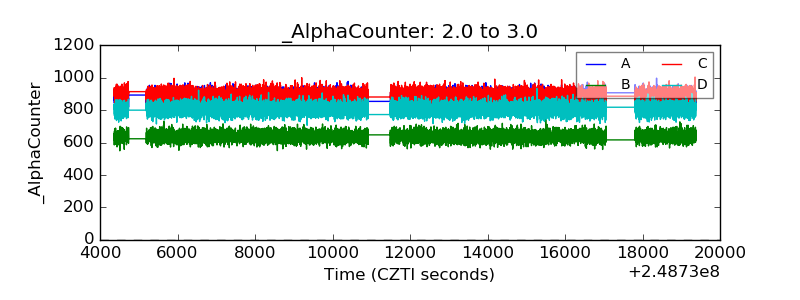 |
| _CPM_Rate | 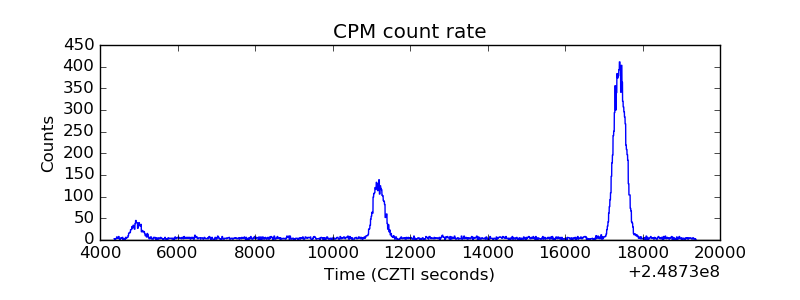 |
| CZT Counter | 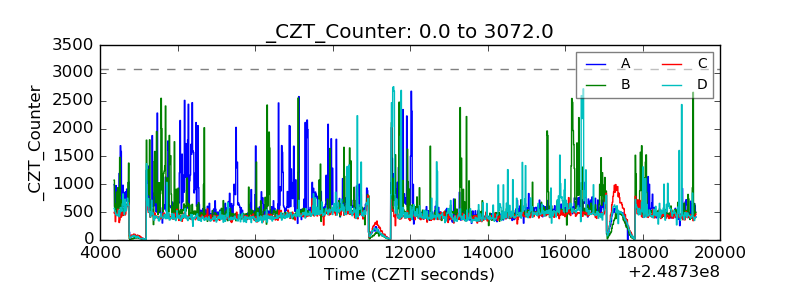 |
| +2.5 Volts monitor | 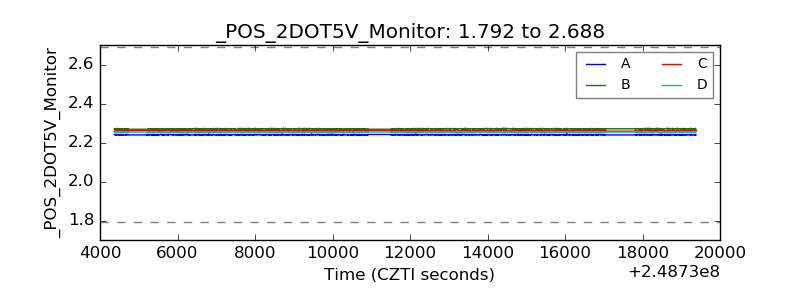 |
| +5 Volts monitor |  |
| _ROLL_ROT | 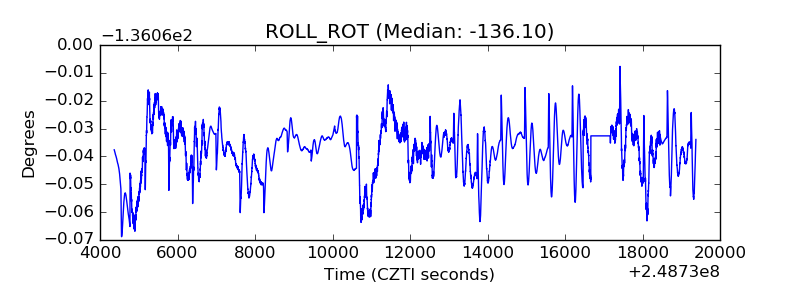 |
| _Roll_DEC | 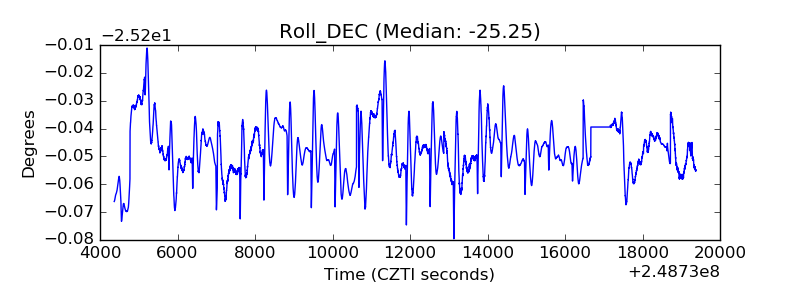 |
| _Roll_RA | 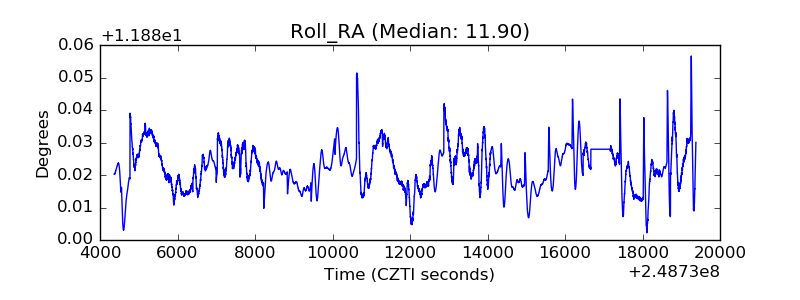 |
| Veto Counter | 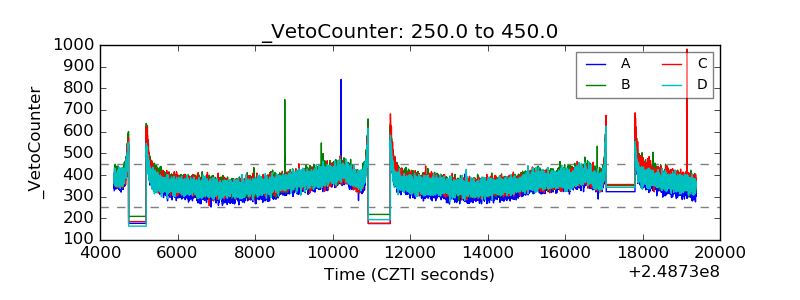 |