| Param | Original file | Final file |
|---|---|---|
| Filename | modeM0/AS1G08_031T01_9000001702_11588cztM0_level2.evt | modeM0/AS1G08_031T01_9000001702_11588cztM0_level2_quad_clean.evt |
| Size (bytes) | 575,389,440 | 93,608,640 |
| Size | 548.7 MB | 89.3 MB |
| Events in quadrant A | 4,295,848 | 587,180 |
| Events in quadrant B | 4,851,657 | 576,196 |
| Events in quadrant C | 3,410,167 | 586,744 |
| Events in quadrant D | 4,356,075 | 559,088 |
| Mode M0 | |||
|---|---|---|---|
| Quadrant | BADHDUFLAG | Total packets | Discarded packets |
| A | 0 | 17583 | 3 |
| B | 0 | 19308 | 2 |
| C | 0 | 15359 | 2 |
| D | 0 | 17927 | 2 |
| Mode M9 | |||
|---|---|---|---|
| Quadrant | BADHDUFLAG | Total packets | Discarded packets |
| A | 0 | 16 | 0 |
| B | 0 | 16 | 0 |
| C | 0 | 16 | 0 |
| D | 0 | 16 | 0 |
| Mode SS | |||
|---|---|---|---|
| Quadrant | BADHDUFLAG | Total packets | Discarded packets |
| A | 0 | 156 | 0 |
| B | 0 | 156 | 0 |
| C | 0 | 156 | 0 |
| D | 0 | 156 | 0 |
| Quadrant | Total seconds | Saturated seconds | Saturation percentage |
|---|---|---|---|
| A | 7545 | 144 | 1.908549% |
| B | 7545 | 410 | 5.434062% |
| C | 7545 | 42 | 0.556660% |
| D | 7545 | 223 | 2.955600% |
Noise dominated data is calculated using 1-second bins in cleaned event files. If a bin has >2000 counts, and if more than 50% of those come from <1% of pixels, then it is considered to be noise-dominated and hence unusable.
| Quadrant | # 1 sec bins | Bins with >0 counts | Bins with >2000 counts | High rate bins dominated by noise | Noise dominated (total time) | Noise dominated (detector-on time) | Marked lightcurve |
|---|---|---|---|---|---|---|---|
| A | 9181 | 7548 | 48 | 48 | 0.52% | 0.64% |  |
| B | 9181 | 7548 | 216 | 216 | 2.35% | 2.86% |  |
| C | 9181 | 7548 | 1 | 1 | 0.01% | 0.01% |  |
| D | 9181 | 7548 | 154 | 154 | 1.68% | 2.04% | 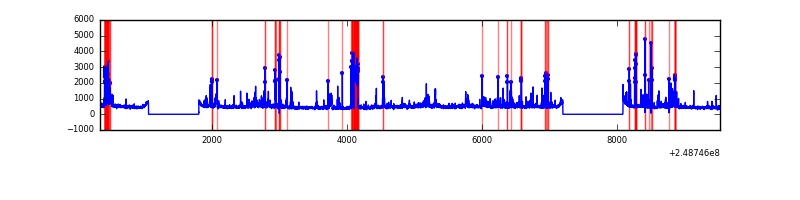 |
Top three noisy pixels from each quadrant. If the there are fewer than three noisy pixels in the level2.evt file, extra rows are filled as -1
| Pixel properties | Quadrant properties | ||||||
|---|---|---|---|---|---|---|---|
| Quadrant | DetID | PixID | Counts | Sigma | Mean | Median | Sigma |
| A | 8 | 5 | 485801 | 2632.77 | 892 | 872 | 184.2 |
| A | 1 | 162 | 143649 | 775.16 | 892 | 872 | 184.2 |
| A | 1 | 178 | 80908 | 434.53 | 892 | 872 | 184.2 |
| B | 4 | 239 | 668476 | 3965.93 | 879 | 858 | 168.3 |
| B | 3 | 64 | 482789 | 2862.87 | 879 | 858 | 168.3 |
| B | 4 | 81 | 128705 | 759.47 | 879 | 858 | 168.3 |
| C | 9 | 54 | 17957 | 84.48 | 870 | 876 | 202.2 |
| C | 13 | 61 | 6435 | 27.49 | 870 | 876 | 202.2 |
| C | 15 | 127 | 3310 | 12.04 | 870 | 876 | 202.2 |
| D | 1 | 52 | 700995 | 3400.63 | 853 | 830 | 205.9 |
| D | 13 | 122 | 122116 | 589.07 | 853 | 830 | 205.9 |
| D | 8 | 195 | 114054 | 549.92 | 853 | 830 | 205.9 |
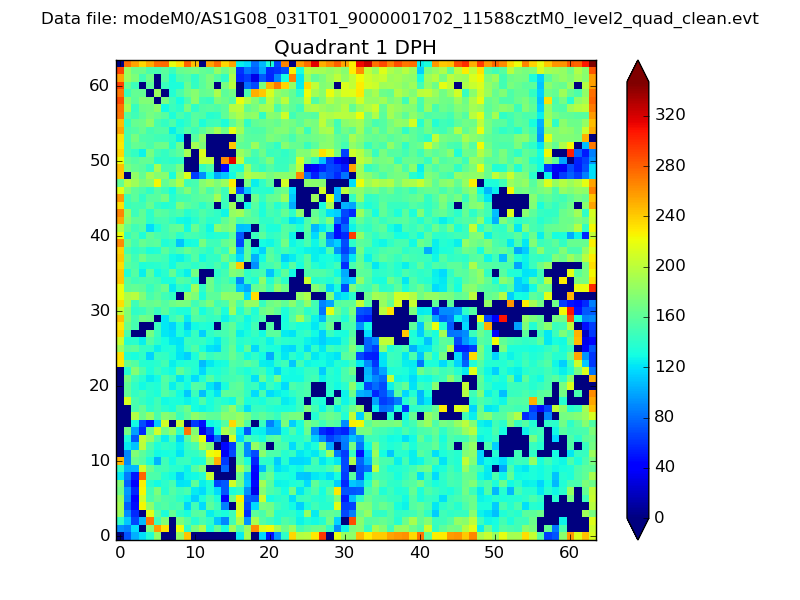
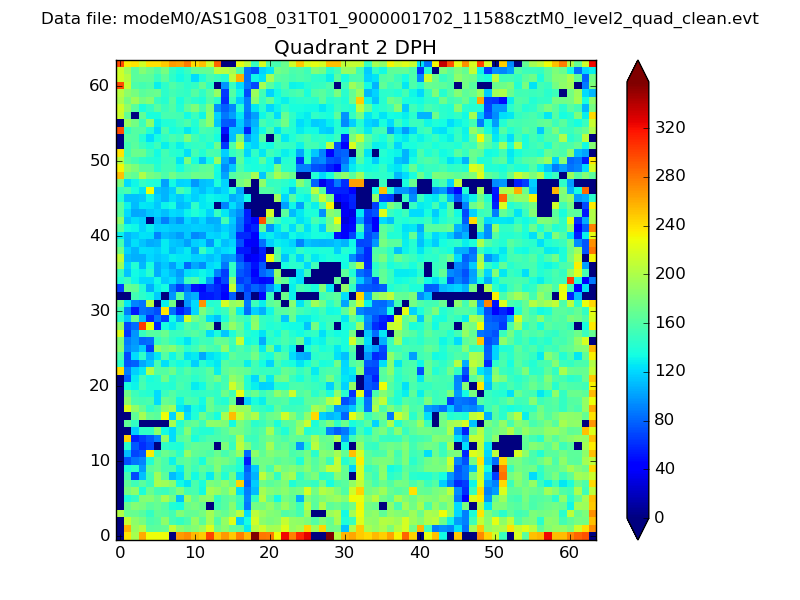
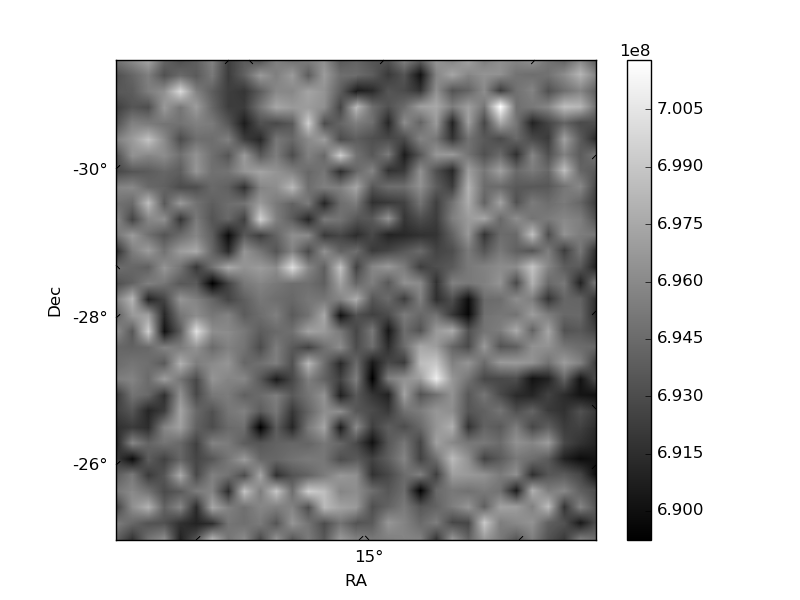
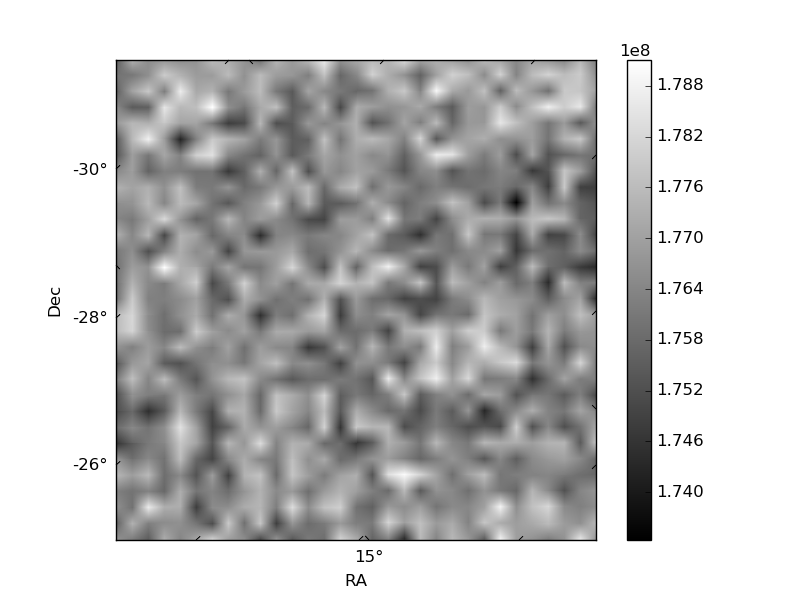
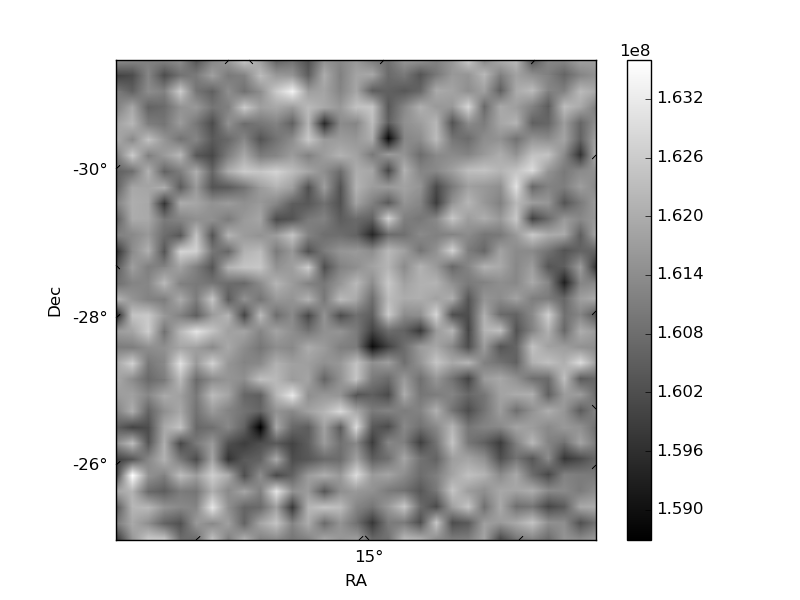
Histogram calculated using DETX and DETY for each event in the final _common_clean file
| Quadrant A |  |
 |
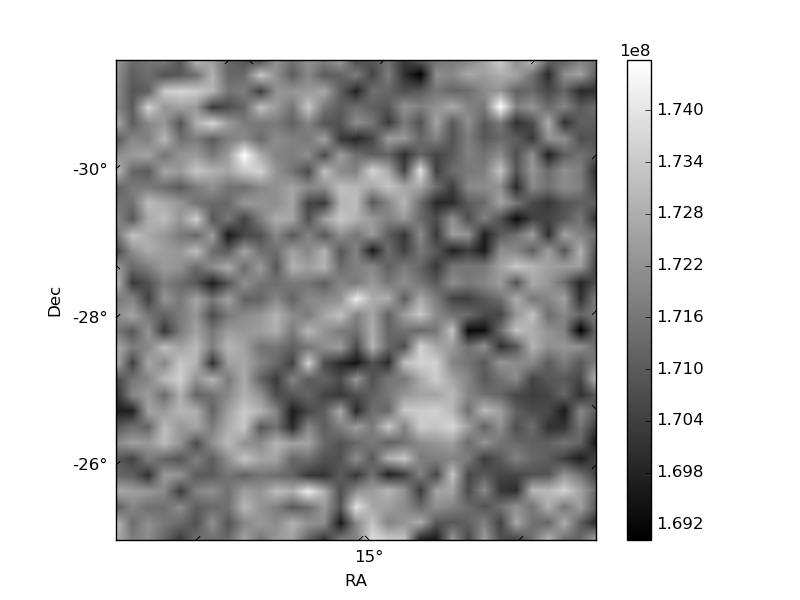
Quadrant B |
|---|---|---|---|
| Quadrant D | 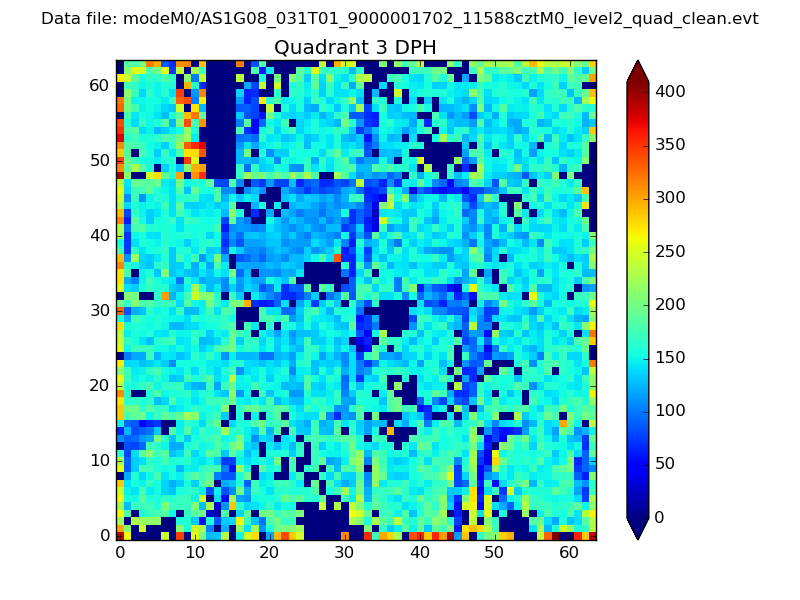 |
 |
Quadrant C |
| Plot type | Count rate plots | Images |
|---|---|---|
| Comparison with Poisson distribution Blue bars denote a histogram of data divided into 1 sec bins. Red curve is a Poisson curve with rate = median count rate of data. |
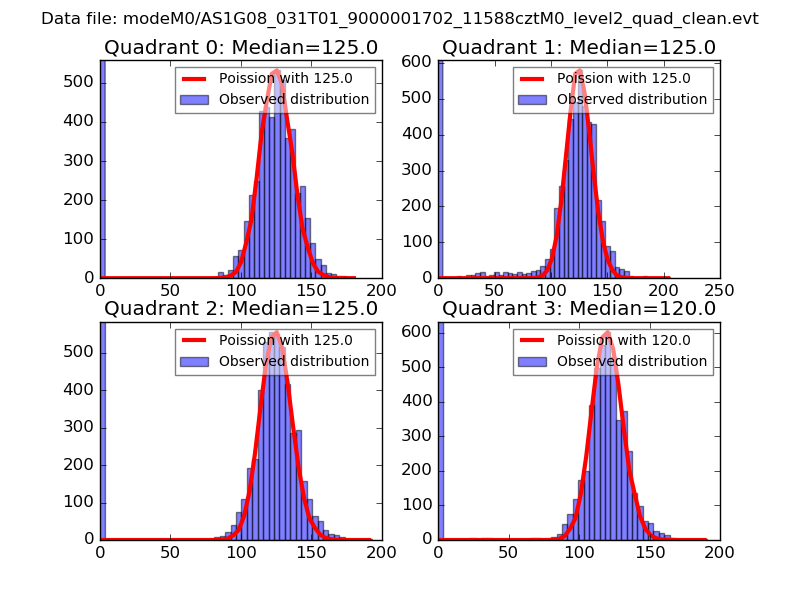 |
 |
| Quadrant-wise count rates Data is divided into 100 sec bins |
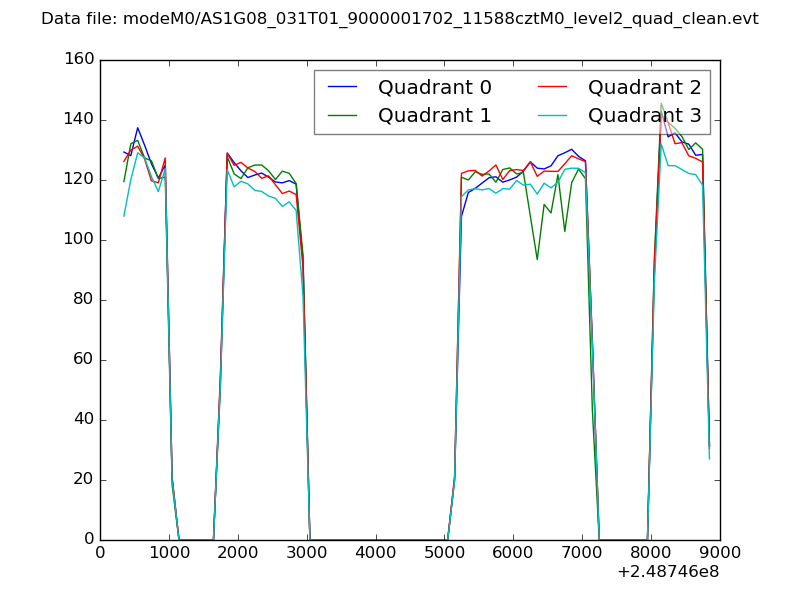 |
|
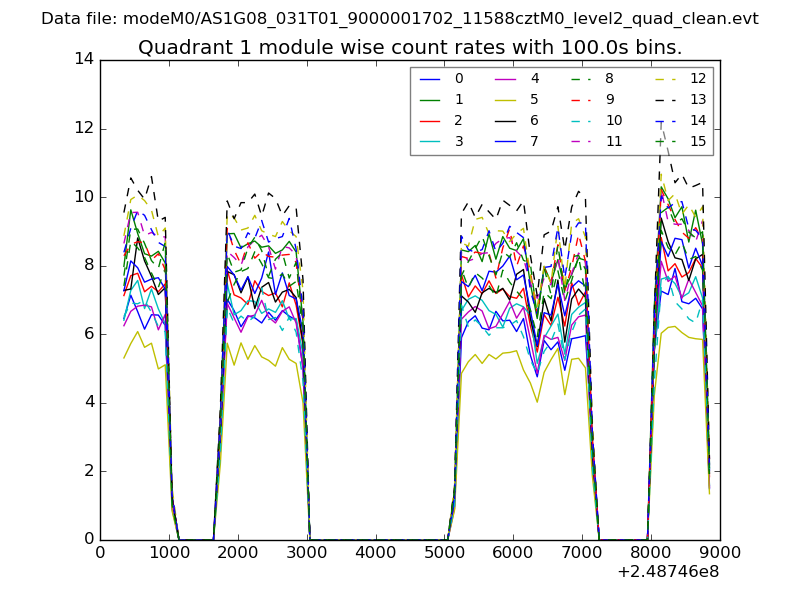
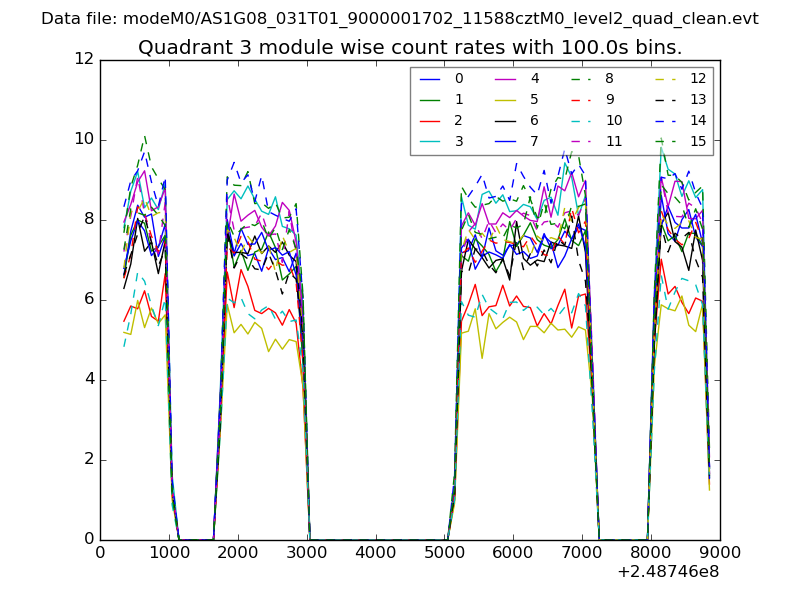
| Module-wise count rates for Quadrant A Data is divided into 100 sec bins |
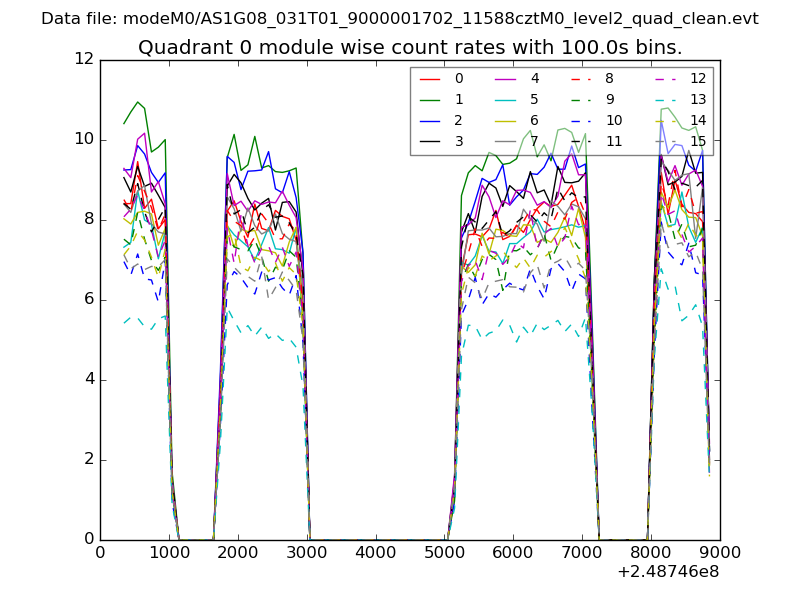 |
 |
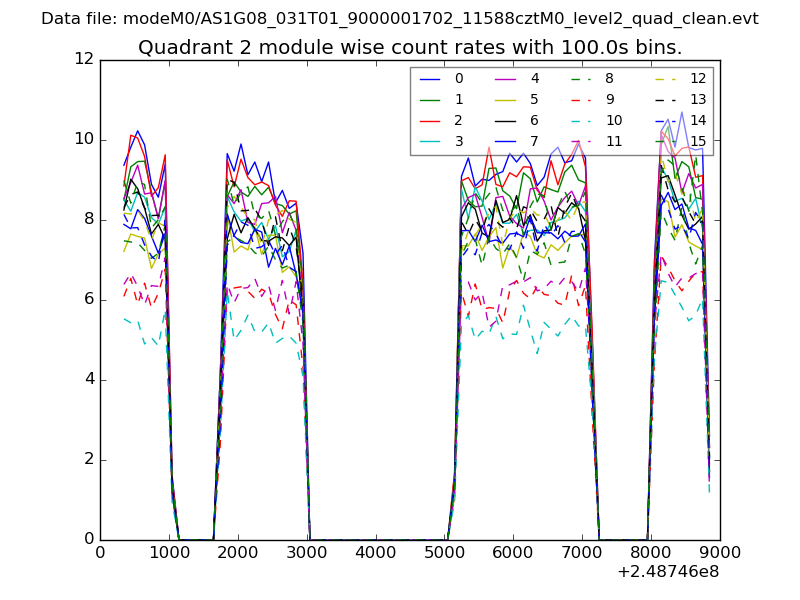
| Module-wise count rates for Quadrant B Data is divided into 100 sec bins |
 |
 |
| Module-wise count rates for Quadrant C Data is divided into 100 sec bins |
 |
 |
| Module-wise count rates for Quadrant D Data is divided into 100 sec bins |
 |
 |
| Parameter | Plot |
|---|---|
| CZT HV Monitor | 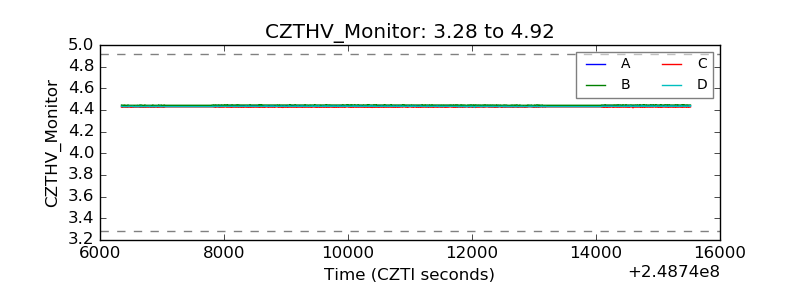 |
| D_VDD | 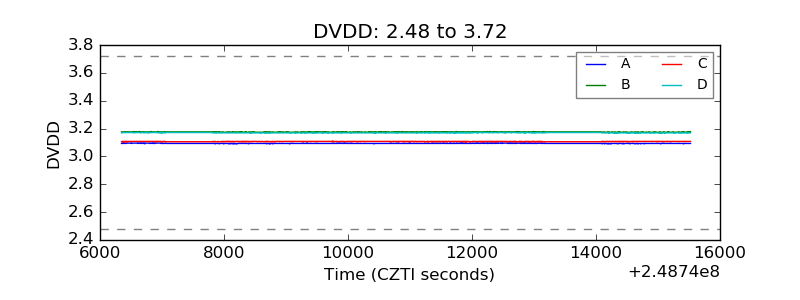 |
| Temperature 1 | 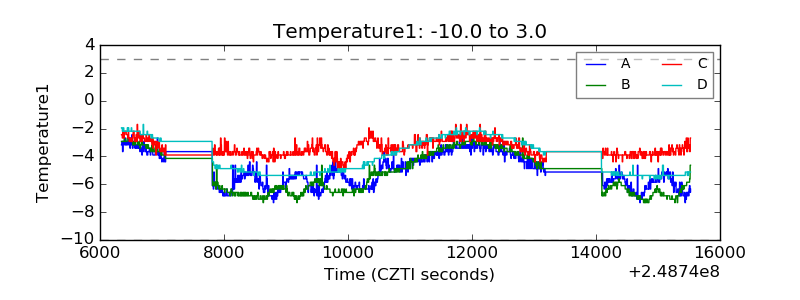 |
| Veto HV Monitor | 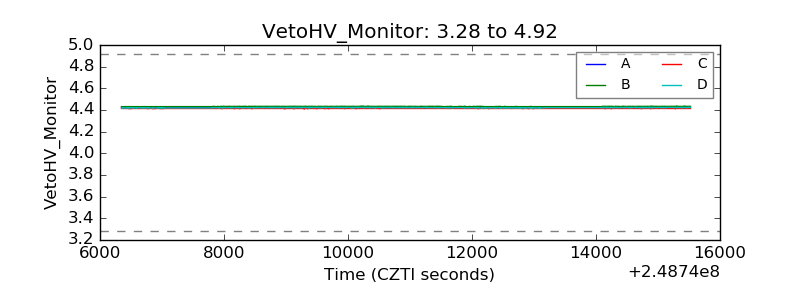 |
| Veto LLD | 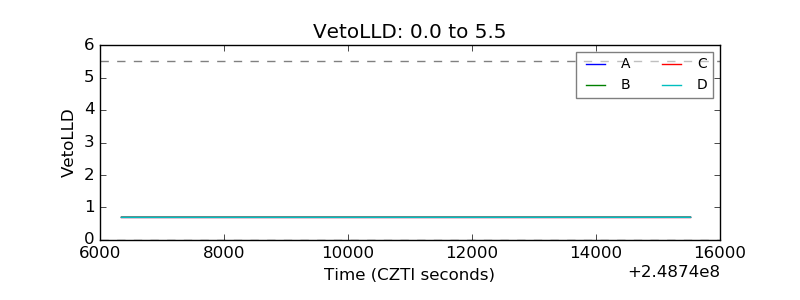 |
| Alpha Counter | 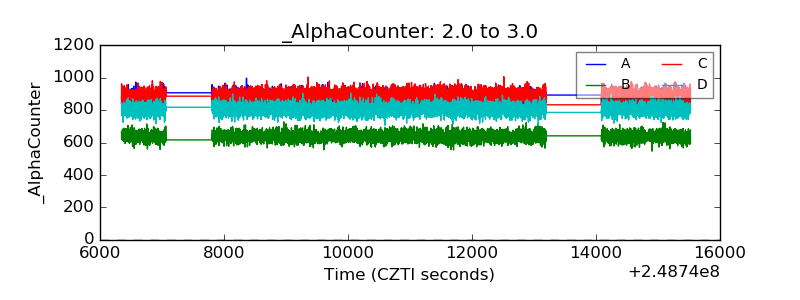 |
| _CPM_Rate | 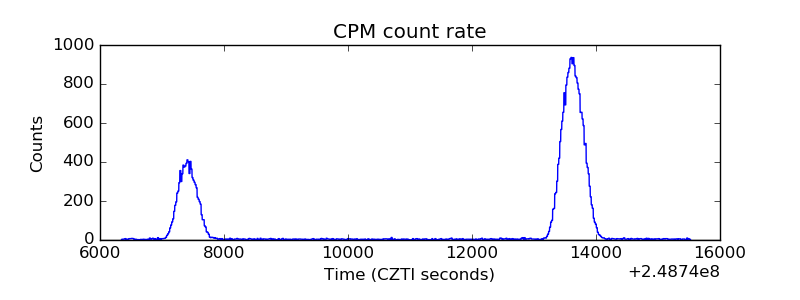 |
| CZT Counter | 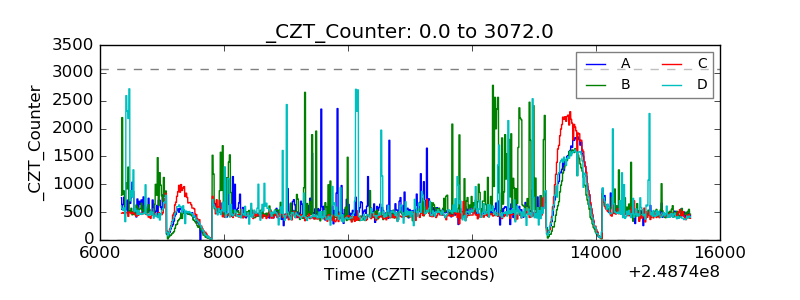 |
| +2.5 Volts monitor |  |
| +5 Volts monitor |  |
| _ROLL_ROT | 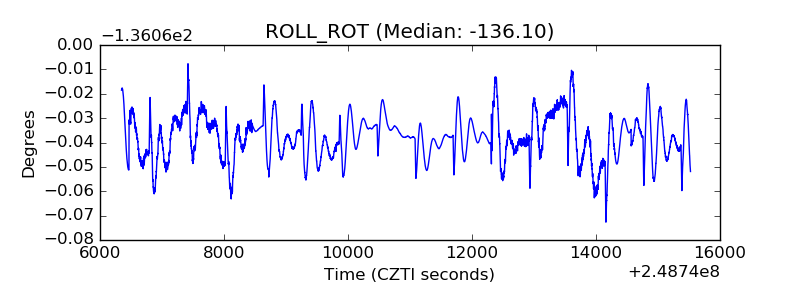 |
| _Roll_DEC | 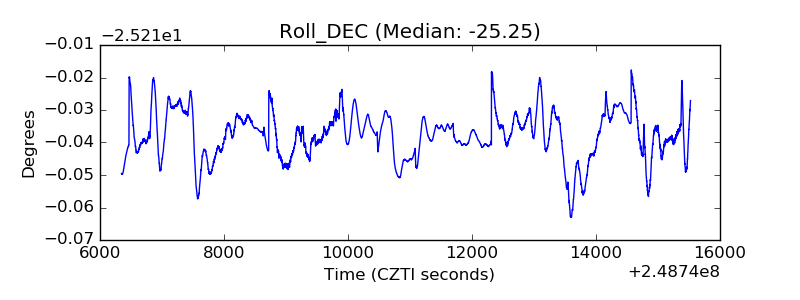 |
| _Roll_RA | 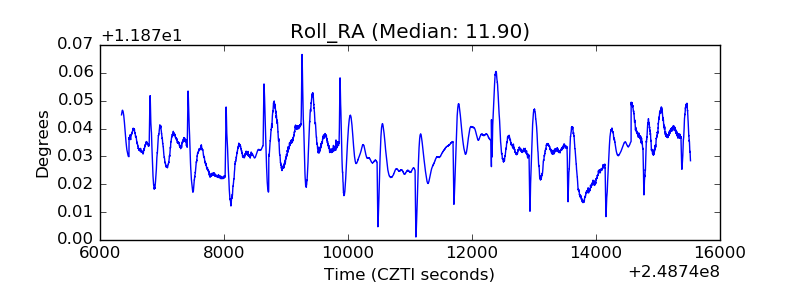 |
| Veto Counter | 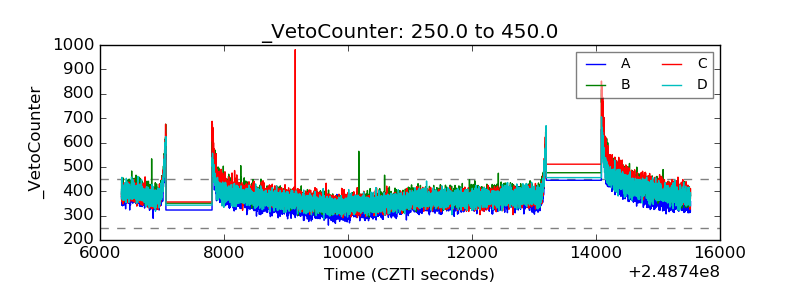 |