| Param | Original file | Final file |
|---|---|---|
| Filename | modeM0/AS1G08_031T01_9000001702_11589cztM0_level2.evt | modeM0/AS1G08_031T01_9000001702_11589cztM0_level2_quad_clean.evt |
| Size (bytes) | 457,640,640 | 72,529,920 |
| Size | 436.4 MB | 69.2 MB |
| Events in quadrant A | 3,359,341 | 437,692 |
| Events in quadrant B | 3,570,351 | 441,021 |
| Events in quadrant C | 3,041,585 | 440,241 |
| Events in quadrant D | 3,442,306 | 419,333 |
| Mode M0 | |||
|---|---|---|---|
| Quadrant | BADHDUFLAG | Total packets | Discarded packets |
| A | 0 | 14104 | 3 |
| B | 0 | 14771 | 2 |
| C | 0 | 13440 | 2 |
| D | 0 | 14580 | 2 |
| Mode M9 | |||
|---|---|---|---|
| Quadrant | BADHDUFLAG | Total packets | Discarded packets |
| A | 0 | 16 | 0 |
| B | 0 | 16 | 0 |
| C | 0 | 16 | 0 |
| D | 0 | 17 | 0 |
| Mode SS | |||
|---|---|---|---|
| Quadrant | BADHDUFLAG | Total packets | Discarded packets |
| A | 0 | 134 | 0 |
| B | 0 | 134 | 0 |
| C | 0 | 134 | 0 |
| D | 0 | 134 | 0 |
| Quadrant | Total seconds | Saturated seconds | Saturation percentage |
|---|---|---|---|
| A | 6561 | 68 | 1.036427% |
| B | 6561 | 158 | 2.408169% |
| C | 6561 | 38 | 0.579180% |
| D | 6561 | 89 | 1.356501% |
Noise dominated data is calculated using 1-second bins in cleaned event files. If a bin has >2000 counts, and if more than 50% of those come from <1% of pixels, then it is considered to be noise-dominated and hence unusable.
| Quadrant | # 1 sec bins | Bins with >0 counts | Bins with >2000 counts | High rate bins dominated by noise | Noise dominated (total time) | Noise dominated (detector-on time) | Marked lightcurve |
|---|---|---|---|---|---|---|---|
| A | 7587 | 6563 | 2 | 2 | 0.03% | 0.03% | 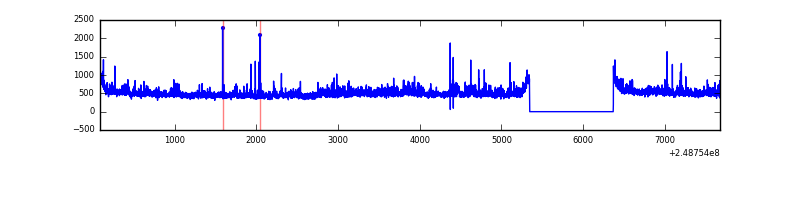 |
| B | 7587 | 6563 | 49 | 49 | 0.65% | 0.75% | 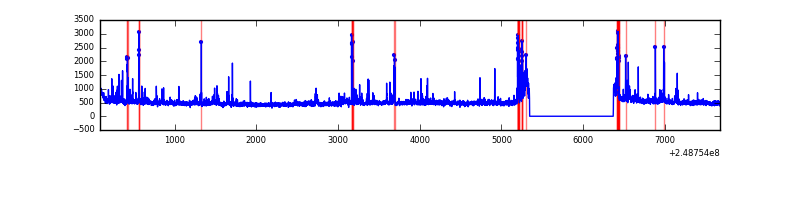 |
| C | 7587 | 6563 | 0 | 0 | 0.00% | 0.00% | 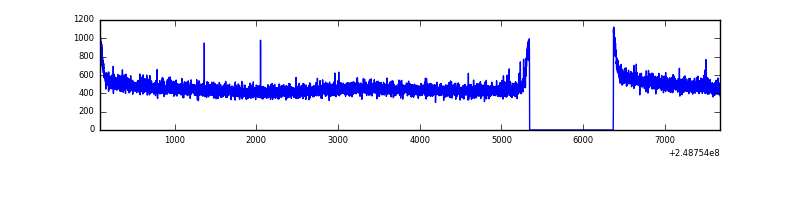 |
| D | 7587 | 6563 | 33 | 33 | 0.43% | 0.50% | 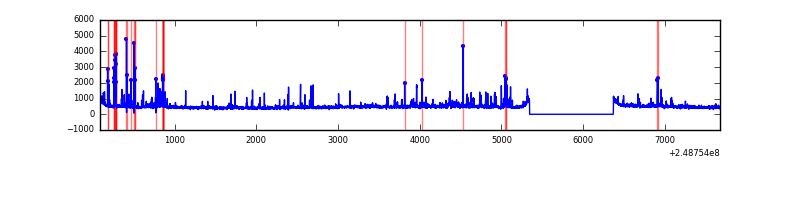 |
Top three noisy pixels from each quadrant. If the there are fewer than three noisy pixels in the level2.evt file, extra rows are filled as -1
| Pixel properties | Quadrant properties | ||||||
|---|---|---|---|---|---|---|---|
| Quadrant | DetID | PixID | Counts | Sigma | Mean | Median | Sigma |
| A | 1 | 162 | 109189 | 675.41 | 788 | 771 | 160.5 |
| A | 1 | 178 | 62601 | 385.18 | 788 | 771 | 160.5 |
| A | 1 | 161 | 53200 | 326.62 | 788 | 771 | 160.5 |
| B | 4 | 239 | 272394 | 1782.25 | 790 | 770 | 152.4 |
| B | 3 | 64 | 61343 | 397.45 | 790 | 770 | 152.4 |
| B | 4 | 81 | 58199 | 376.82 | 790 | 770 | 152.4 |
| C | 9 | 54 | 6252 | 30.22 | 778 | 782 | 181.0 |
| C | 13 | 61 | 5789 | 27.66 | 778 | 782 | 181.0 |
| C | 14 | 234 | 2435 | 9.13 | 778 | 782 | 181.0 |
| D | 1 | 52 | 381518 | 2082.67 | 764 | 744 | 182.8 |
| D | 2 | 33 | 56136 | 302.97 | 764 | 744 | 182.8 |
| D | 5 | 222 | 47471 | 255.58 | 764 | 744 | 182.8 |
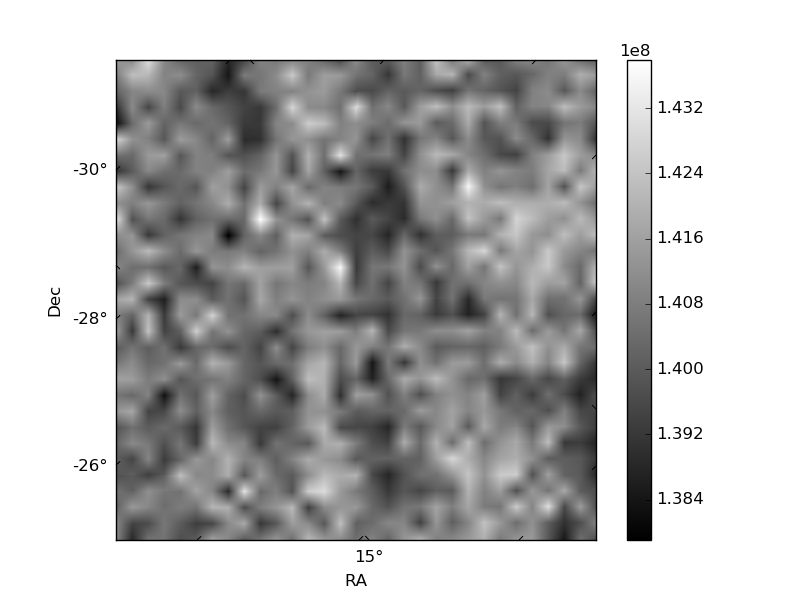
Histogram calculated using DETX and DETY for each event in the final _common_clean file
| Quadrant A | 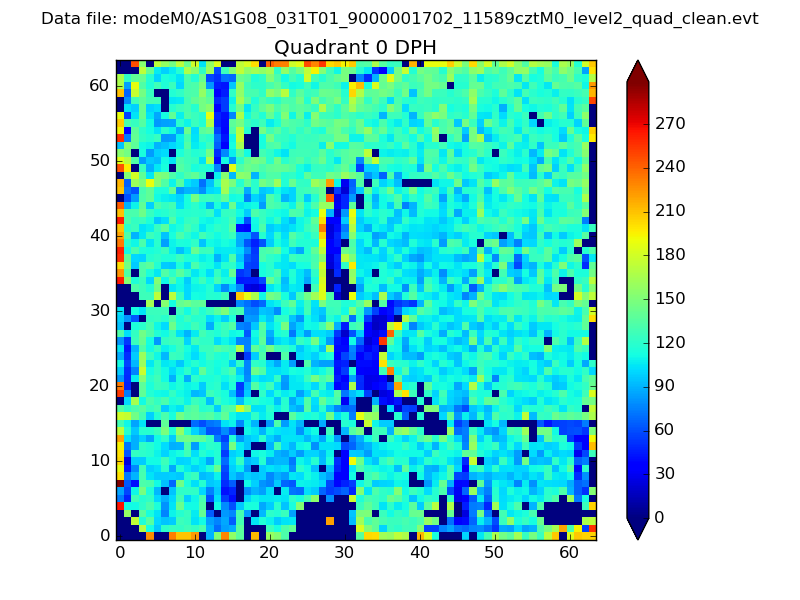 |
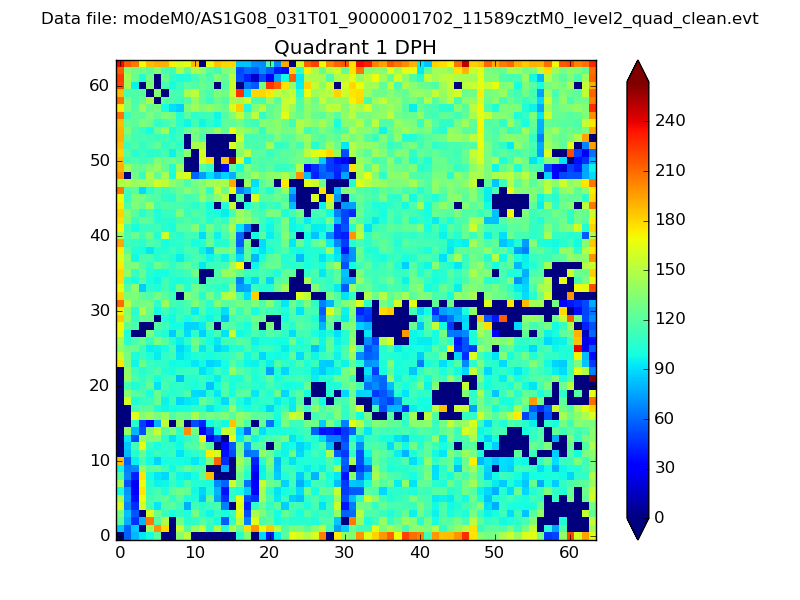 |
Quadrant B |
|---|---|---|---|
| Quadrant D | 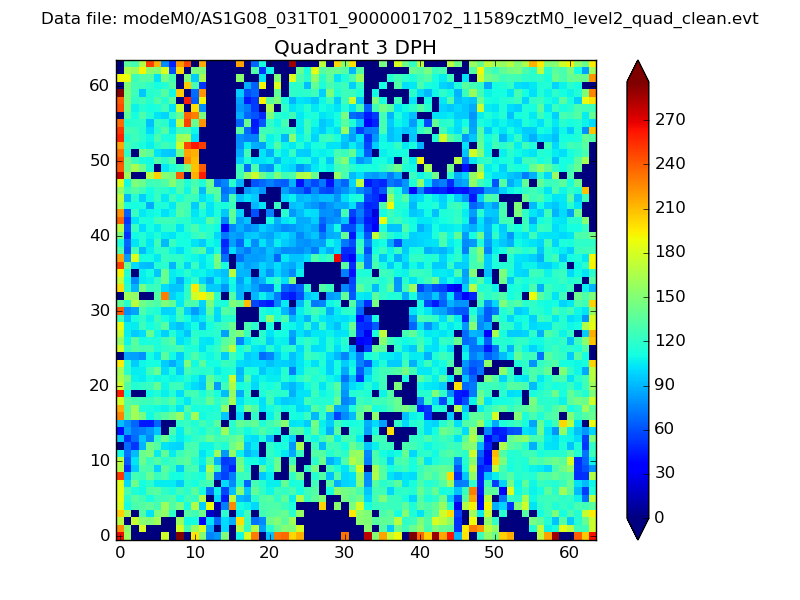 |
 |
Quadrant C |
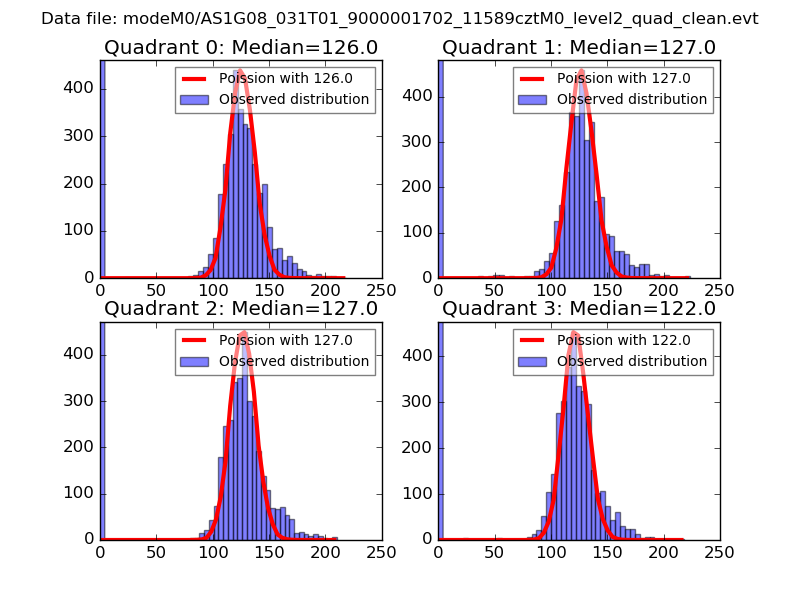
| Plot type | Count rate plots | Images |
|---|---|---|
| Comparison with Poisson distribution Blue bars denote a histogram of data divided into 1 sec bins. Red curve is a Poisson curve with rate = median count rate of data. |
 |
 |
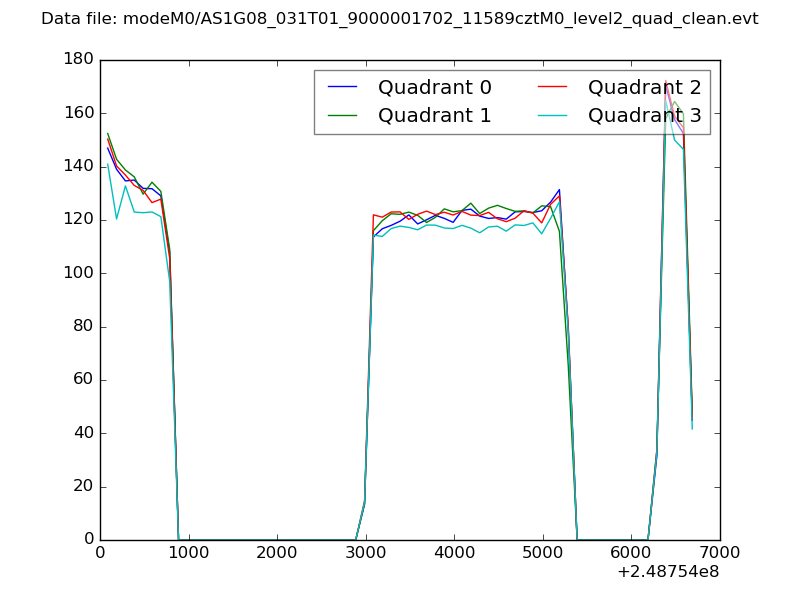
| Quadrant-wise count rates Data is divided into 100 sec bins |
 |
|
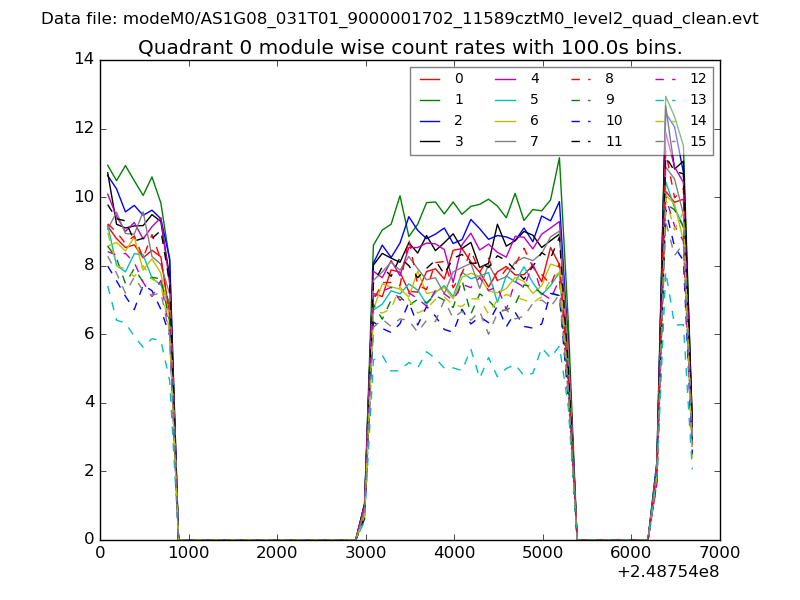
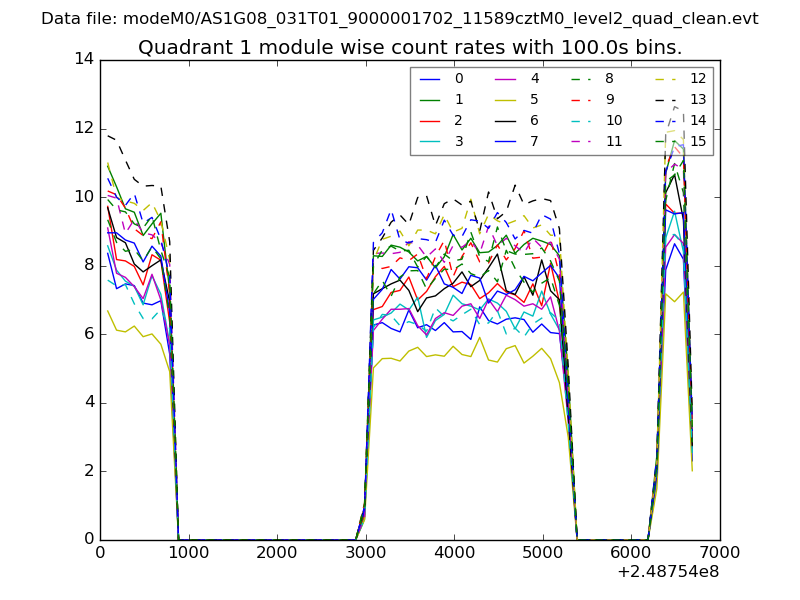
| Module-wise count rates for Quadrant A Data is divided into 100 sec bins |
 |
 |
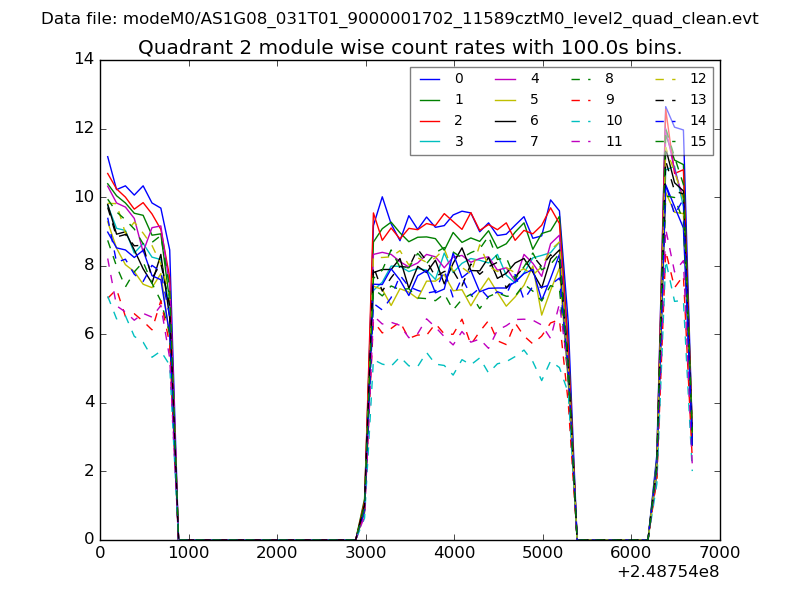
| Module-wise count rates for Quadrant B Data is divided into 100 sec bins |
 |
 |
| Module-wise count rates for Quadrant C Data is divided into 100 sec bins |
 |
 |
| Module-wise count rates for Quadrant D Data is divided into 100 sec bins |
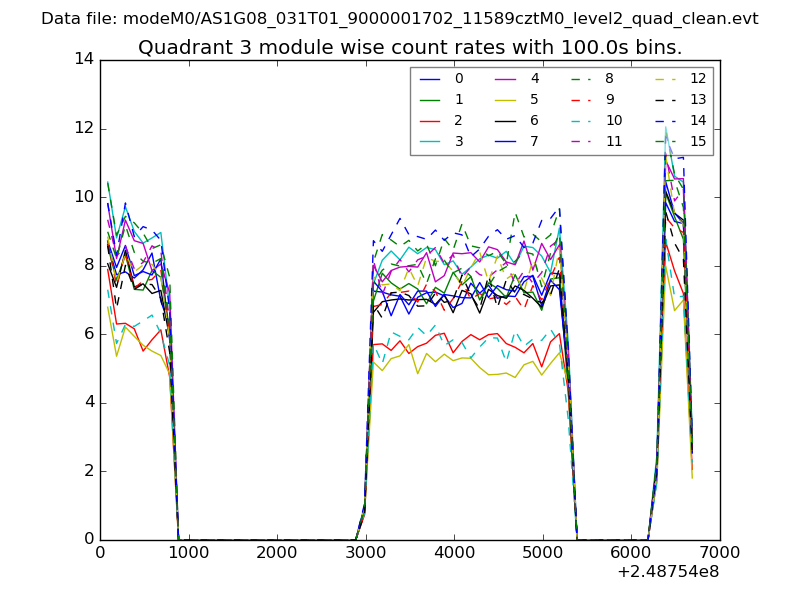 |
 |
| Parameter | Plot |
|---|---|
| CZT HV Monitor | 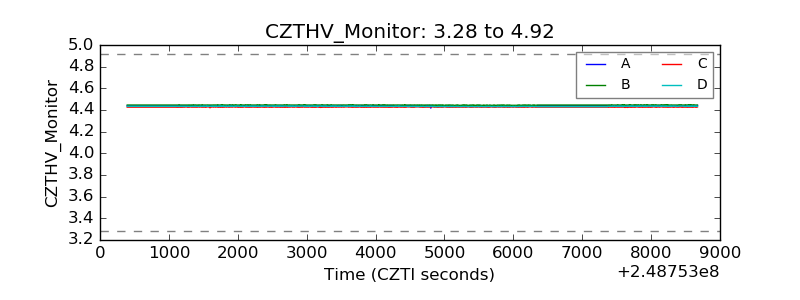 |
| D_VDD | 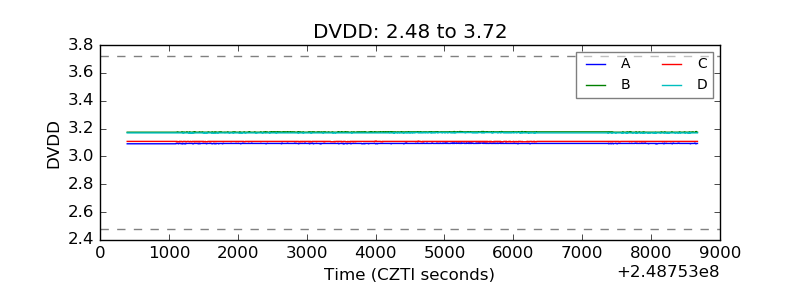 |
| Temperature 1 | 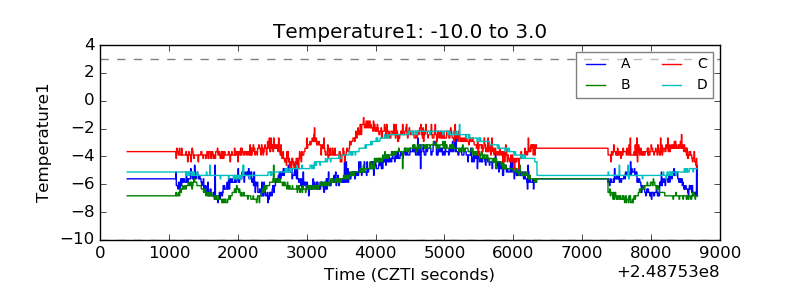 |
| Veto HV Monitor | 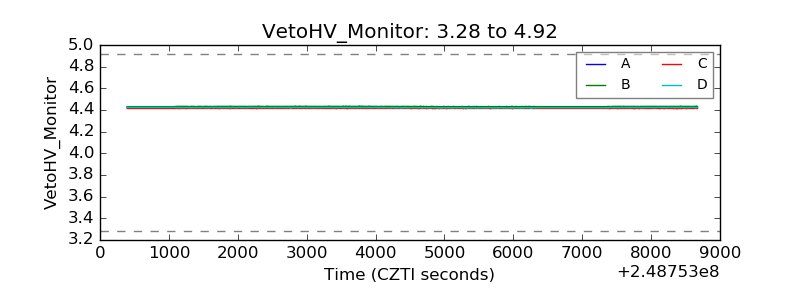 |
| Veto LLD |  |
| Alpha Counter | 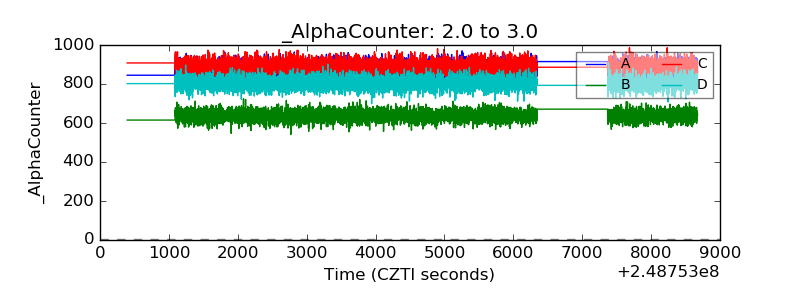 |
| _CPM_Rate | 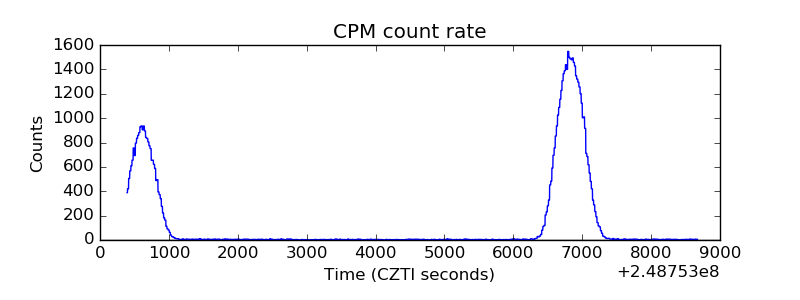 |
| CZT Counter |  |
| +2.5 Volts monitor |  |
| +5 Volts monitor |  |
| _ROLL_ROT | 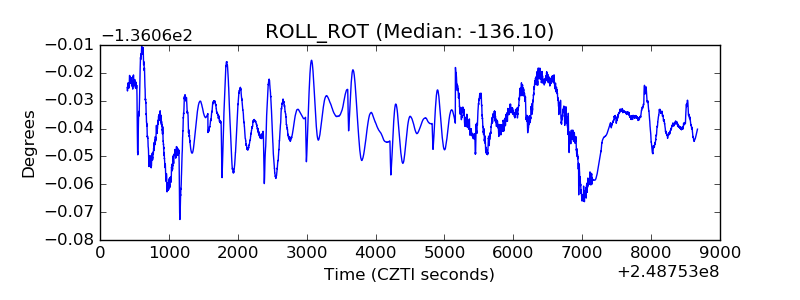 |
| _Roll_DEC | 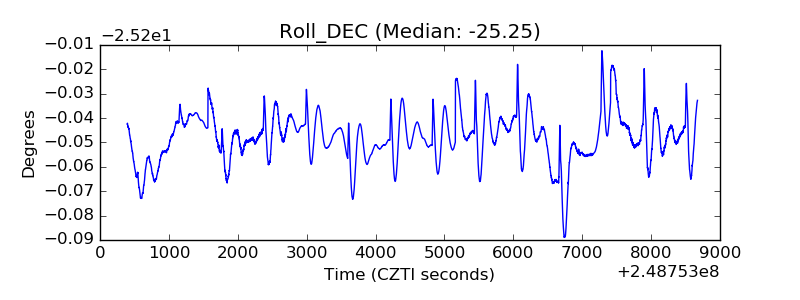 |
| _Roll_RA | 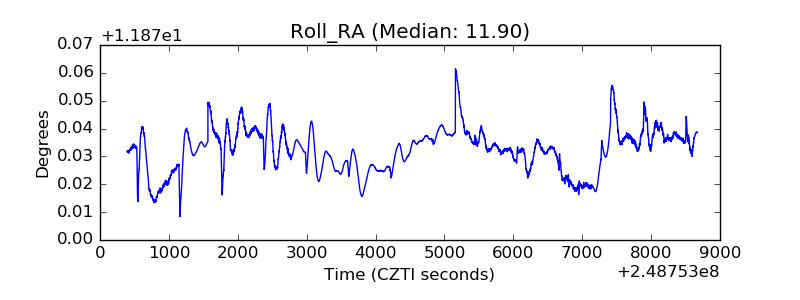 |
| Veto Counter | 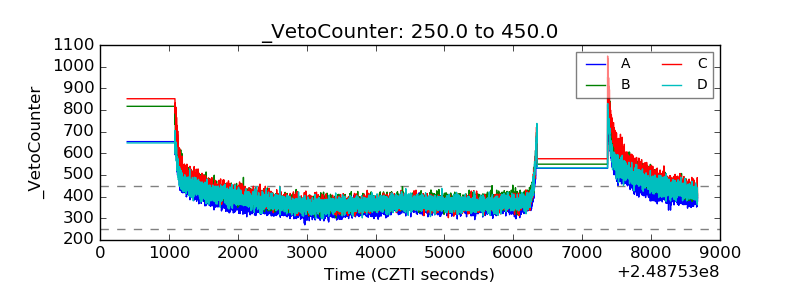 |