| Param | Original file | Final file |
|---|---|---|
| Filename | modeM0/AS1G08_031T01_9000001702_11592cztM0_level2.evt | modeM0/AS1G08_031T01_9000001702_11592cztM0_level2_quad_clean.evt |
| Size (bytes) | 294,045,120 | 38,600,640 |
| Size | 280.4 MB | 36.8 MB |
| Events in quadrant A | 2,178,097 | 224,069 |
| Events in quadrant B | 2,481,976 | 225,830 |
| Events in quadrant C | 1,882,892 | 228,630 |
| Events in quadrant D | 2,096,992 | 215,421 |
| Mode M0 | |||
|---|---|---|---|
| Quadrant | BADHDUFLAG | Total packets | Discarded packets |
| A | 0 | 8857 | 1 |
| B | 0 | 9769 | 1 |
| C | 0 | 8079 | 1 |
| D | 0 | 8508 | 1 |
| Mode M9 | |||
|---|---|---|---|
| Quadrant | BADHDUFLAG | Total packets | Discarded packets |
| A | 0 | 8 | 0 |
| B | 0 | 8 | 0 |
| C | 0 | 8 | 0 |
| D | 0 | 9 | 0 |
| Mode SS | |||
|---|---|---|---|
| Quadrant | BADHDUFLAG | Total packets | Discarded packets |
| A | 0 | 78 | 0 |
| B | 0 | 78 | 0 |
| C | 0 | 78 | 0 |
| D | 0 | 78 | 0 |
| Quadrant | Total seconds | Saturated seconds | Saturation percentage |
|---|---|---|---|
| A | 3884 | 32 | 0.823893% |
| B | 3884 | 137 | 3.527291% |
| C | 3884 | 8 | 0.205973% |
| D | 3884 | 42 | 1.081359% |
Noise dominated data is calculated using 1-second bins in cleaned event files. If a bin has >2000 counts, and if more than 50% of those come from <1% of pixels, then it is considered to be noise-dominated and hence unusable.
| Quadrant | # 1 sec bins | Bins with >0 counts | Bins with >2000 counts | High rate bins dominated by noise | Noise dominated (total time) | Noise dominated (detector-on time) | Marked lightcurve |
|---|---|---|---|---|---|---|---|
| A | 3885 | 3885 | 6 | 6 | 0.15% | 0.15% | 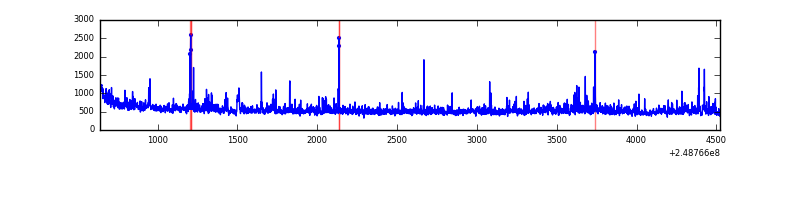 |
| B | 3885 | 3885 | 71 | 71 | 1.83% | 1.83% | 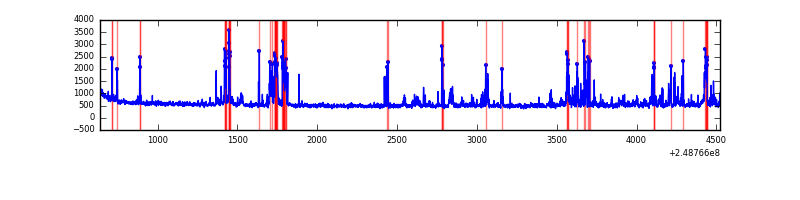 |
| C | 3885 | 3885 | 0 | 0 | 0.00% | 0.00% | 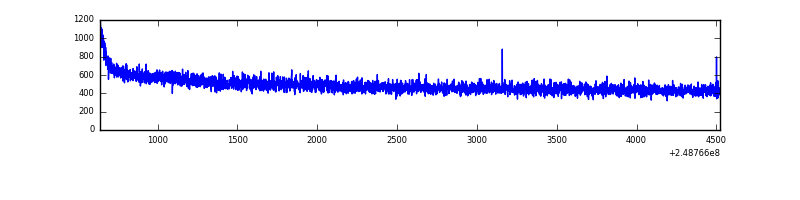 |
| D | 3885 | 3885 | 37 | 37 | 0.95% | 0.95% | 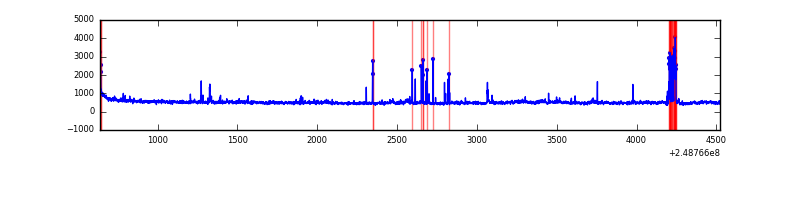 |
Top three noisy pixels from each quadrant. If the there are fewer than three noisy pixels in the level2.evt file, extra rows are filled as -1
| Pixel properties | Quadrant properties | ||||||
|---|---|---|---|---|---|---|---|
| Quadrant | DetID | PixID | Counts | Sigma | Mean | Median | Sigma |
| A | 8 | 5 | 90339 | 895.82 | 491 | 481 | 100.3 |
| A | 1 | 162 | 73981 | 732.74 | 491 | 481 | 100.3 |
| A | 1 | 178 | 42820 | 422.09 | 491 | 481 | 100.3 |
| B | 4 | 239 | 430421 | 4580.57 | 490 | 479 | 93.9 |
| B | 3 | 64 | 36222 | 380.8 | 490 | 479 | 93.9 |
| B | 11 | 51 | 31216 | 327.47 | 490 | 479 | 93.9 |
| C | 13 | 61 | 3489 | 27.0 | 482 | 485 | 111.2 |
| C | 12 | 4 | 1480 | 8.94 | 482 | 485 | 111.2 |
| C | 3 | 202 | 1208 | 6.5 | 482 | 485 | 111.2 |
| D | 1 | 52 | 147108 | 1201.04 | 471 | 462 | 122.1 |
| D | 8 | 195 | 91627 | 746.65 | 471 | 462 | 122.1 |
| D | 13 | 104 | 16580 | 132.01 | 471 | 462 | 122.1 |
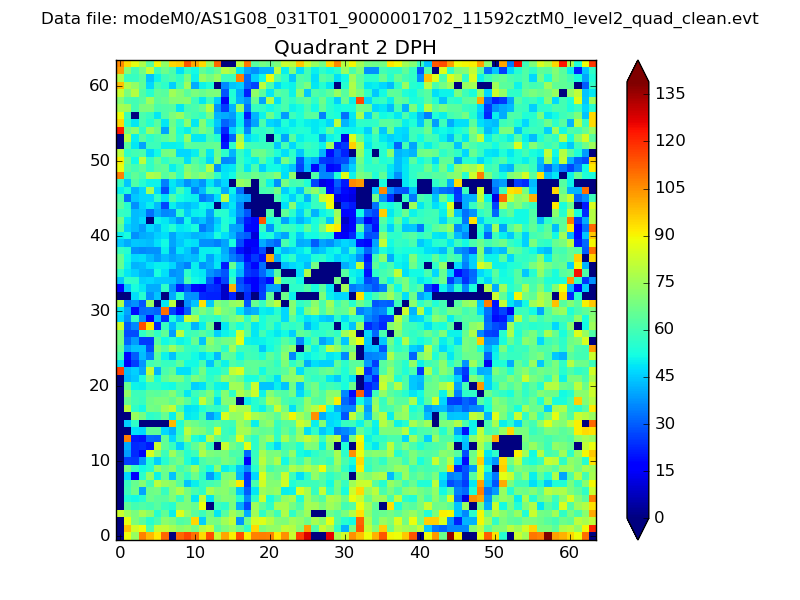
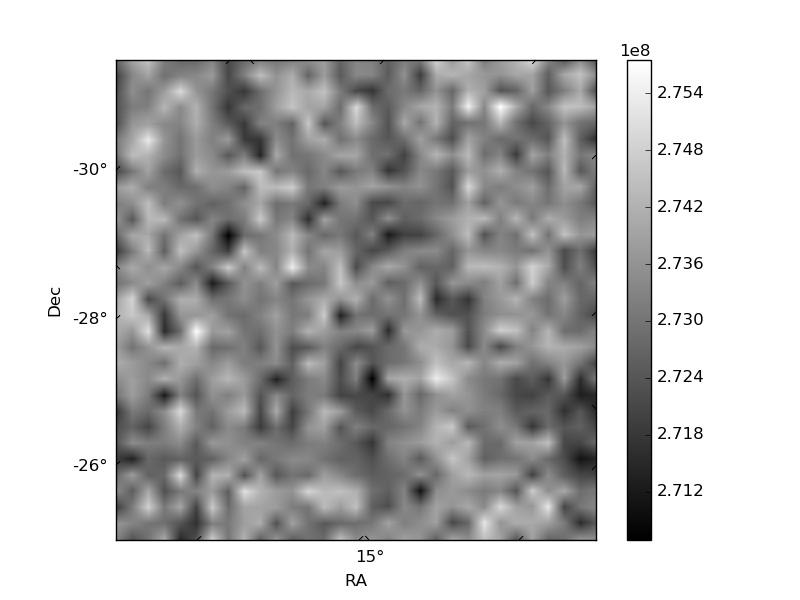
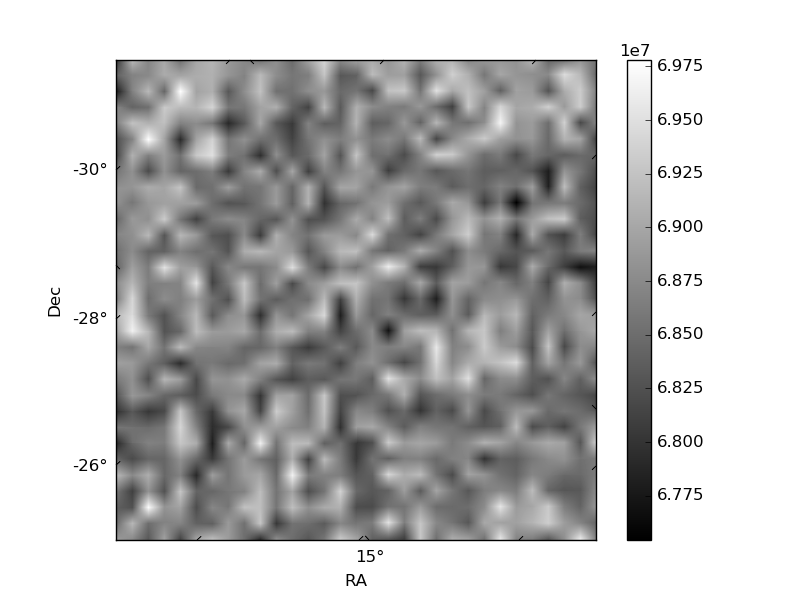
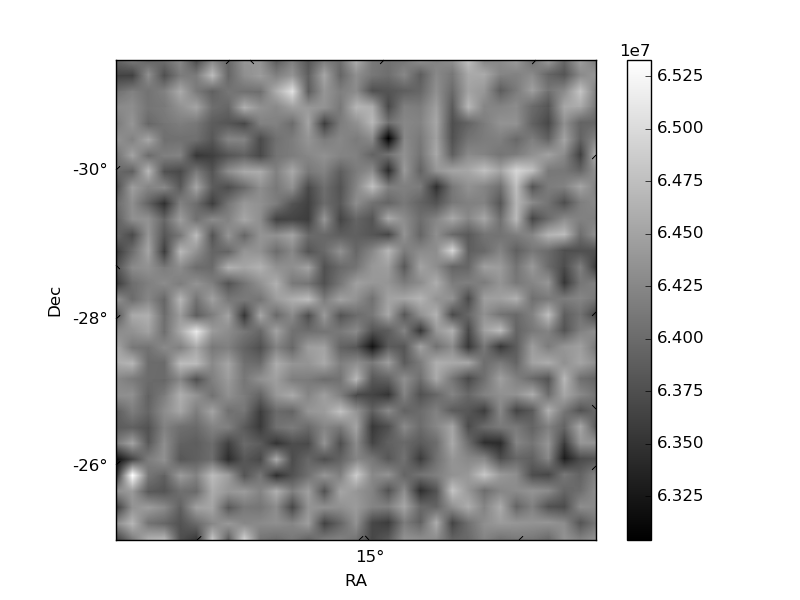
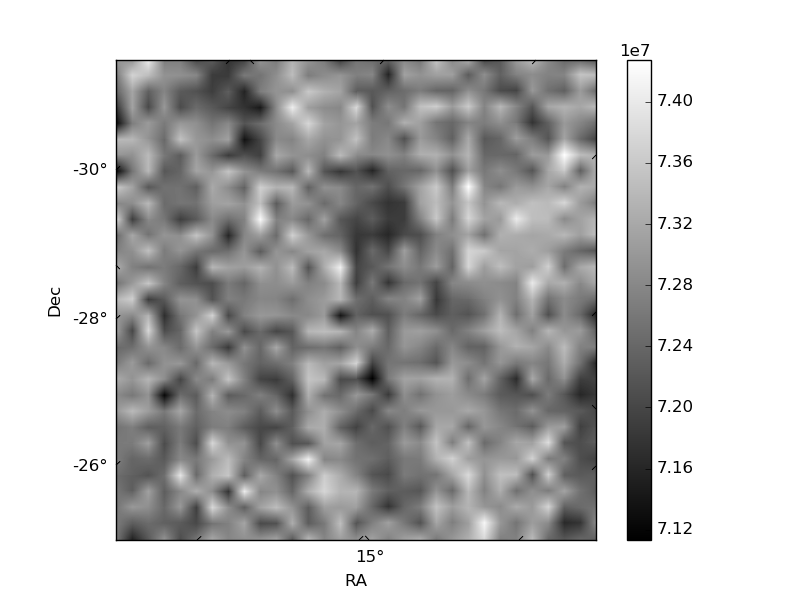
Histogram calculated using DETX and DETY for each event in the final _common_clean file
| Quadrant A | 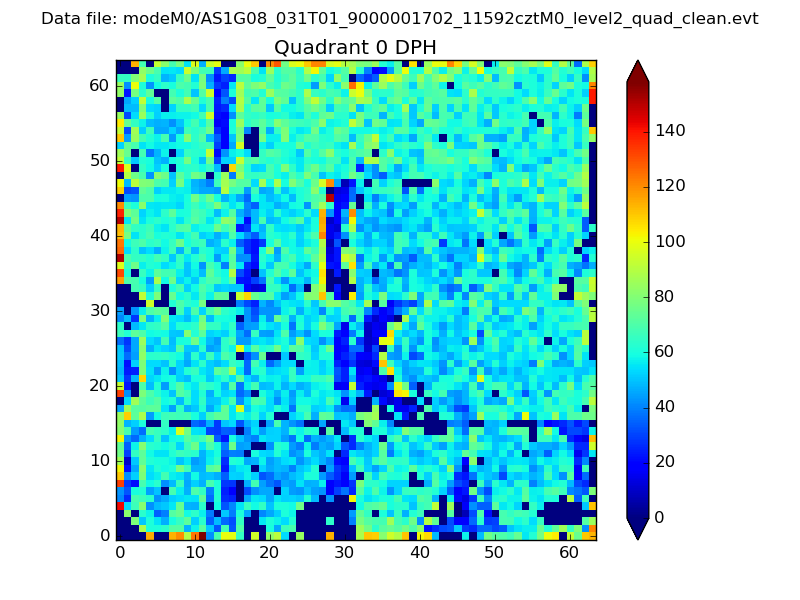 |
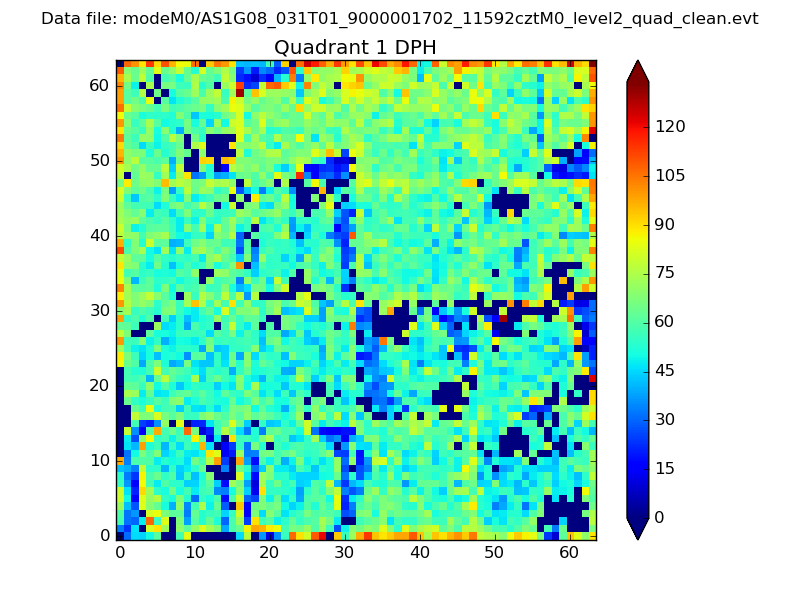 |
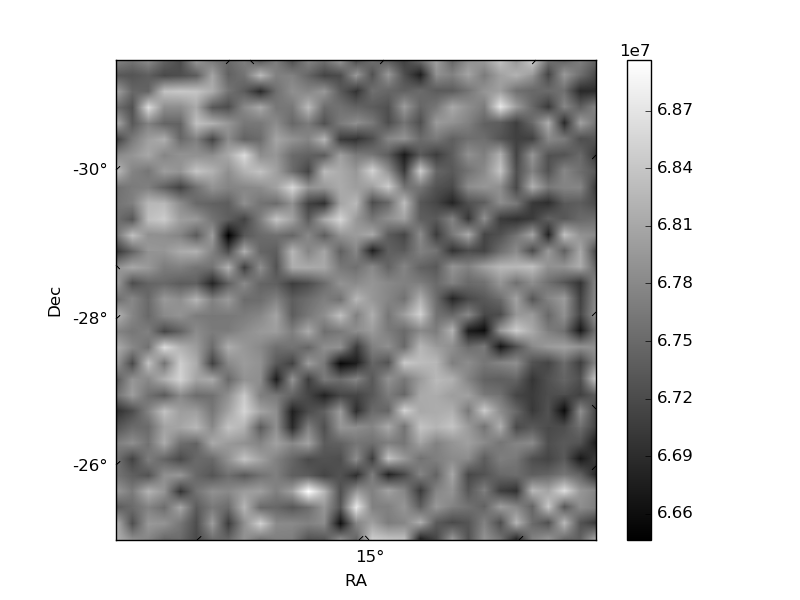
Quadrant B |
|---|---|---|---|
| Quadrant D | 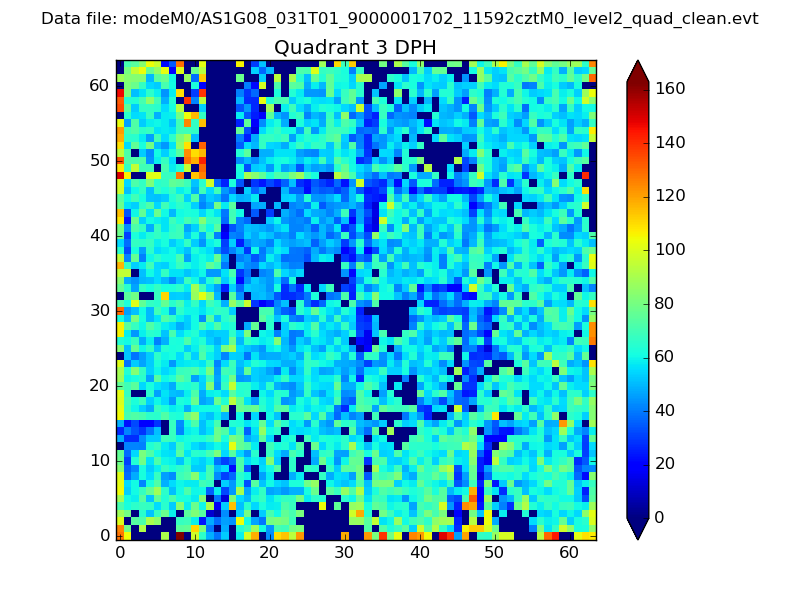 |
 |
Quadrant C |
| Plot type | Count rate plots | Images |
|---|---|---|
| Comparison with Poisson distribution Blue bars denote a histogram of data divided into 1 sec bins. Red curve is a Poisson curve with rate = median count rate of data. |
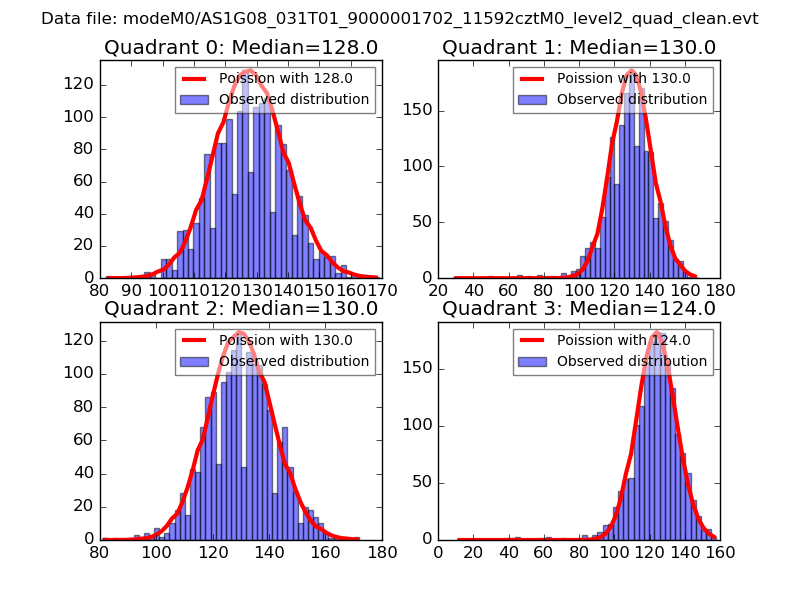 |
 |
| Quadrant-wise count rates Data is divided into 100 sec bins |
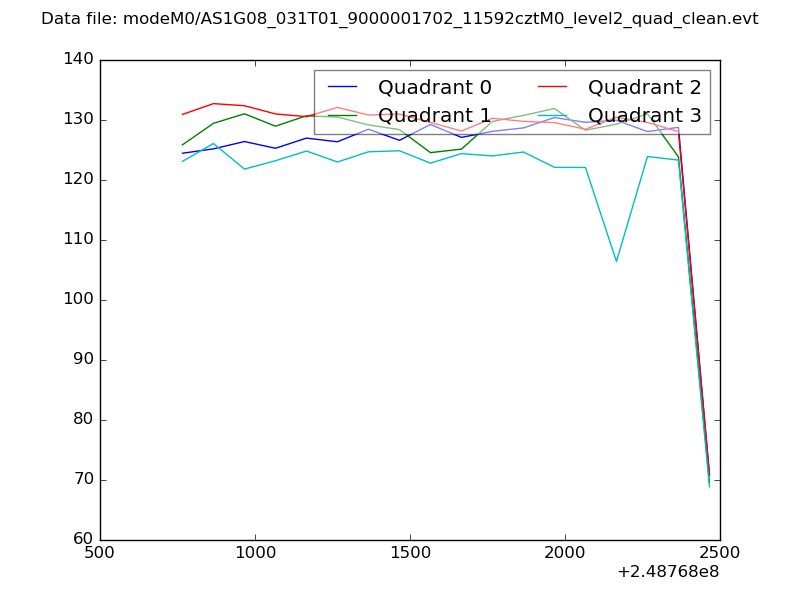 |
|
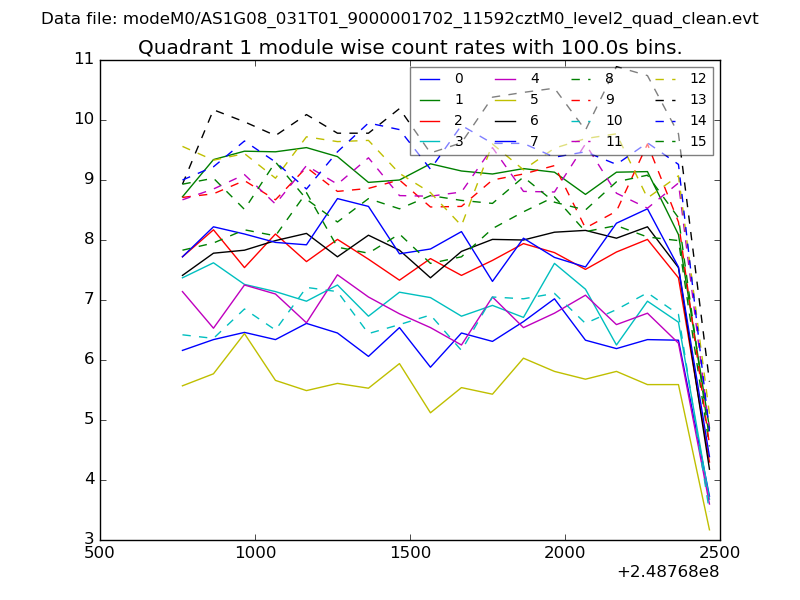
| Module-wise count rates for Quadrant A Data is divided into 100 sec bins |
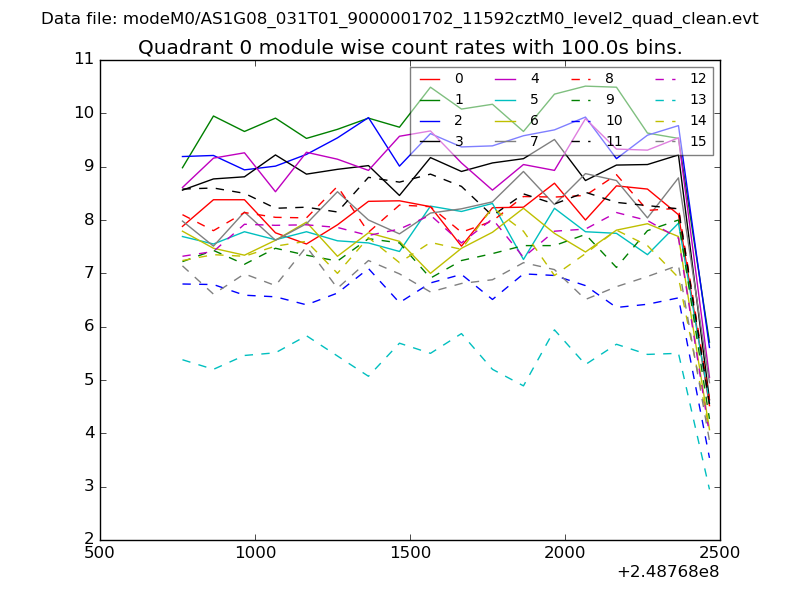 |
 |
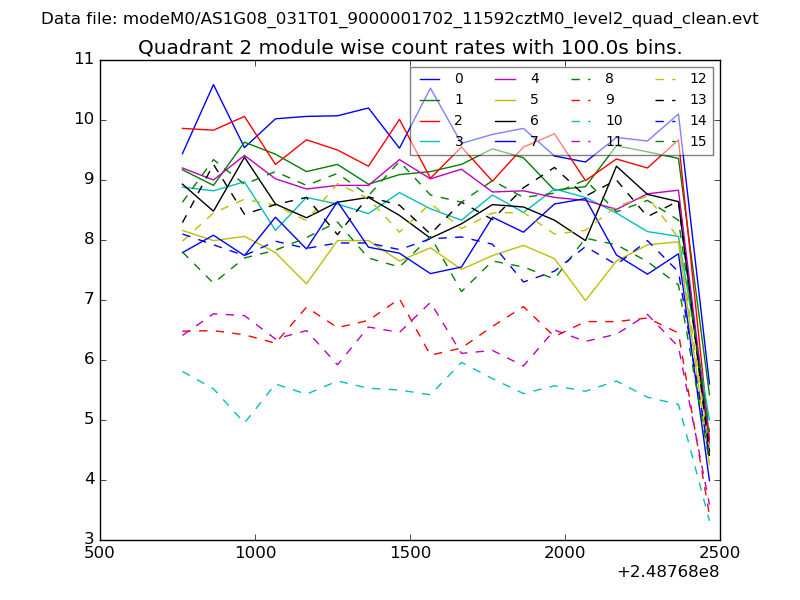
| Module-wise count rates for Quadrant B Data is divided into 100 sec bins |
 |
 |
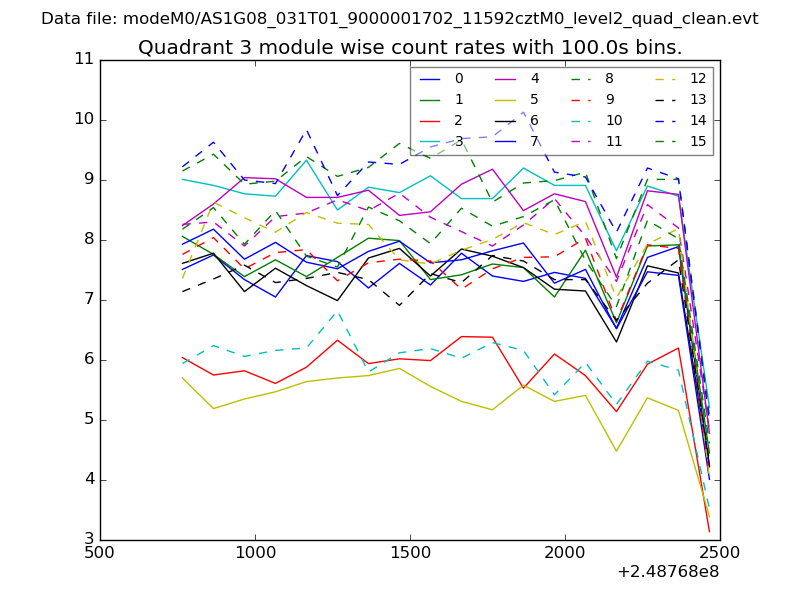
| Module-wise count rates for Quadrant C Data is divided into 100 sec bins |
 |
 |
| Module-wise count rates for Quadrant D Data is divided into 100 sec bins |
 |
 |
| Parameter | Plot |
|---|---|
| CZT HV Monitor | 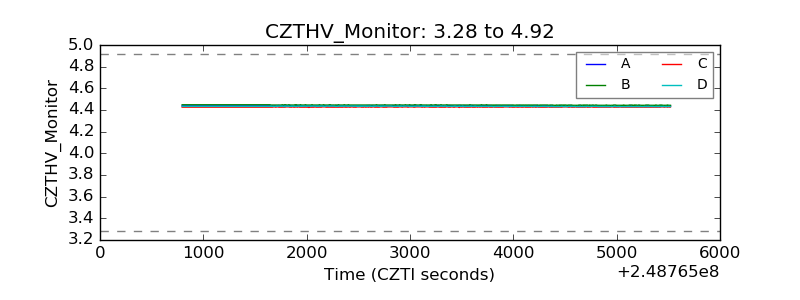 |
| D_VDD | 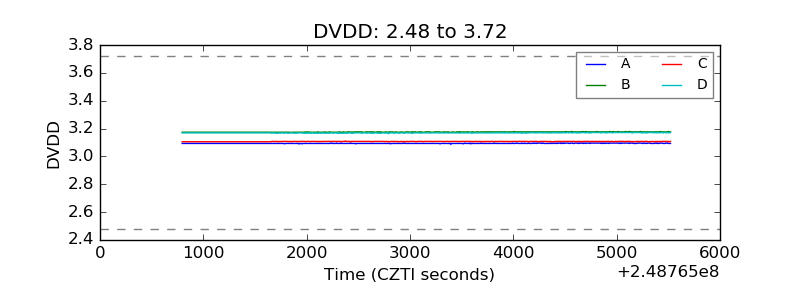 |
| Temperature 1 | 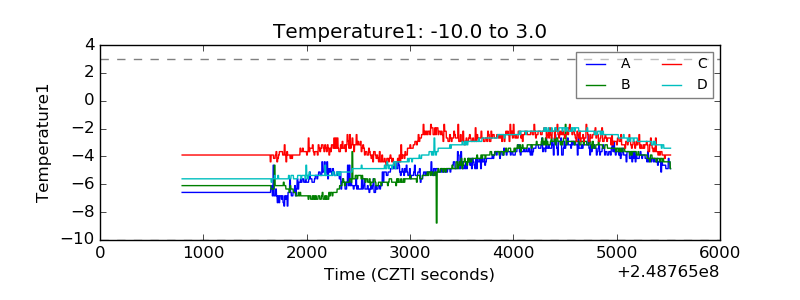 |
| Veto HV Monitor | 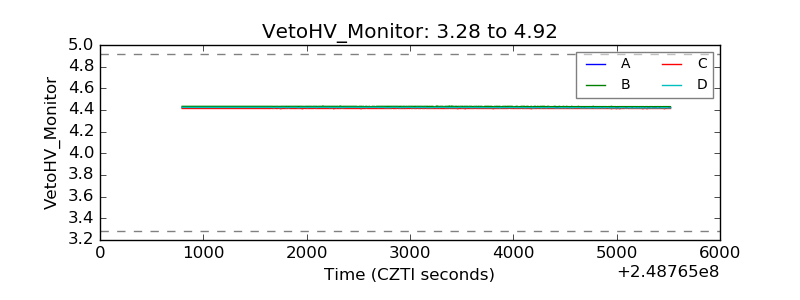 |
| Veto LLD | 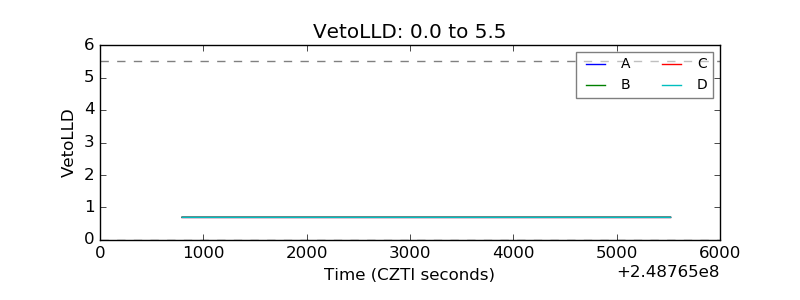 |
| Alpha Counter | 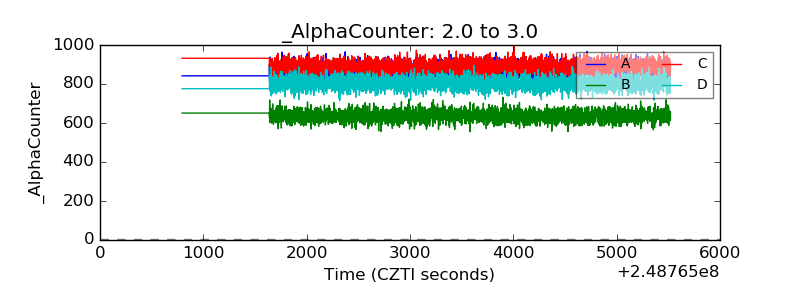 |
| _CPM_Rate | 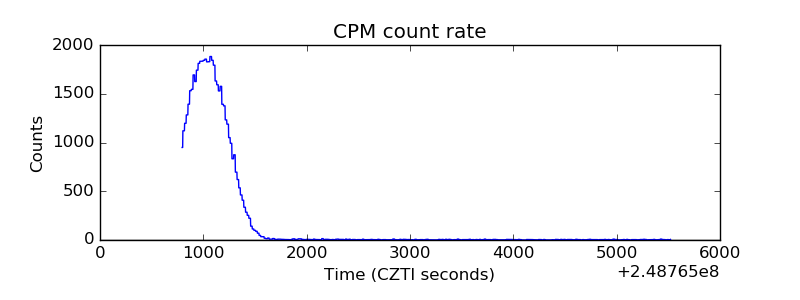 |
| CZT Counter | 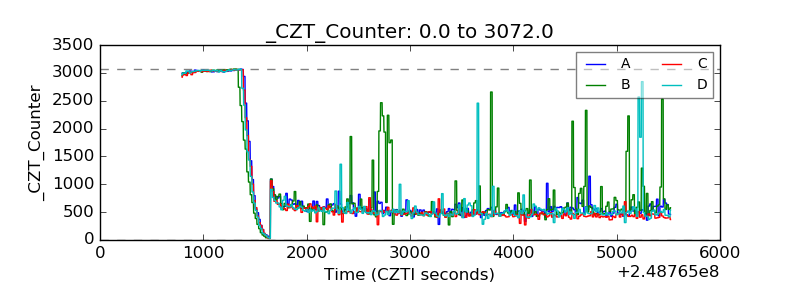 |
| +2.5 Volts monitor | 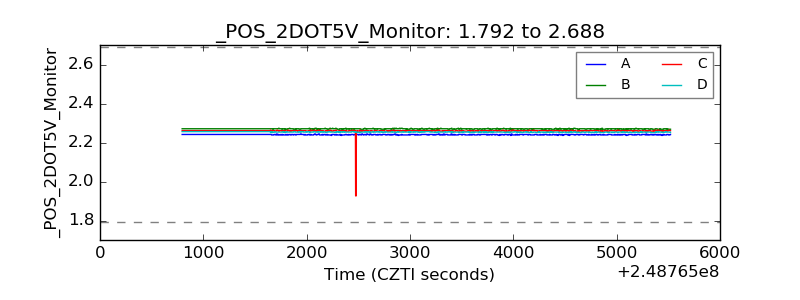 |
| +5 Volts monitor | 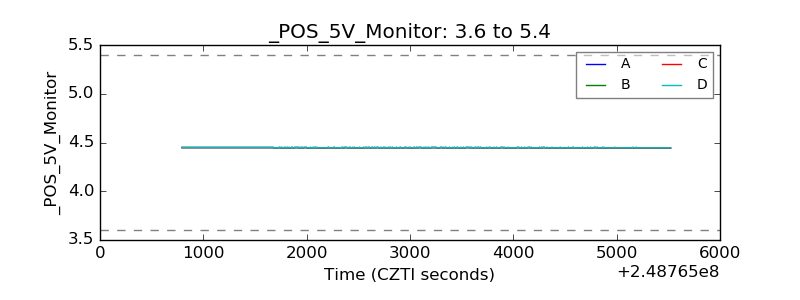 |
| _ROLL_ROT | 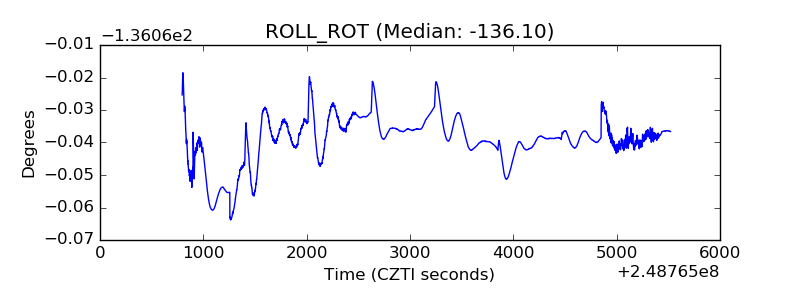 |
| _Roll_DEC | 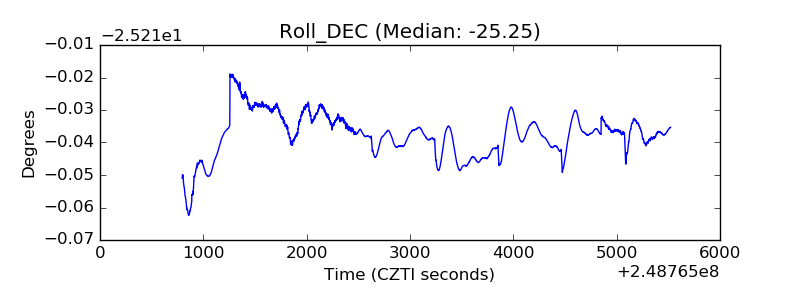 |
| _Roll_RA | 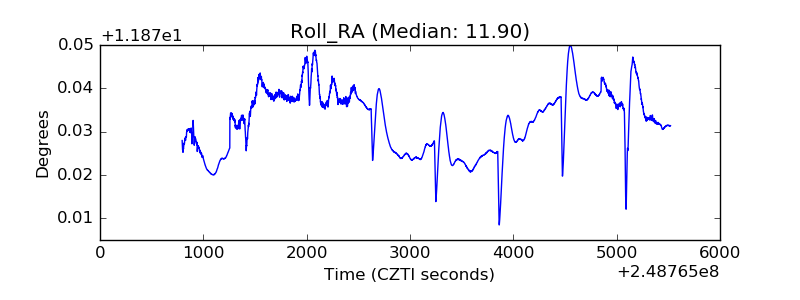 |
| Veto Counter | 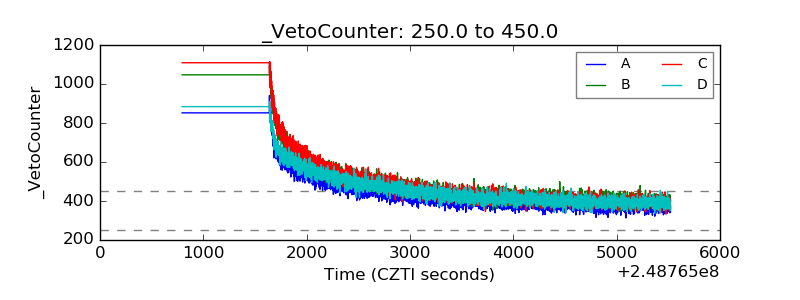 |