| Param | Original file | Final file |
|---|---|---|
| Filename | modeM0/AS1A04_130T04_9000001704_11592cztM0_level2.evt | modeM0/AS1A04_130T04_9000001704_11592cztM0_level2_quad_clean.evt |
| Size (bytes) | 107,729,280 | 30,870,720 |
| Size | 102.7 MB | 29.4 MB |
| Events in quadrant A | 839,217 | 209,088 |
| Events in quadrant B | 853,122 | 212,185 |
| Events in quadrant C | 671,919 | 210,460 |
| Events in quadrant D | 801,029 | 199,195 |
| Mode M0 | |||
|---|---|---|---|
| Quadrant | BADHDUFLAG | Total packets | Discarded packets |
| A | 0 | 3368 | 2 |
| B | 0 | 3356 | 1 |
| C | 0 | 2851 | 1 |
| D | 0 | 3259 | 1 |
| Mode SS | |||
|---|---|---|---|
| Quadrant | BADHDUFLAG | Total packets | Discarded packets |
| A | 0 | 28 | 0 |
| B | 0 | 28 | 0 |
| C | 0 | 28 | 0 |
| D | 0 | 28 | 0 |
| Mode M9 | |||
|---|---|---|---|
| Quadrant | BADHDUFLAG | Total packets | Discarded packets |
| A | 0 | 7 | 0 |
| B | 0 | 7 | 0 |
| C | 0 | 7 | 0 |
| D | 0 | 7 | 0 |
| Quadrant | Total seconds | Saturated seconds | Saturation percentage |
|---|---|---|---|
| A | 1387 | 25 | 1.802451% |
| B | 1387 | 34 | 2.451334% |
| C | 1387 | 2 | 0.144196% |
| D | 1387 | 7 | 0.504686% |
Noise dominated data is calculated using 1-second bins in cleaned event files. If a bin has >2000 counts, and if more than 50% of those come from <1% of pixels, then it is considered to be noise-dominated and hence unusable.
| Quadrant | # 1 sec bins | Bins with >0 counts | Bins with >2000 counts | High rate bins dominated by noise | Noise dominated (total time) | Noise dominated (detector-on time) | Marked lightcurve |
|---|---|---|---|---|---|---|---|
| A | 1388 | 1388 | 3 | 3 | 0.22% | 0.22% | 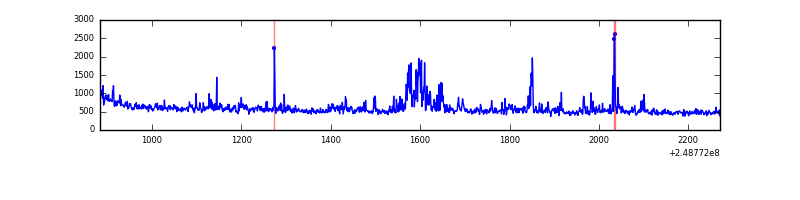 |
| B | 1388 | 1388 | 18 | 18 | 1.30% | 1.30% | 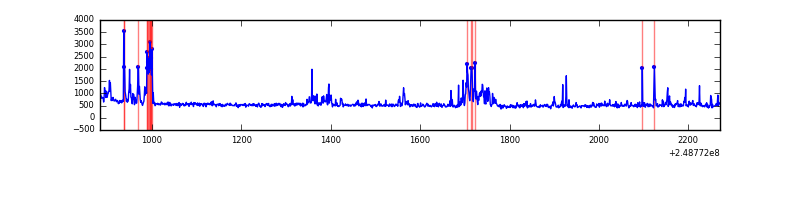 |
| C | 1388 | 1388 | 0 | 0 | 0.00% | 0.00% | 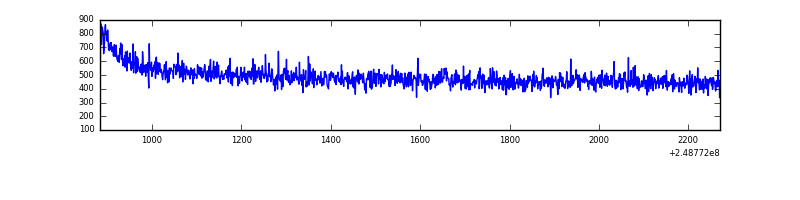 |
| D | 1388 | 1388 | 3 | 3 | 0.22% | 0.22% | 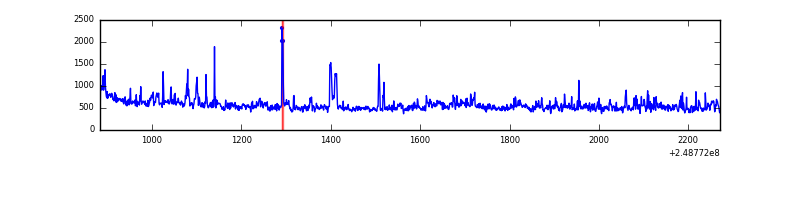 |
Top three noisy pixels from each quadrant. If the there are fewer than three noisy pixels in the level2.evt file, extra rows are filled as -1
| Pixel properties | Quadrant properties | ||||||
|---|---|---|---|---|---|---|---|
| Quadrant | DetID | PixID | Counts | Sigma | Mean | Median | Sigma |
| A | 8 | 5 | 88901 | 2345.53 | 180 | 177 | 37.8 |
| A | 1 | 162 | 20707 | 542.74 | 180 | 177 | 37.8 |
| A | 1 | 178 | 12136 | 316.15 | 180 | 177 | 37.8 |
| B | 4 | 239 | 120829 | 3443.64 | 178 | 174 | 35.0 |
| B | 3 | 64 | 16608 | 469.05 | 178 | 174 | 35.0 |
| B | 11 | 51 | 16223 | 458.06 | 178 | 174 | 35.0 |
| C | 12 | 4 | 1406 | 30.73 | 171 | 172 | 40.2 |
| C | 13 | 61 | 1235 | 26.47 | 171 | 172 | 40.2 |
| C | 14 | 67 | 532 | 8.96 | 171 | 172 | 40.2 |
| D | 2 | 120 | 49771 | 1202.23 | 171 | 168 | 41.3 |
| D | 8 | 195 | 42976 | 1037.54 | 171 | 168 | 41.3 |
| D | 2 | 136 | 25807 | 621.42 | 171 | 168 | 41.3 |
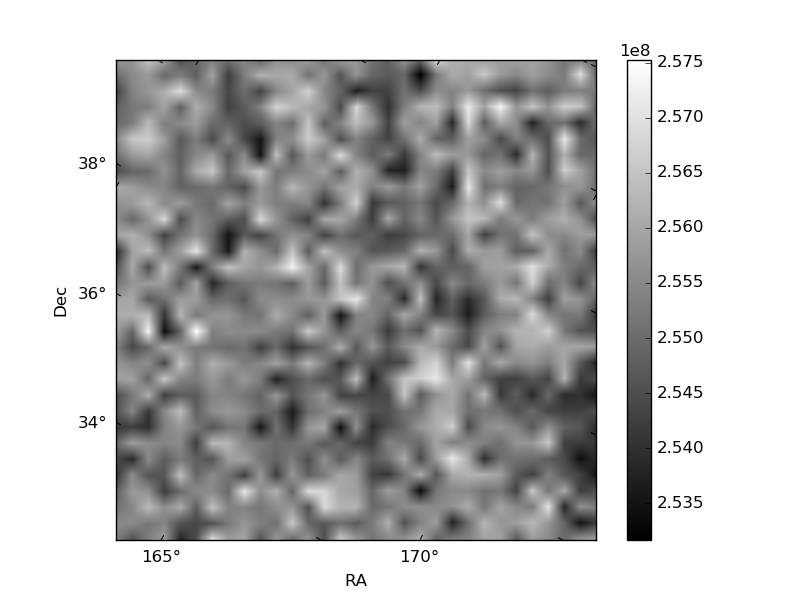
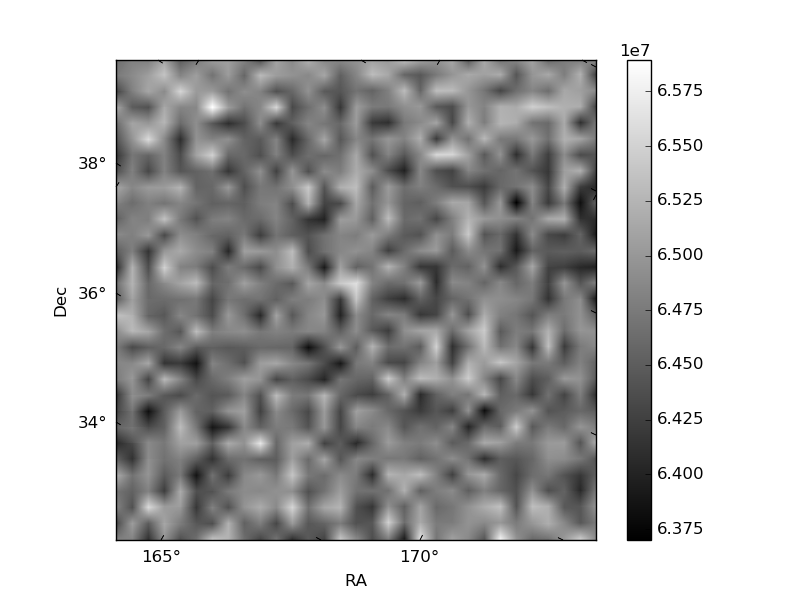
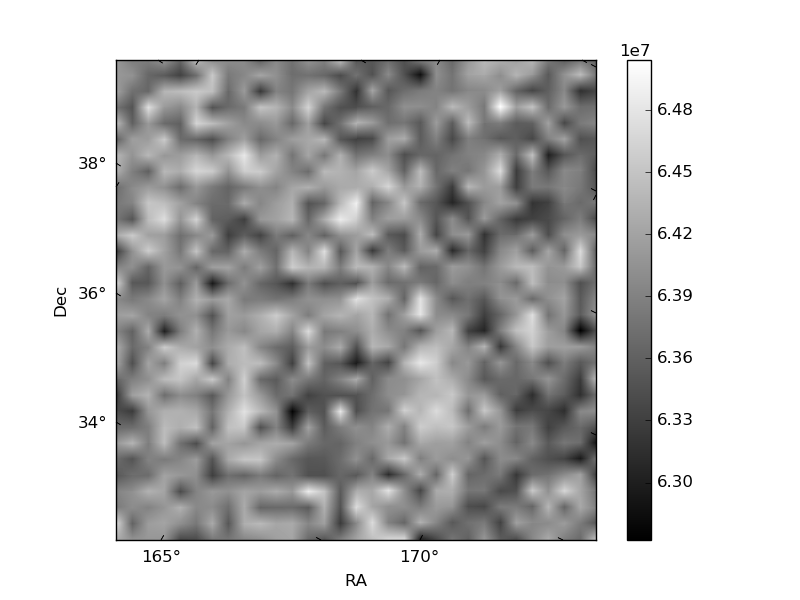
Histogram calculated using DETX and DETY for each event in the final _common_clean file
| Quadrant A | 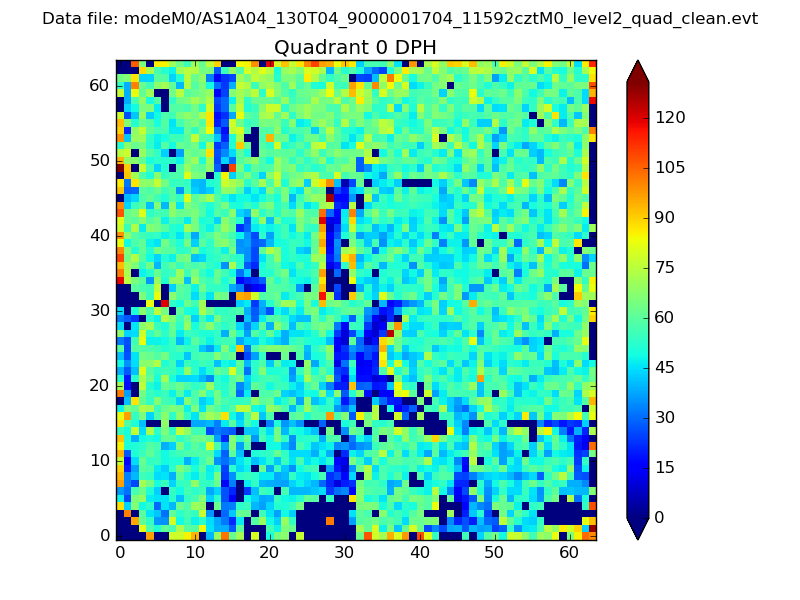 |
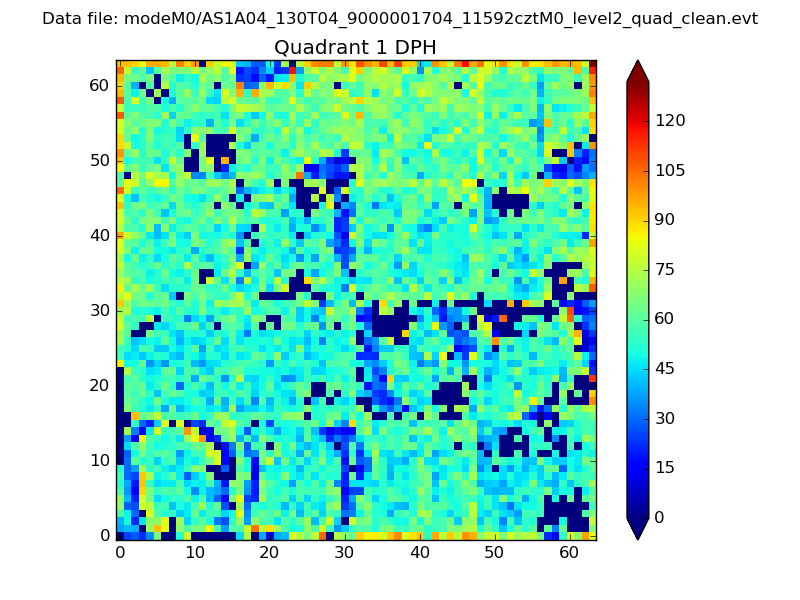 |
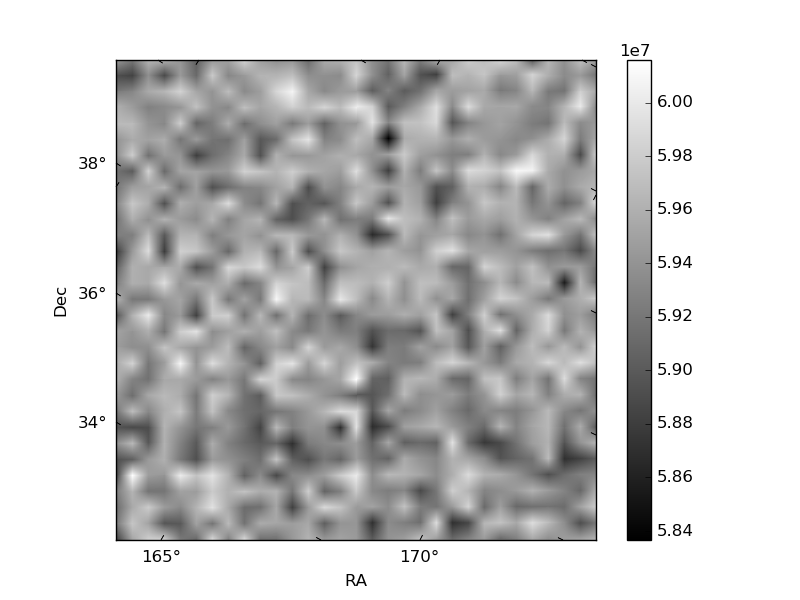
Quadrant B |
|---|---|---|---|
| Quadrant D | 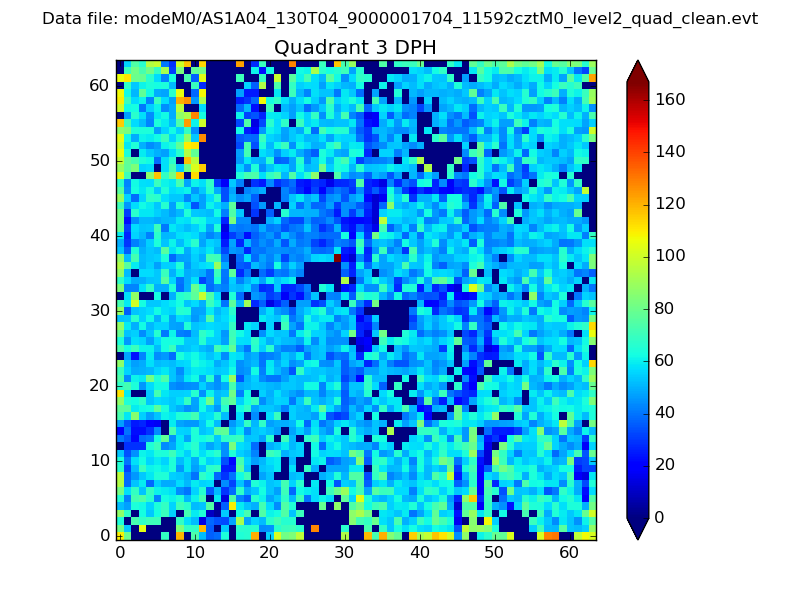 |
 |
Quadrant C |
| Plot type | Count rate plots | Images |
|---|---|---|
| Comparison with Poisson distribution Blue bars denote a histogram of data divided into 1 sec bins. Red curve is a Poisson curve with rate = median count rate of data. |
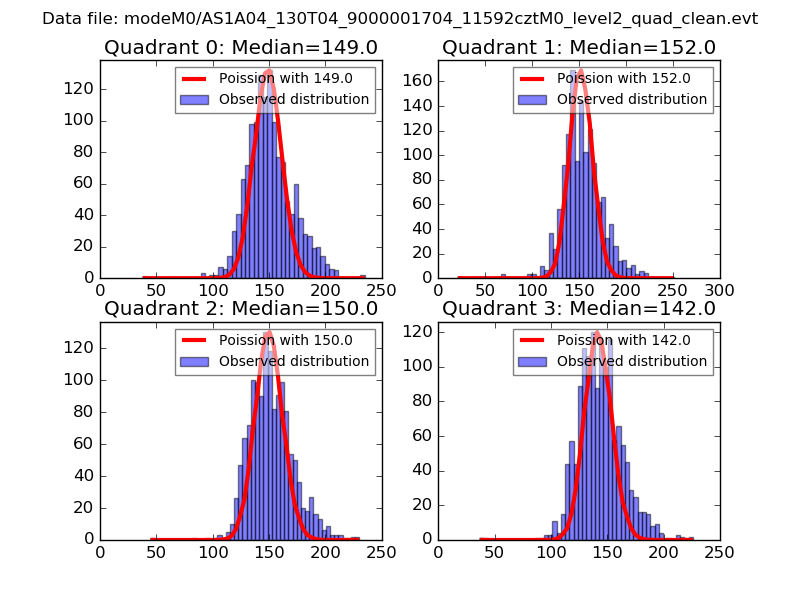 |
 |
| Quadrant-wise count rates Data is divided into 100 sec bins |
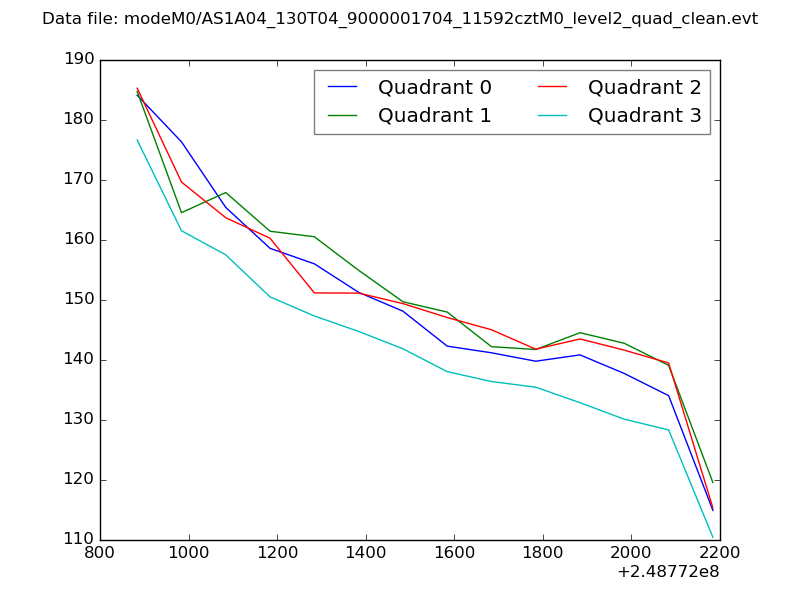 |
|
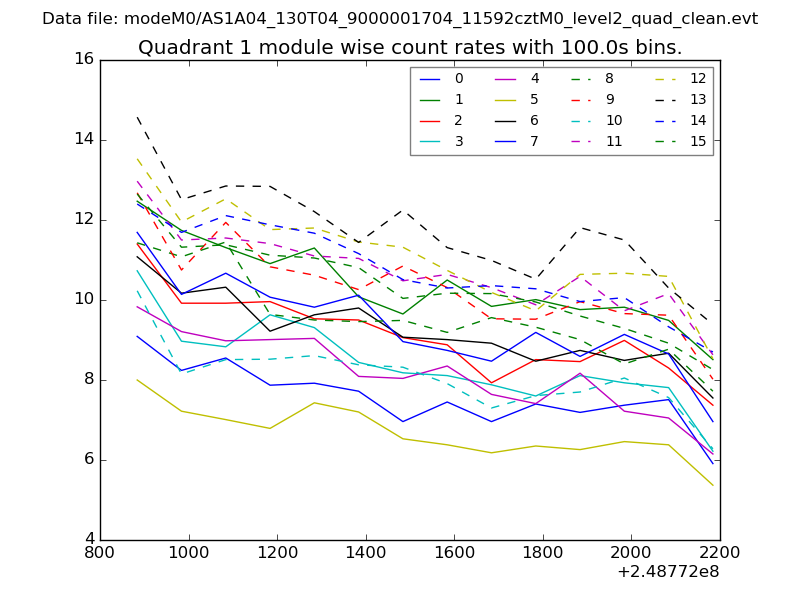
| Module-wise count rates for Quadrant A Data is divided into 100 sec bins |
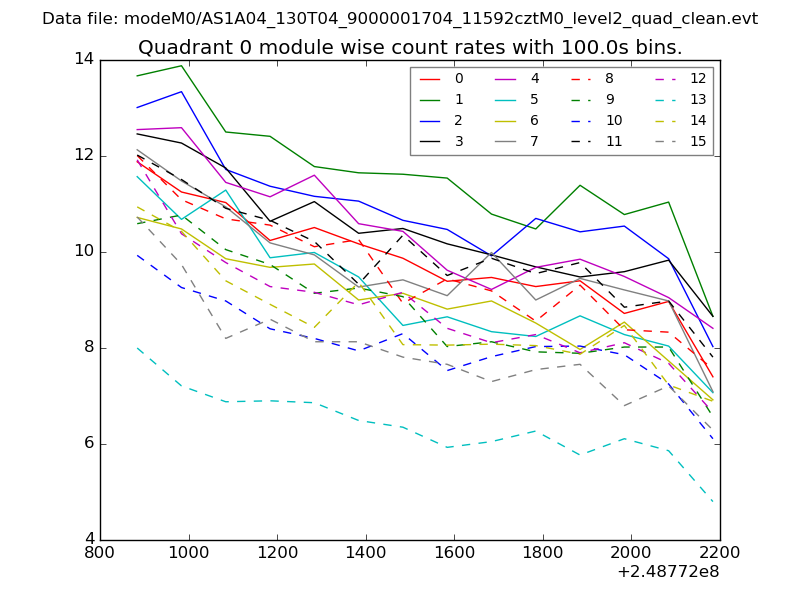 |
 |
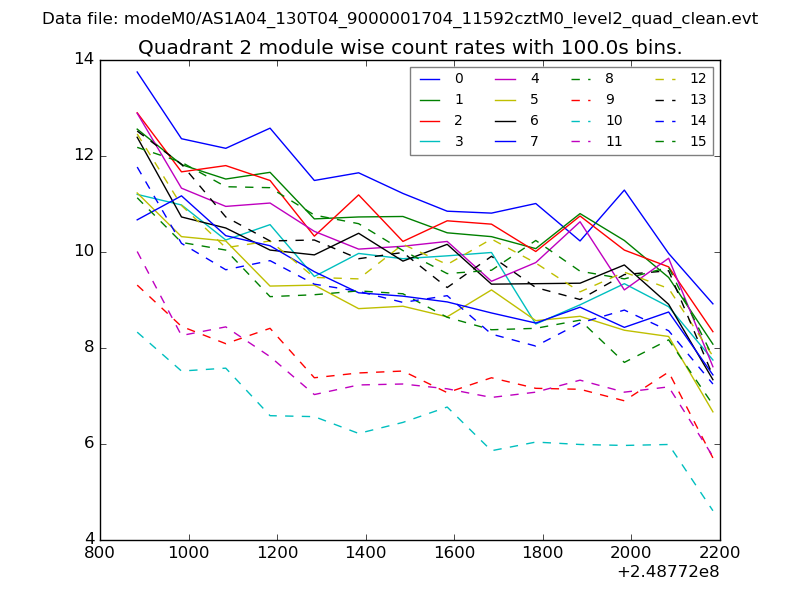
| Module-wise count rates for Quadrant B Data is divided into 100 sec bins |
 |
 |
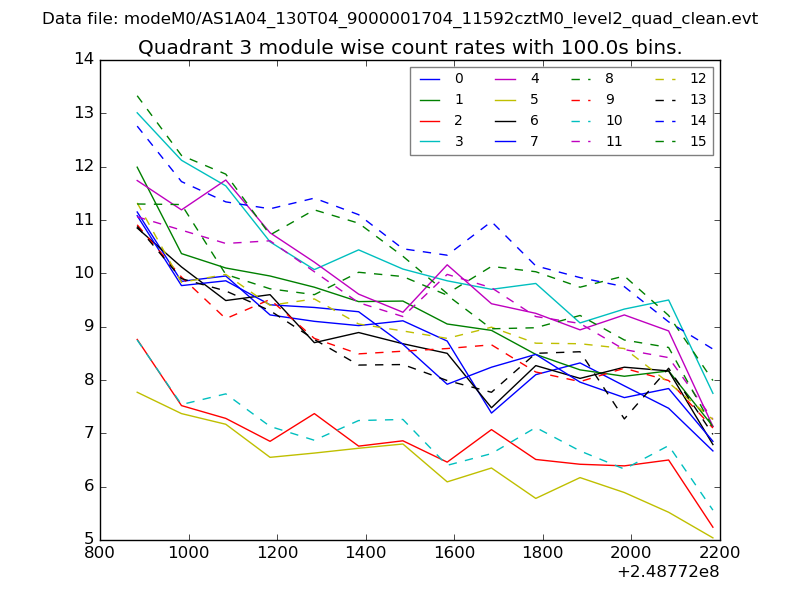
| Module-wise count rates for Quadrant C Data is divided into 100 sec bins |
 |
 |
| Module-wise count rates for Quadrant D Data is divided into 100 sec bins |
 |
 |
| Parameter | Plot |
|---|---|
| CZT HV Monitor | 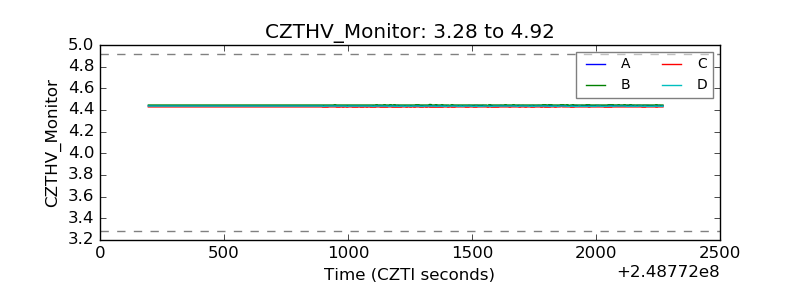 |
| D_VDD | 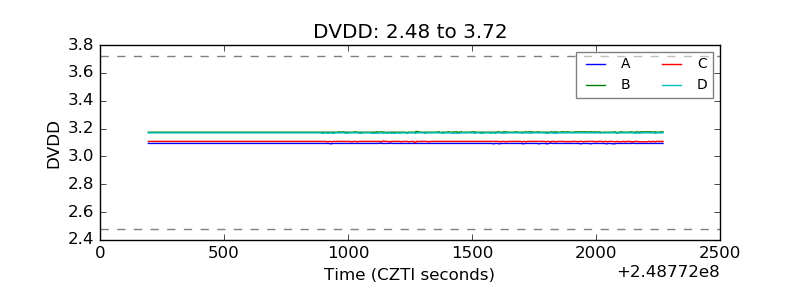 |
| Temperature 1 | 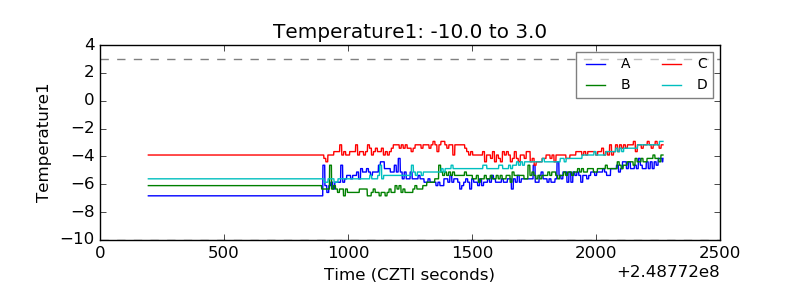 |
| Veto HV Monitor | 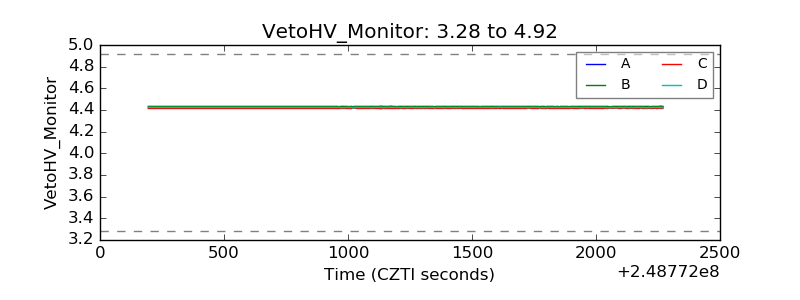 |
| Veto LLD | 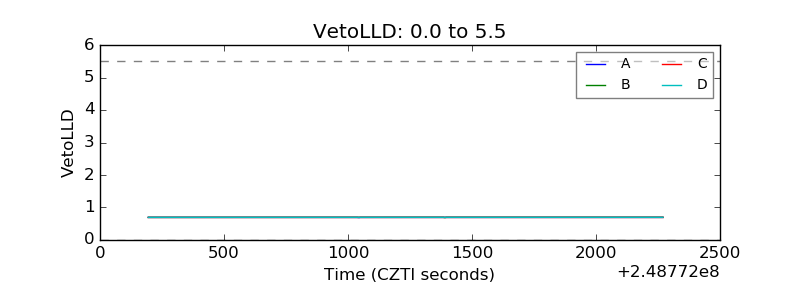 |
| Alpha Counter | 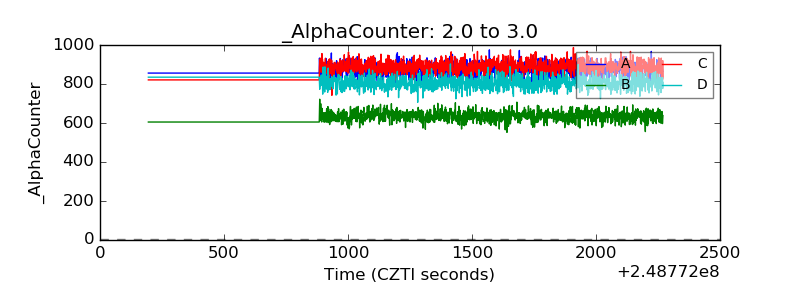 |
| _CPM_Rate | 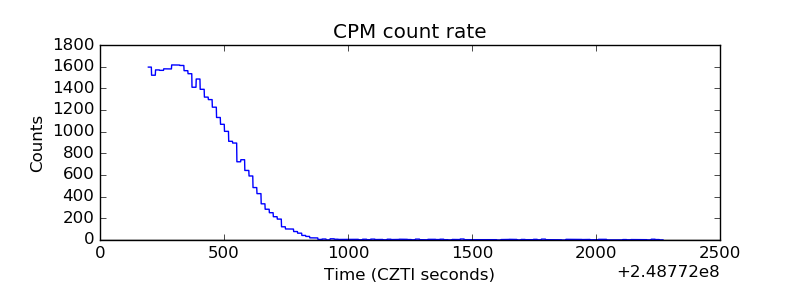 |
| CZT Counter | 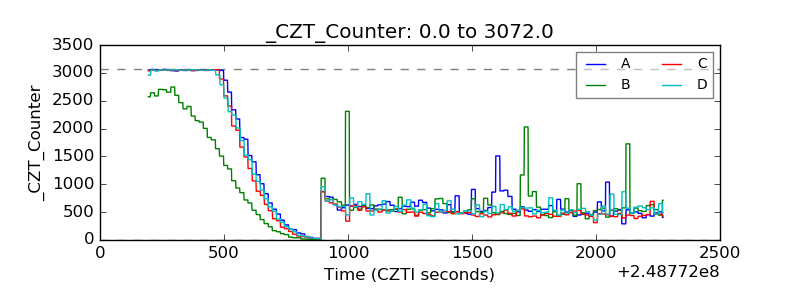 |
| +2.5 Volts monitor |  |
| +5 Volts monitor |  |
| _ROLL_ROT | 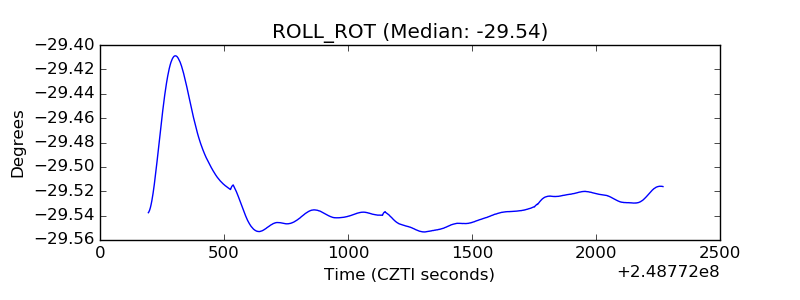 |
| _Roll_DEC | 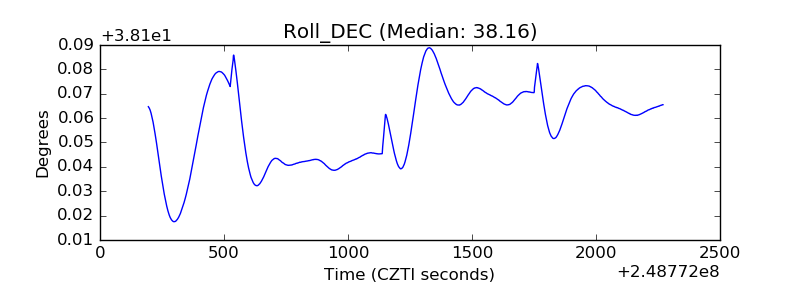 |
| _Roll_RA | 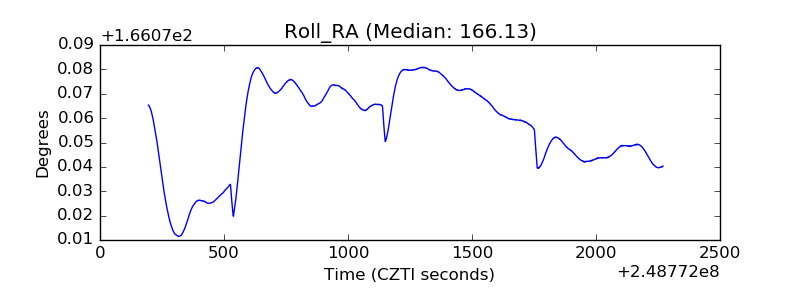 |
| Veto Counter | 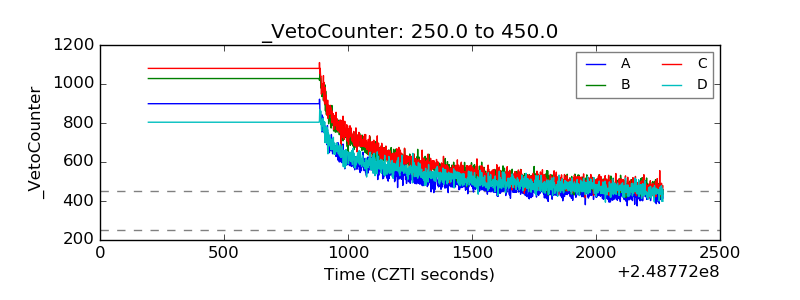 |