| Param | Original file | Final file |
|---|---|---|
| Filename | modeM0/AS1A04_130T04_9000001704_11594cztM0_level2.evt | modeM0/AS1A04_130T04_9000001704_11594cztM0_level2_quad_clean.evt |
| Size (bytes) | 711,996,480 | 87,177,600 |
| Size | 679.0 MB | 83.1 MB |
| Events in quadrant A | 5,704,038 | 554,336 |
| Events in quadrant B | 4,515,822 | 571,528 |
| Events in quadrant C | 2,932,602 | 575,444 |
| Events in quadrant D | 7,994,875 | 508,481 |
| Mode M0 | |||
|---|---|---|---|
| Quadrant | BADHDUFLAG | Total packets | Discarded packets |
| A | 0 | 21248 | 2 |
| B | 0 | 17233 | 1 |
| C | 0 | 12586 | 1 |
| D | 0 | 27906 | 1 |
| Mode SS | |||
|---|---|---|---|
| Quadrant | BADHDUFLAG | Total packets | Discarded packets |
| A | 0 | 126 | 0 |
| B | 0 | 126 | 0 |
| C | 0 | 126 | 0 |
| D | 0 | 126 | 0 |
| Mode M9 | |||
|---|---|---|---|
| Quadrant | BADHDUFLAG | Total packets | Discarded packets |
| A | 0 | 12 | 0 |
| B | 0 | 12 | 0 |
| C | 0 | 12 | 0 |
| D | 0 | 12 | 0 |
| Quadrant | Total seconds | Saturated seconds | Saturation percentage |
|---|---|---|---|
| A | 6149 | 708 | 11.514067% |
| B | 6149 | 490 | 7.968775% |
| C | 6149 | 73 | 1.187185% |
| D | 6149 | 1754 | 28.524963% |
Noise dominated data is calculated using 1-second bins in cleaned event files. If a bin has >2000 counts, and if more than 50% of those come from <1% of pixels, then it is considered to be noise-dominated and hence unusable.
| Quadrant | # 1 sec bins | Bins with >0 counts | Bins with >2000 counts | High rate bins dominated by noise | Noise dominated (total time) | Noise dominated (detector-on time) | Marked lightcurve |
|---|---|---|---|---|---|---|---|
| A | 7360 | 6151 | 379 | 379 | 5.15% | 6.16% | 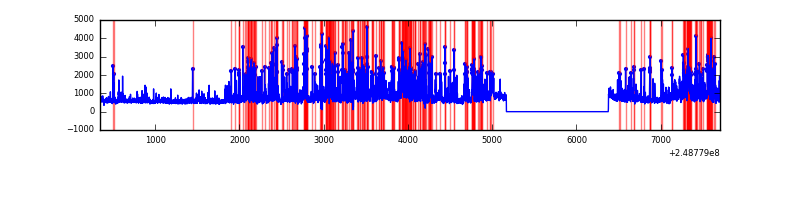 |
| B | 7360 | 6151 | 246 | 246 | 3.34% | 4.00% | 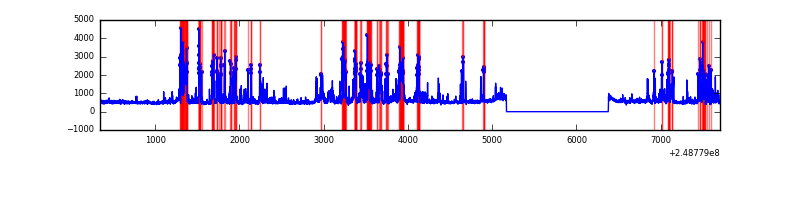 |
| C | 7360 | 6151 | 0 | 0 | 0.00% | 0.00% | 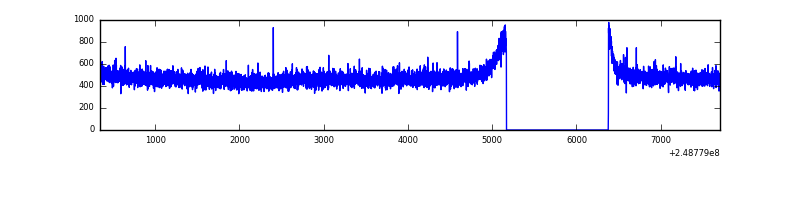 |
| D | 7360 | 6151 | 1620 | 1620 | 22.01% | 26.34% | 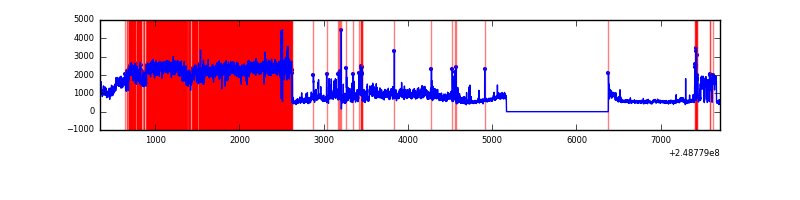 |
Top three noisy pixels from each quadrant. If the there are fewer than three noisy pixels in the level2.evt file, extra rows are filled as -1
| Pixel properties | Quadrant properties | ||||||
|---|---|---|---|---|---|---|---|
| Quadrant | DetID | PixID | Counts | Sigma | Mean | Median | Sigma |
| A | 8 | 5 | 2424929 | 15955.6 | 753 | 738 | 151.9 |
| A | 1 | 162 | 133440 | 873.42 | 753 | 738 | 151.9 |
| A | 1 | 178 | 81522 | 531.71 | 753 | 738 | 151.9 |
| B | 4 | 239 | 943995 | 6620.74 | 753 | 735 | 142.5 |
| B | 3 | 64 | 388154 | 2719.29 | 753 | 735 | 142.5 |
| B | 11 | 51 | 83541 | 581.21 | 753 | 735 | 142.5 |
| C | 13 | 61 | 5518 | 27.5 | 751 | 755 | 173.2 |
| C | 12 | 4 | 2467 | 9.88 | 751 | 755 | 173.2 |
| C | 14 | 67 | 1966 | 6.99 | 751 | 755 | 173.2 |
| D | 13 | 122 | 4686107 | 27769.14 | 706 | 687 | 168.7 |
| D | 8 | 195 | 297924 | 1761.64 | 706 | 687 | 168.7 |
| D | 1 | 52 | 209667 | 1238.56 | 706 | 687 | 168.7 |
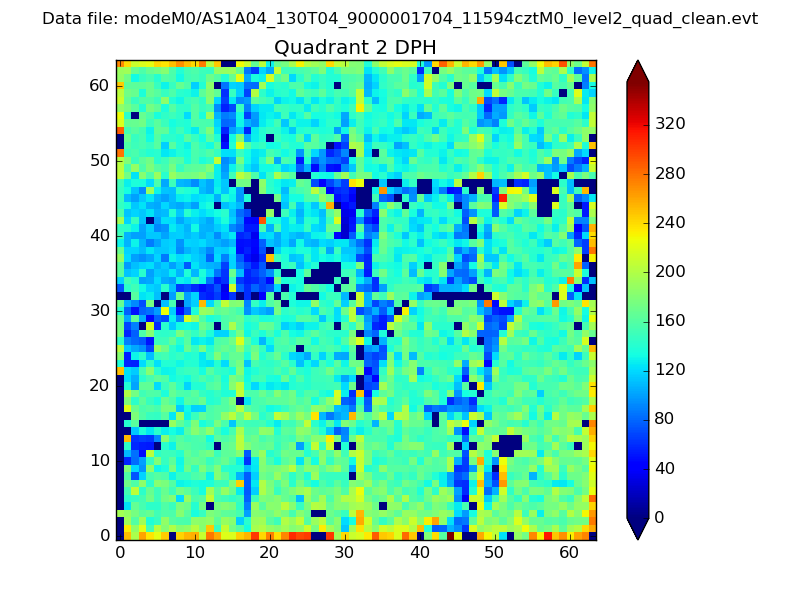
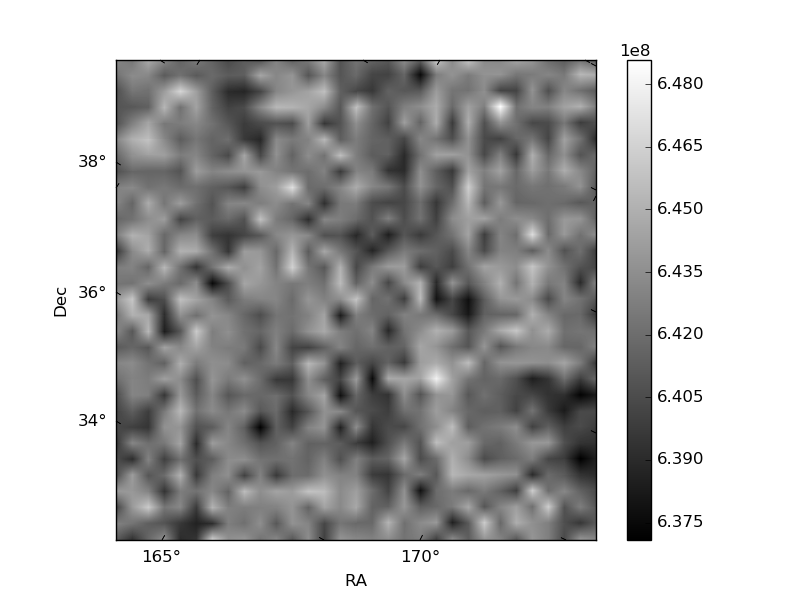
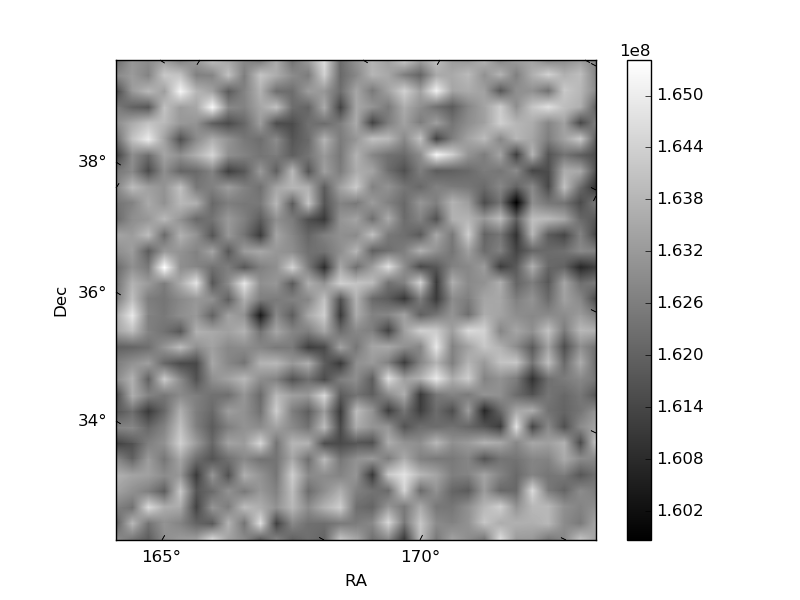
Histogram calculated using DETX and DETY for each event in the final _common_clean file
| Quadrant A | 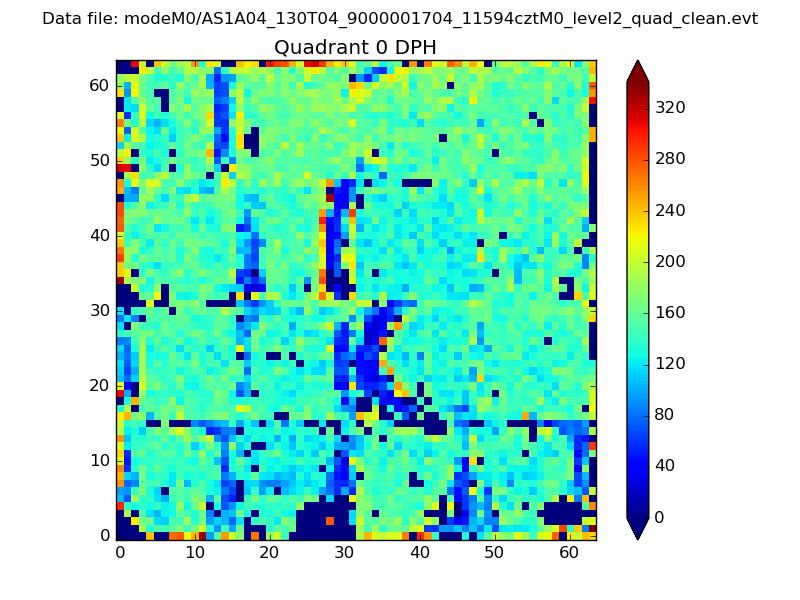 |
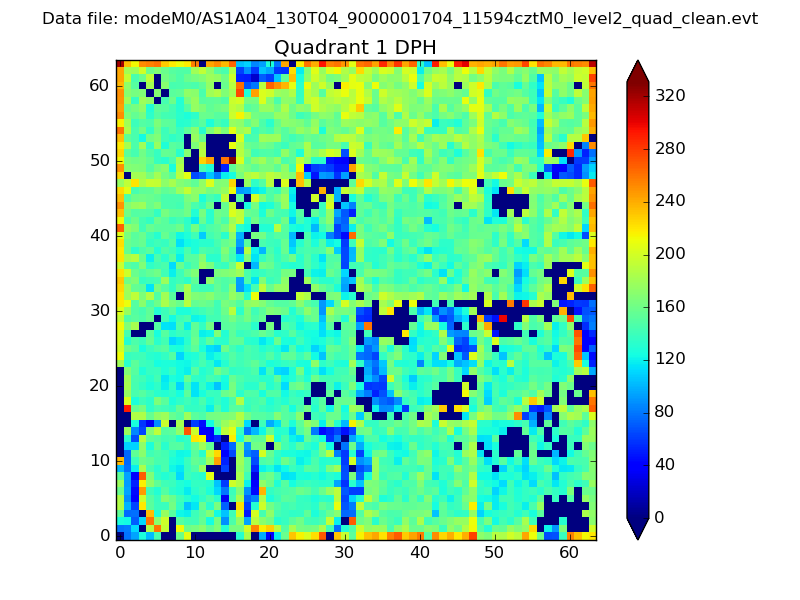 |
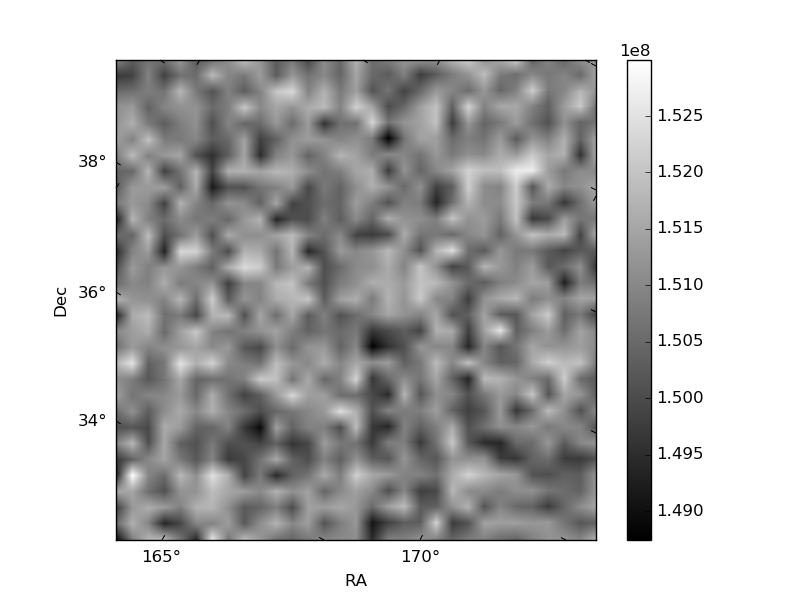
Quadrant B |
|---|---|---|---|
| Quadrant D | 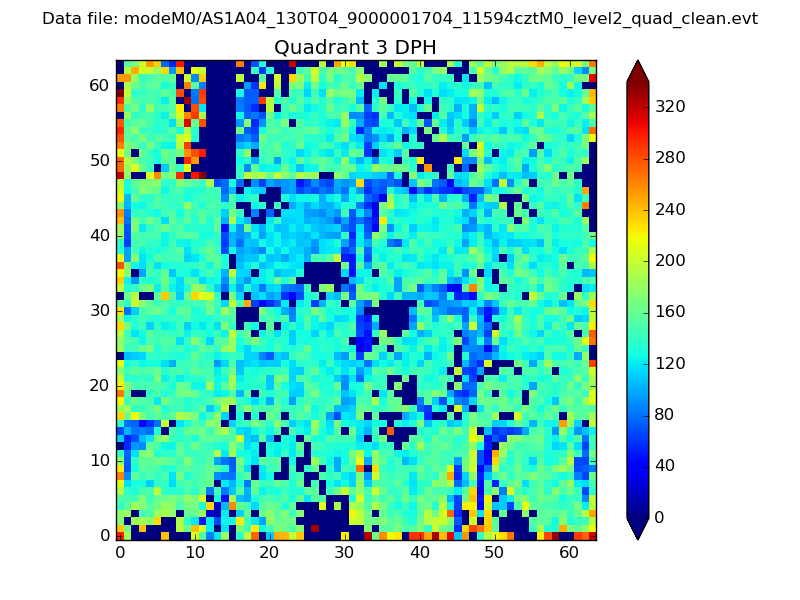 |
 |
Quadrant C |
| Plot type | Count rate plots | Images |
|---|---|---|
| Comparison with Poisson distribution Blue bars denote a histogram of data divided into 1 sec bins. Red curve is a Poisson curve with rate = median count rate of data. |
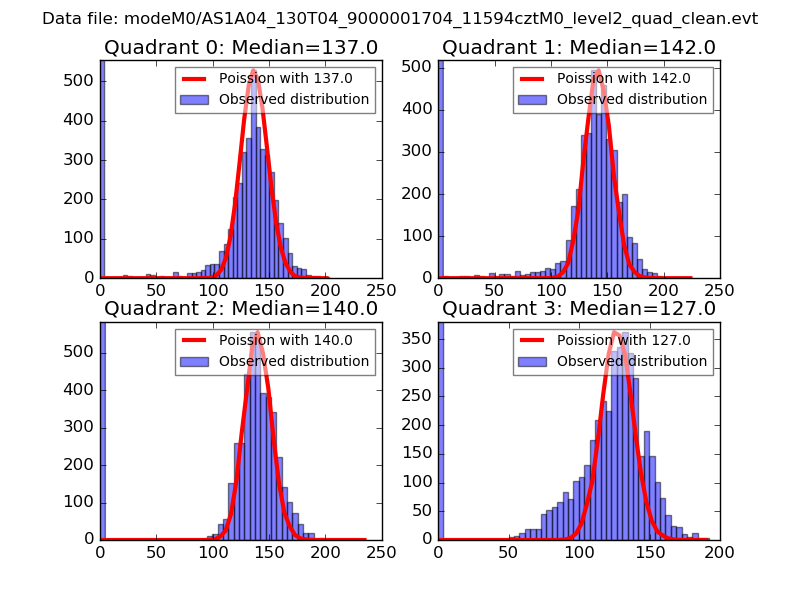 |
 |
| Quadrant-wise count rates Data is divided into 100 sec bins |
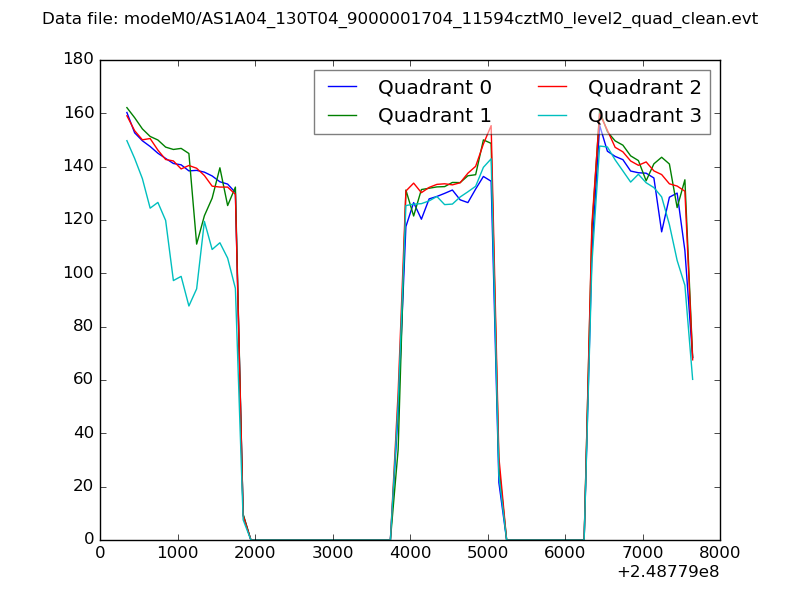 |
|
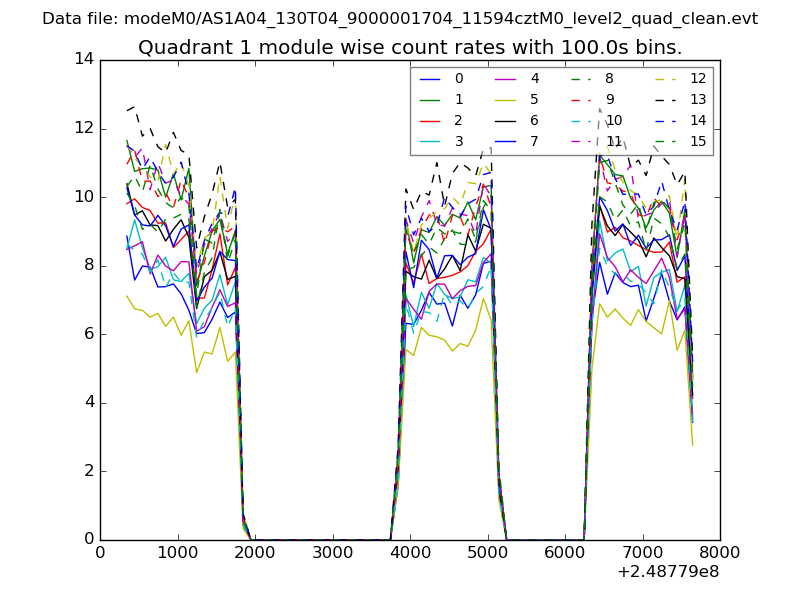
| Module-wise count rates for Quadrant A Data is divided into 100 sec bins |
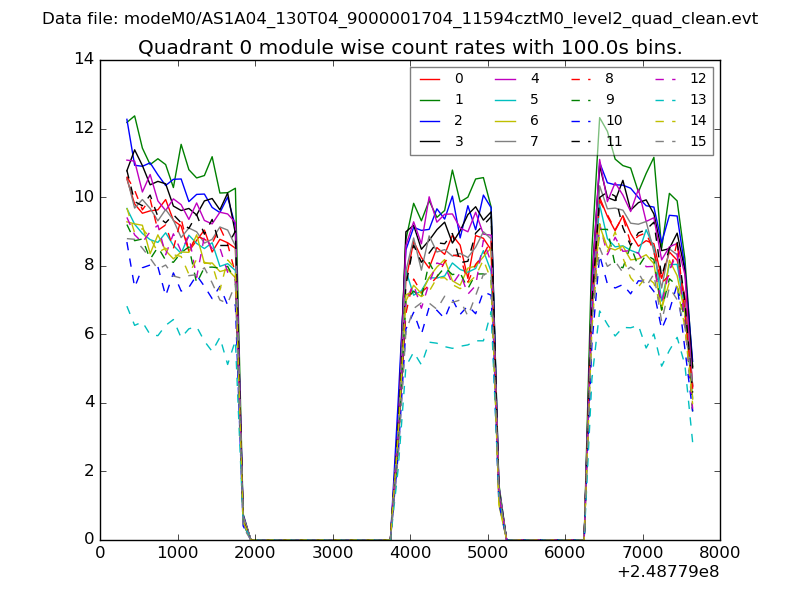 |
 |
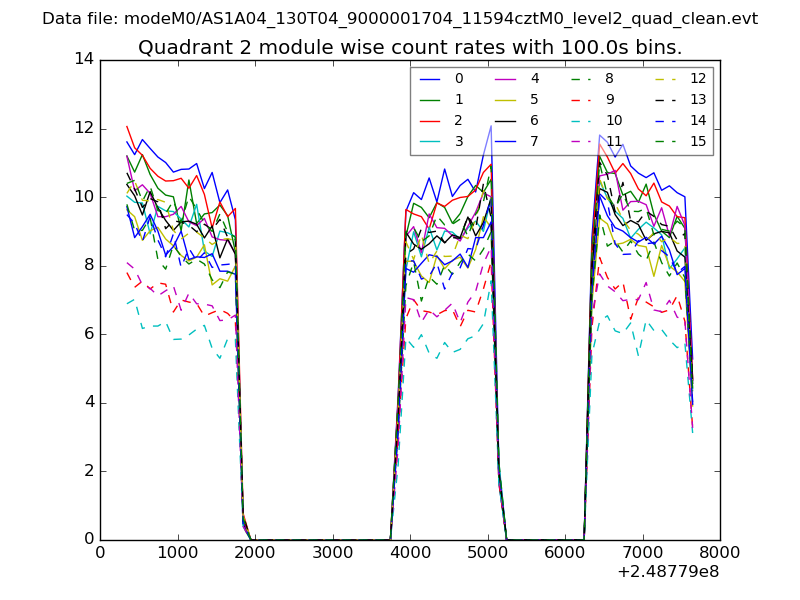
| Module-wise count rates for Quadrant B Data is divided into 100 sec bins |
 |
 |
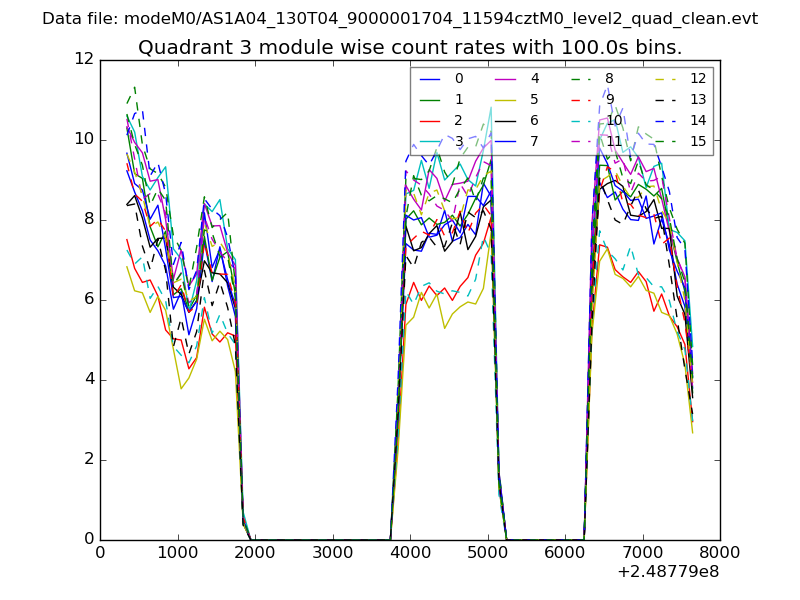
| Module-wise count rates for Quadrant C Data is divided into 100 sec bins |
 |
 |
| Module-wise count rates for Quadrant D Data is divided into 100 sec bins |
 |
 |
| Parameter | Plot |
|---|---|
| CZT HV Monitor | 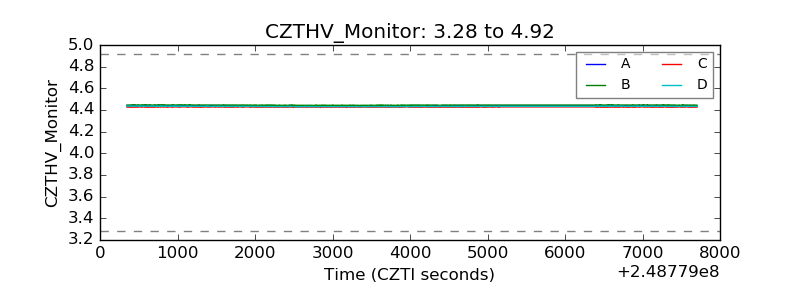 |
| D_VDD | 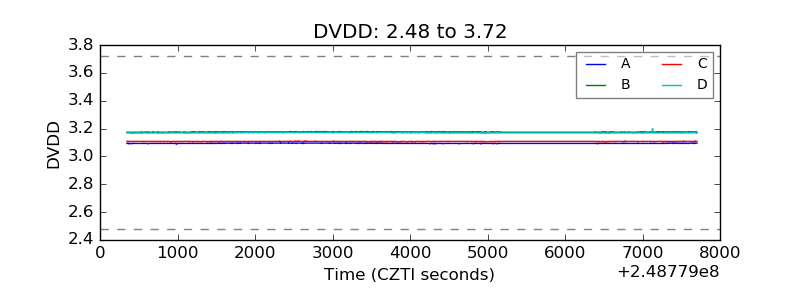 |
| Temperature 1 | 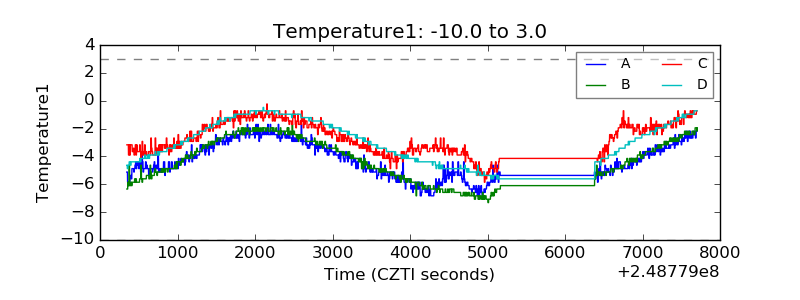 |
| Veto HV Monitor | 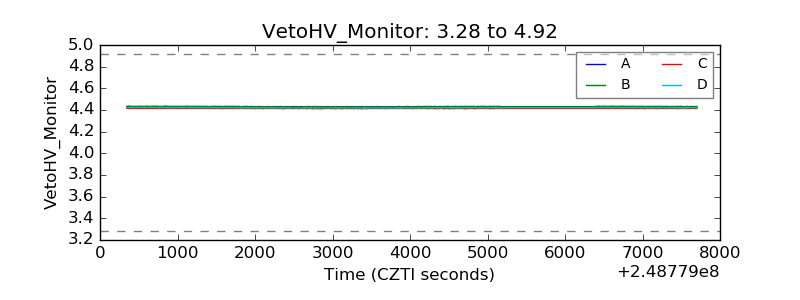 |
| Veto LLD | 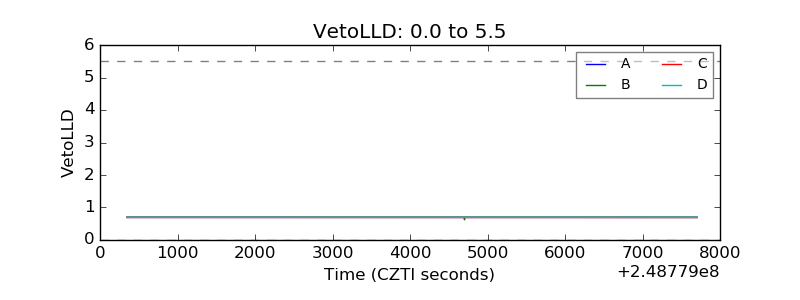 |
| Alpha Counter | 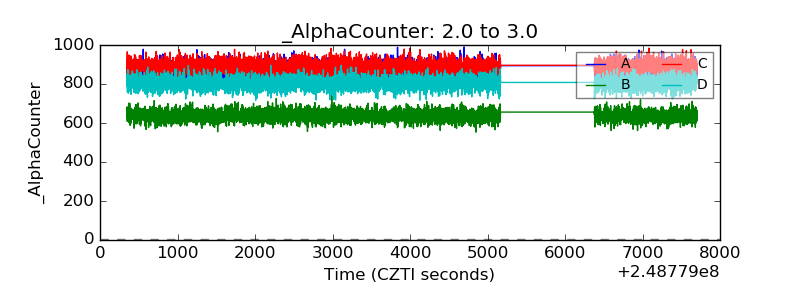 |
| _CPM_Rate | 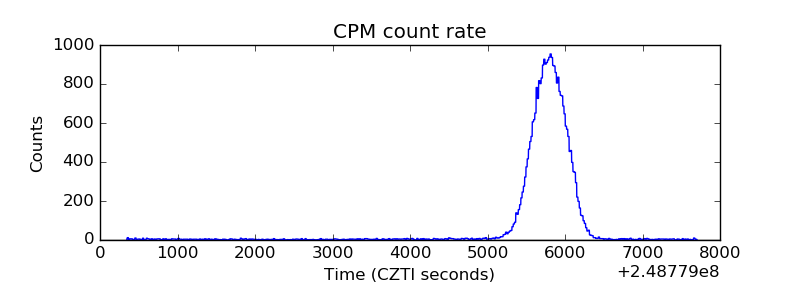 |
| CZT Counter |  |
| +2.5 Volts monitor |  |
| +5 Volts monitor |  |
| _ROLL_ROT | 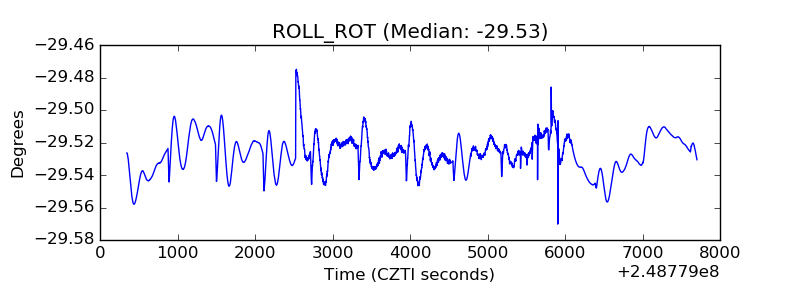 |
| _Roll_DEC | 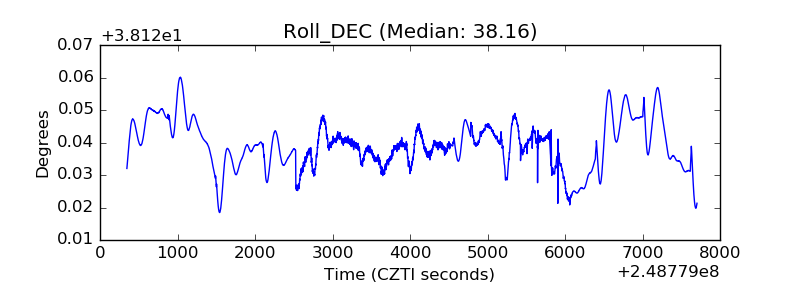 |
| _Roll_RA | 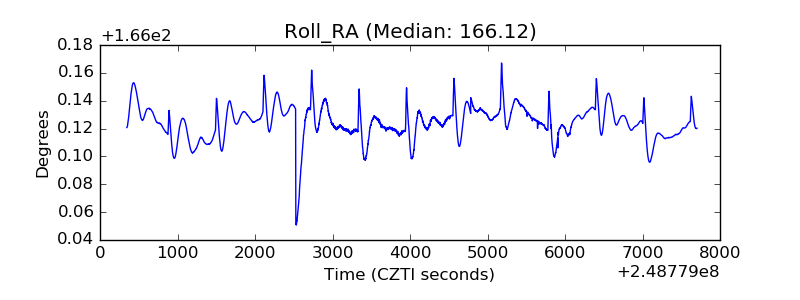 |
| Veto Counter | 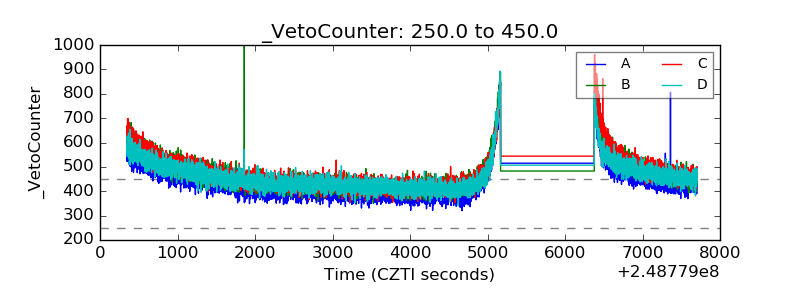 |