| Param | Original file | Final file |
|---|---|---|
| Filename | modeM0/AS1A04_130T04_9000001704_11596cztM0_level2.evt | modeM0/AS1A04_130T04_9000001704_11596cztM0_level2_quad_clean.evt |
| Size (bytes) | 702,630,720 | 71,651,520 |
| Size | 670.1 MB | 68.3 MB |
| Events in quadrant A | 9,427,285 | 362,130 |
| Events in quadrant B | 4,864,729 | 457,378 |
| Events in quadrant C | 2,980,067 | 456,835 |
| Events in quadrant D | 3,568,391 | 440,117 |
| Mode M0 | |||
|---|---|---|---|
| Quadrant | BADHDUFLAG | Total packets | Discarded packets |
| A | 0 | 32487 | 2 |
| B | 0 | 18788 | 1 |
| C | 0 | 13264 | 1 |
| D | 0 | 14884 | 1 |
| Mode SS | |||
|---|---|---|---|
| Quadrant | BADHDUFLAG | Total packets | Discarded packets |
| A | 0 | 132 | 0 |
| B | 0 | 132 | 0 |
| C | 0 | 132 | 0 |
| D | 0 | 132 | 0 |
| Mode M9 | |||
|---|---|---|---|
| Quadrant | BADHDUFLAG | Total packets | Discarded packets |
| A | 0 | 8 | 0 |
| B | 0 | 8 | 0 |
| C | 0 | 8 | 0 |
| D | 0 | 8 | 0 |
| Quadrant | Total seconds | Saturated seconds | Saturation percentage |
|---|---|---|---|
| A | 6483 | 2515 | 38.793768% |
| B | 6483 | 469 | 7.234305% |
| C | 6483 | 104 | 1.604196% |
| D | 6483 | 173 | 2.668518% |
Noise dominated data is calculated using 1-second bins in cleaned event files. If a bin has >2000 counts, and if more than 50% of those come from <1% of pixels, then it is considered to be noise-dominated and hence unusable.
| Quadrant | # 1 sec bins | Bins with >0 counts | Bins with >2000 counts | High rate bins dominated by noise | Noise dominated (total time) | Noise dominated (detector-on time) | Marked lightcurve |
|---|---|---|---|---|---|---|---|
| A | 7309 | 6485 | 1756 | 1756 | 24.03% | 27.08% | 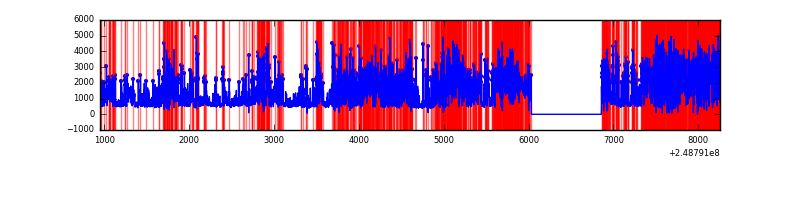 |
| B | 7309 | 6485 | 223 | 223 | 3.05% | 3.44% | 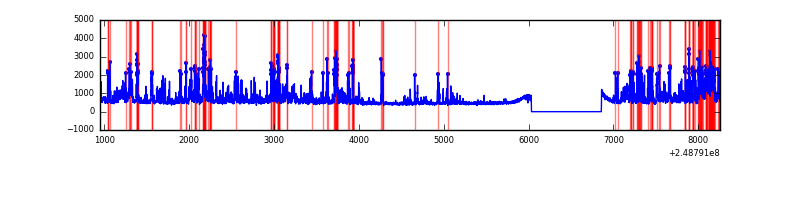 |
| C | 7309 | 6485 | 0 | 0 | 0.00% | 0.00% | 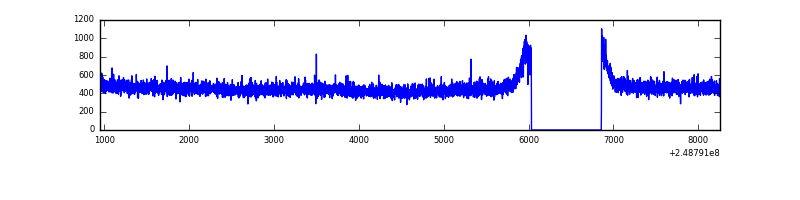 |
| D | 7309 | 6485 | 57 | 57 | 0.78% | 0.88% | 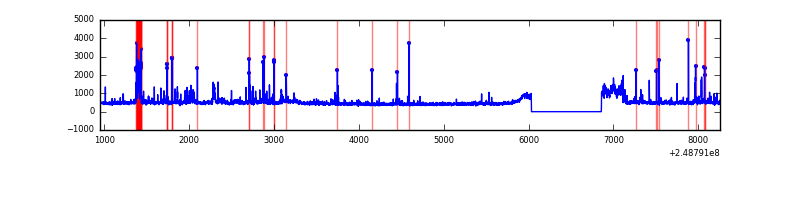 |
Top three noisy pixels from each quadrant. If the there are fewer than three noisy pixels in the level2.evt file, extra rows are filled as -1
| Pixel properties | Quadrant properties | ||||||
|---|---|---|---|---|---|---|---|
| Quadrant | DetID | PixID | Counts | Sigma | Mean | Median | Sigma |
| A | 8 | 5 | 6598932 | 52120.27 | 619 | 606 | 126.6 |
| A | 1 | 162 | 145595 | 1145.27 | 619 | 606 | 126.6 |
| A | 1 | 178 | 87028 | 682.64 | 619 | 606 | 126.6 |
| B | 4 | 239 | 1066002 | 7180.52 | 772 | 752 | 148.4 |
| B | 3 | 64 | 434580 | 2924.3 | 772 | 752 | 148.4 |
| B | 11 | 51 | 112812 | 755.36 | 772 | 752 | 148.4 |
| C | 13 | 61 | 5501 | 26.77 | 763 | 765 | 176.9 |
| C | 12 | 4 | 5048 | 24.21 | 763 | 765 | 176.9 |
| C | 3 | 202 | 1903 | 6.43 | 763 | 765 | 176.9 |
| D | 1 | 52 | 180080 | 979.96 | 764 | 739 | 183.0 |
| D | 13 | 122 | 131535 | 714.7 | 764 | 739 | 183.0 |
| D | 8 | 195 | 120932 | 656.76 | 764 | 739 | 183.0 |
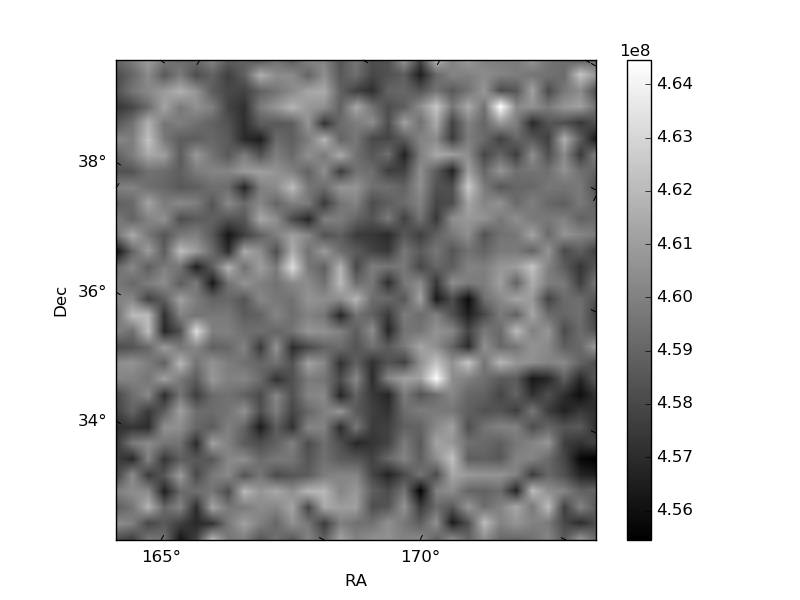
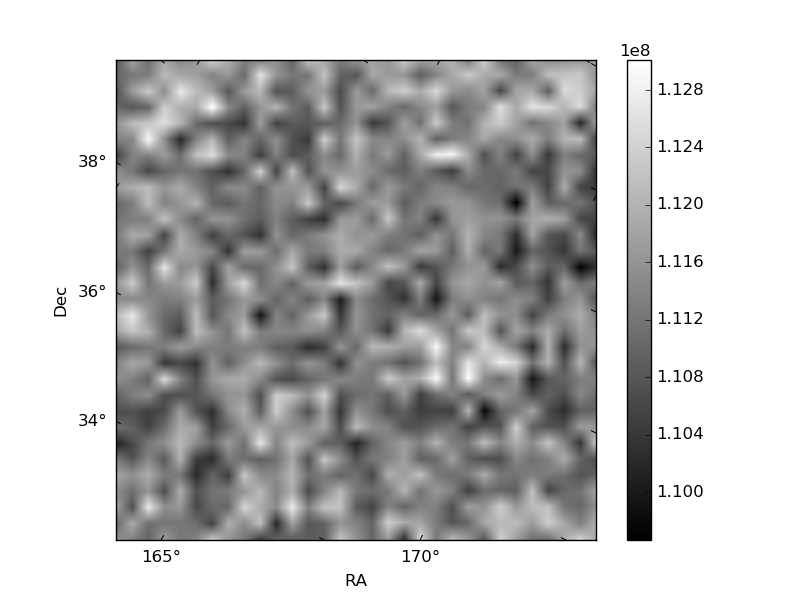
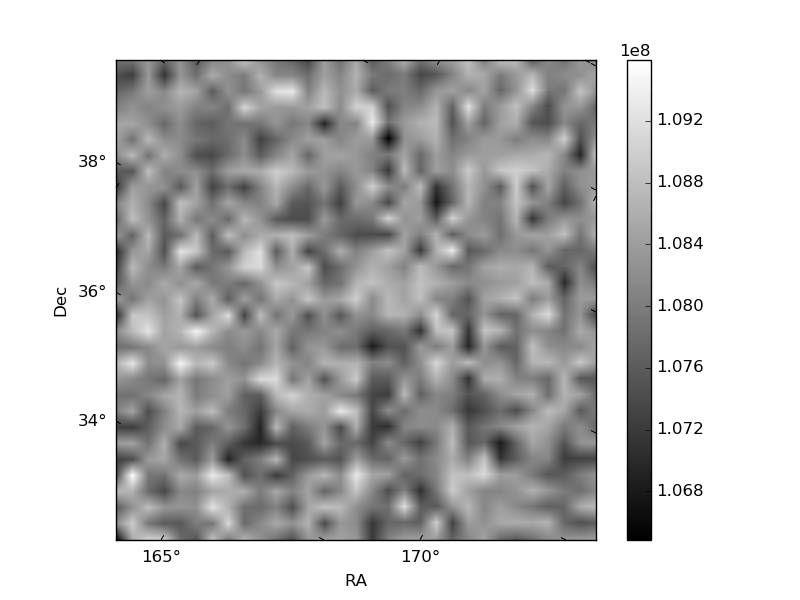
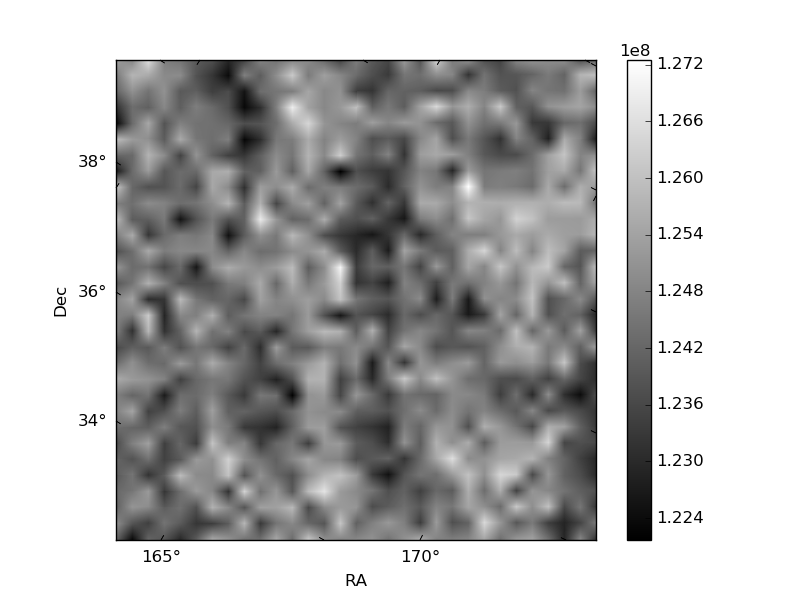
Histogram calculated using DETX and DETY for each event in the final _common_clean file
| Quadrant A | 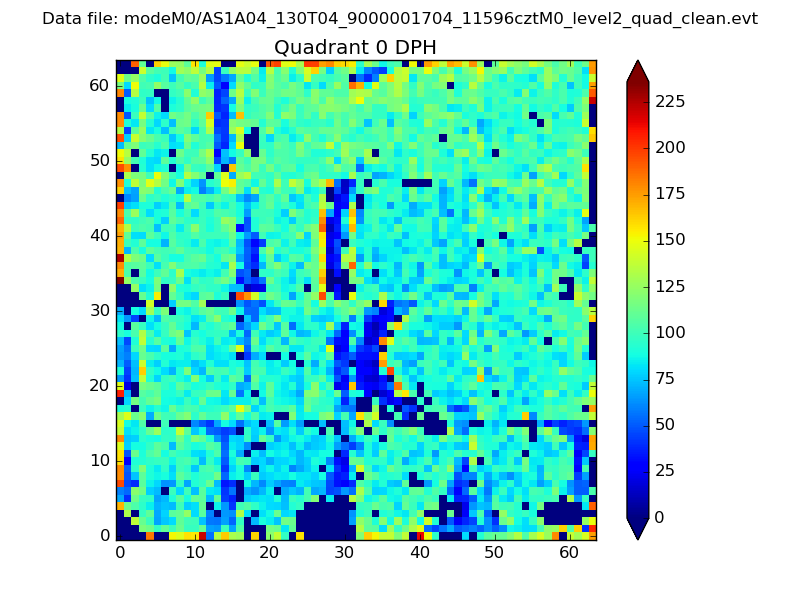 |
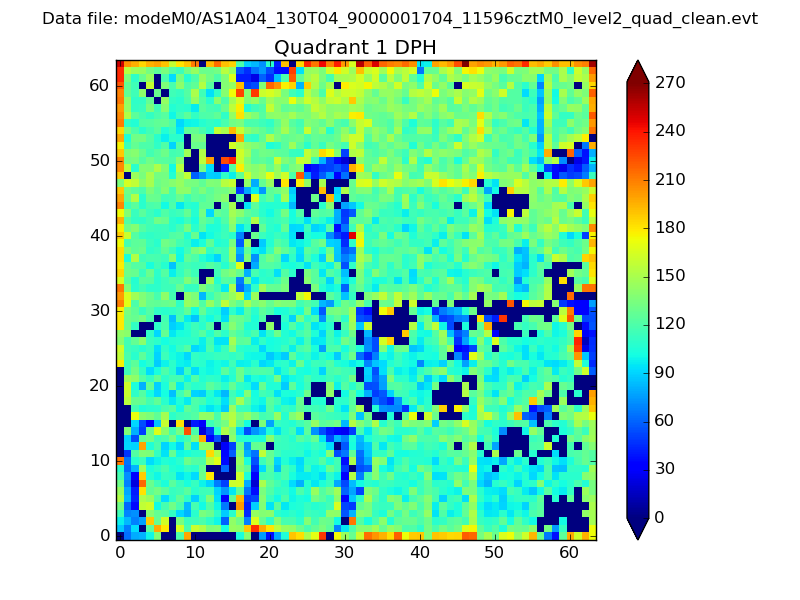 |
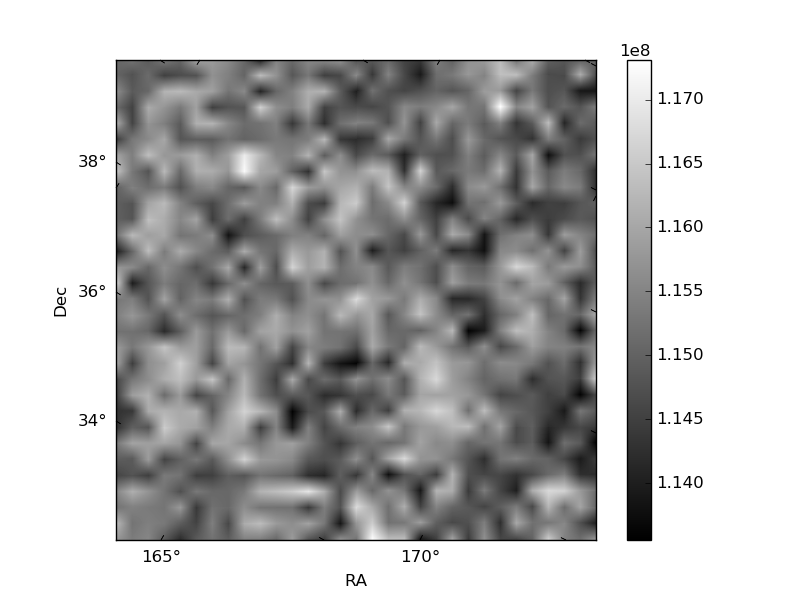
Quadrant B |
|---|---|---|---|
| Quadrant D | 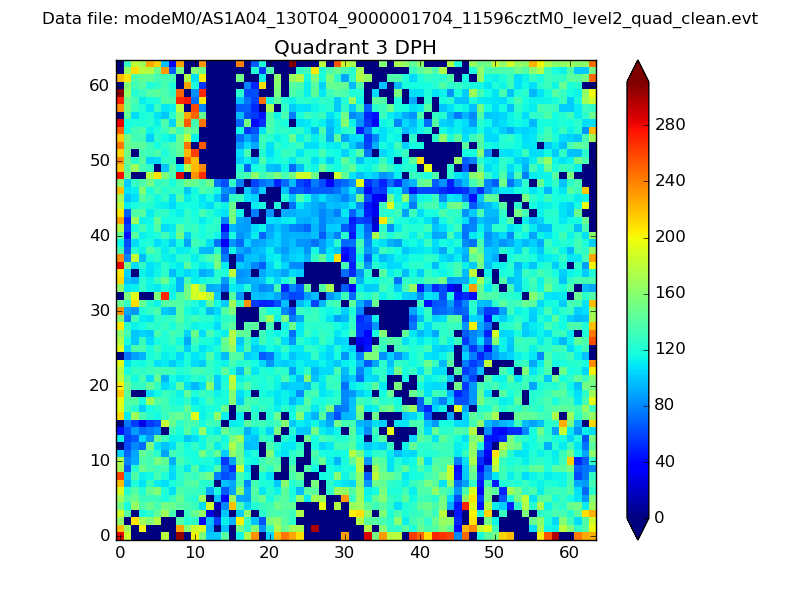 |
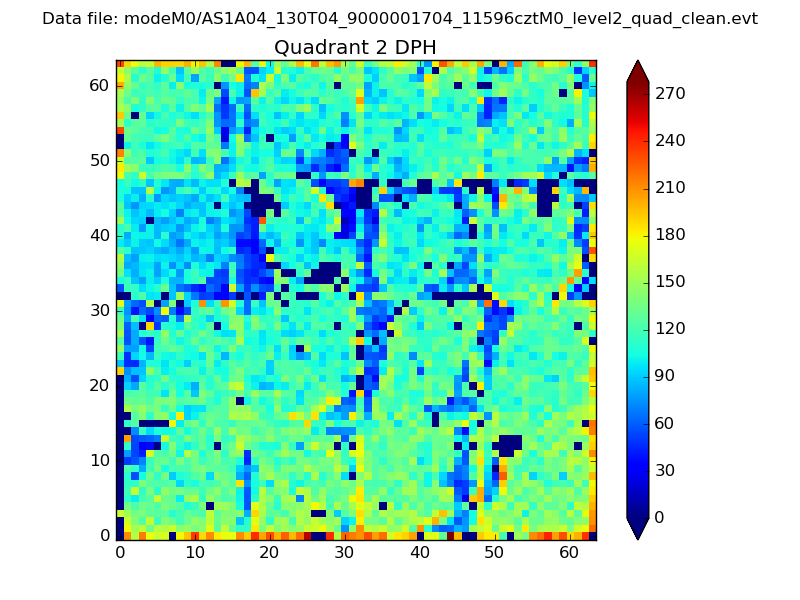 |
Quadrant C |
| Plot type | Count rate plots | Images |
|---|---|---|
| Comparison with Poisson distribution Blue bars denote a histogram of data divided into 1 sec bins. Red curve is a Poisson curve with rate = median count rate of data. |
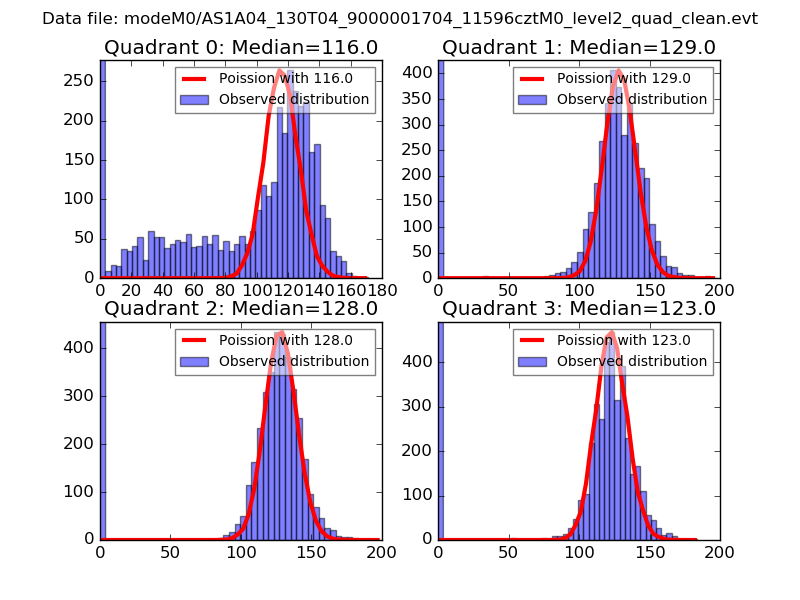 |
 |
| Quadrant-wise count rates Data is divided into 100 sec bins |
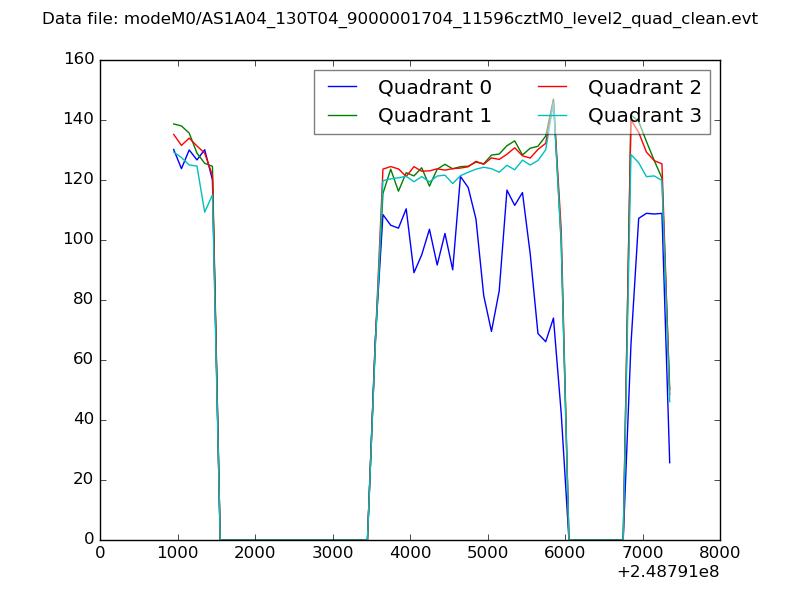 |
|
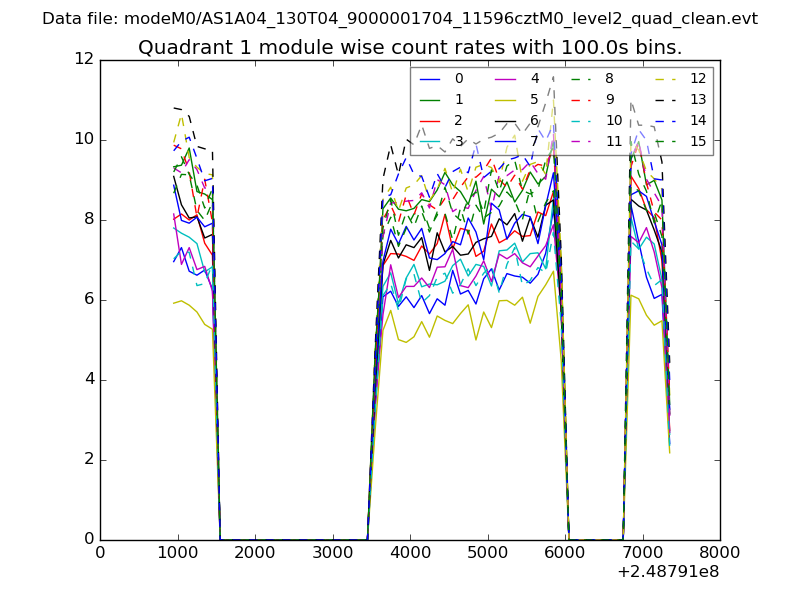
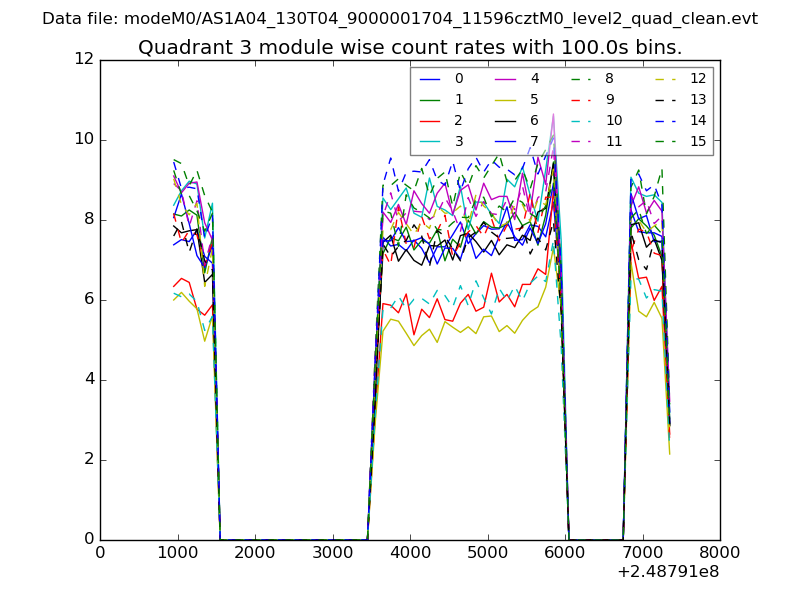
| Module-wise count rates for Quadrant A Data is divided into 100 sec bins |
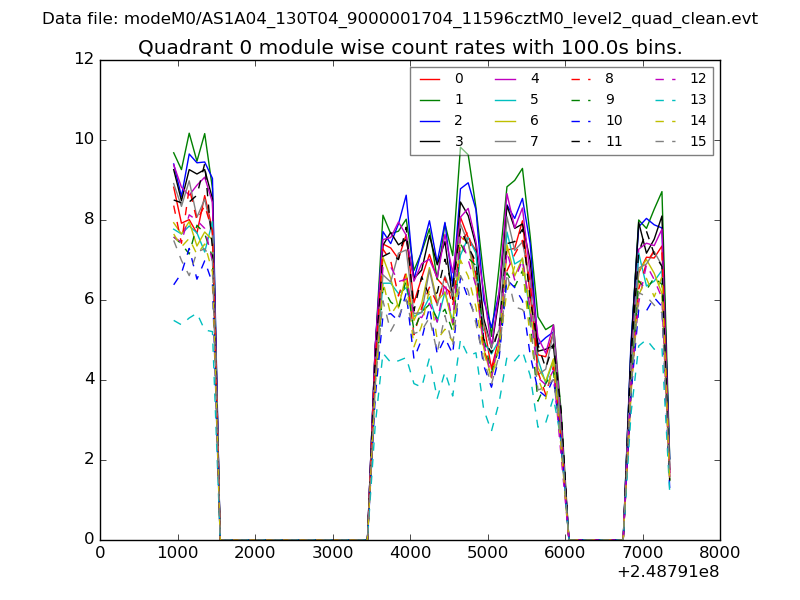 |
 |
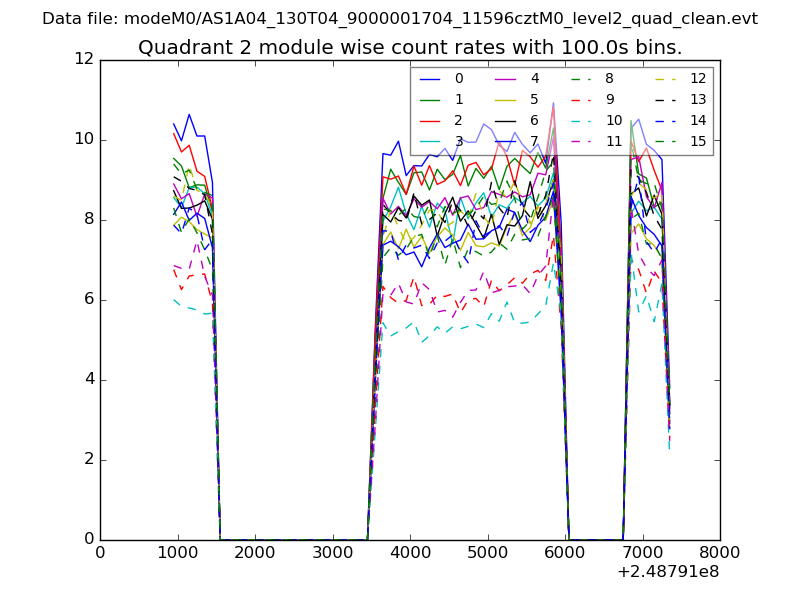
| Module-wise count rates for Quadrant B Data is divided into 100 sec bins |
 |
 |
| Module-wise count rates for Quadrant C Data is divided into 100 sec bins |
 |
 |
| Module-wise count rates for Quadrant D Data is divided into 100 sec bins |
 |
 |
| Parameter | Plot |
|---|---|
| CZT HV Monitor | 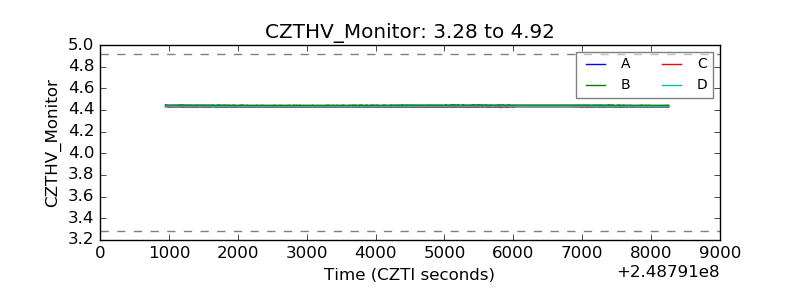 |
| D_VDD | 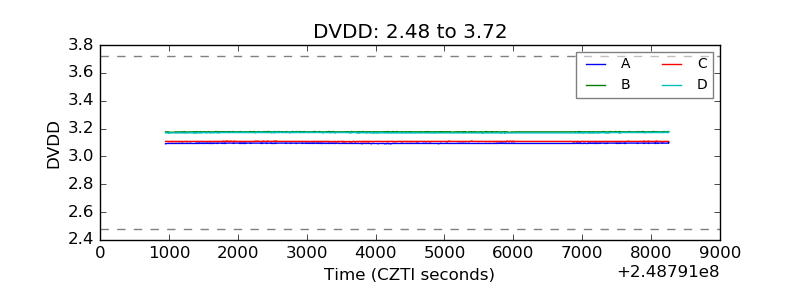 |
| Temperature 1 | 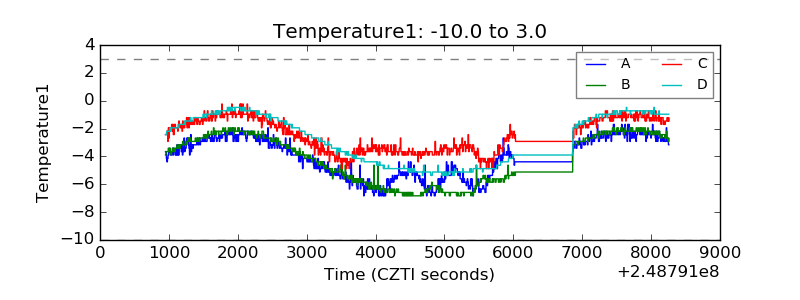 |
| Veto HV Monitor | 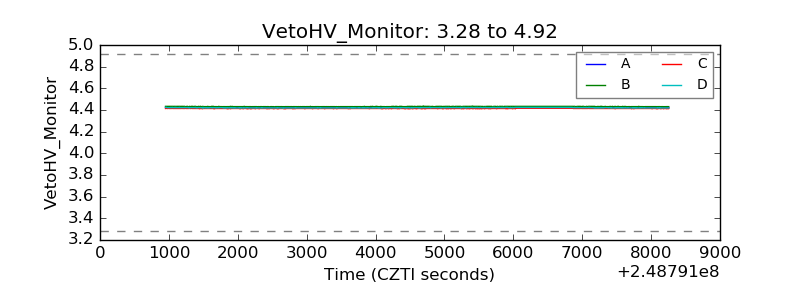 |
| Veto LLD | 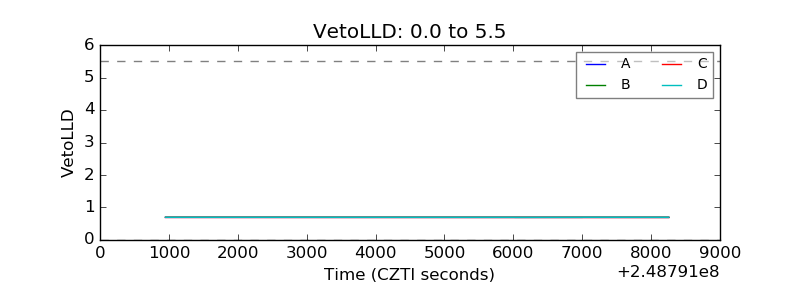 |
| Alpha Counter | 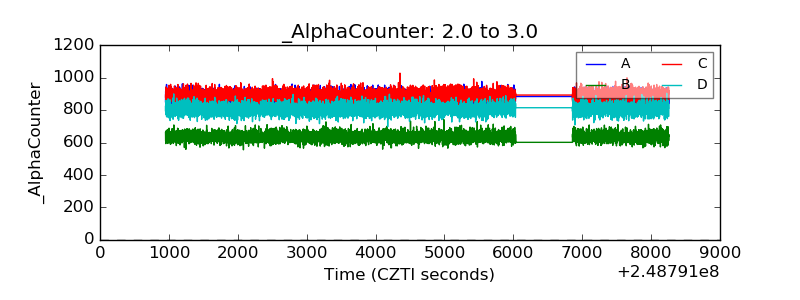 |
| _CPM_Rate | 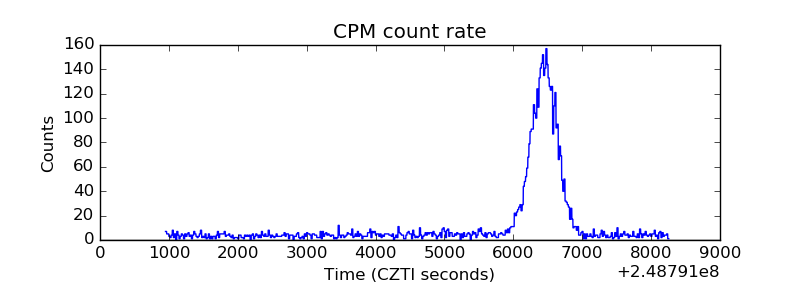 |
| CZT Counter | 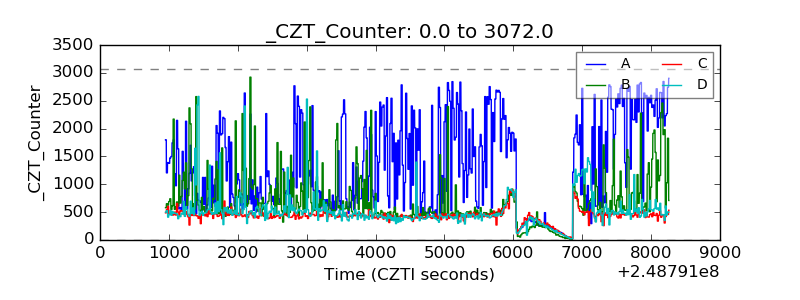 |
| +2.5 Volts monitor |  |
| +5 Volts monitor |  |
| _ROLL_ROT | 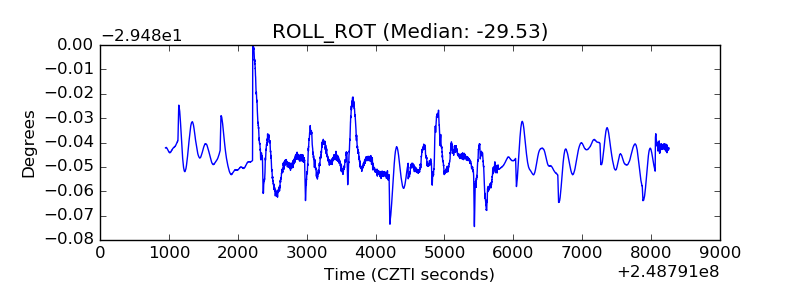 |
| _Roll_DEC | 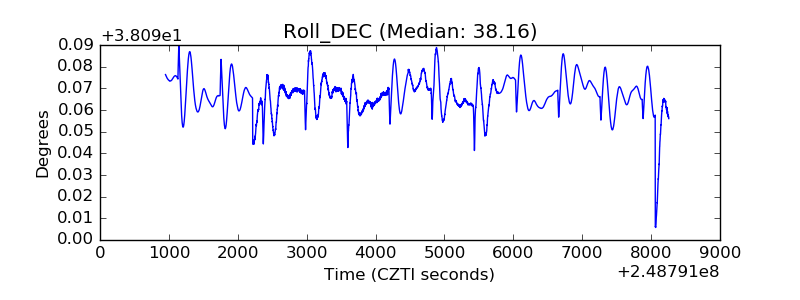 |
| _Roll_RA | 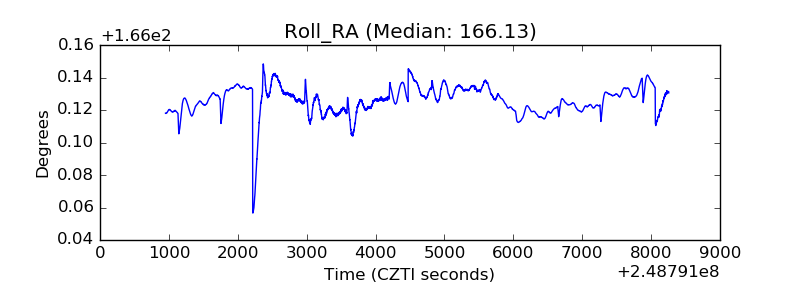 |
| Veto Counter | 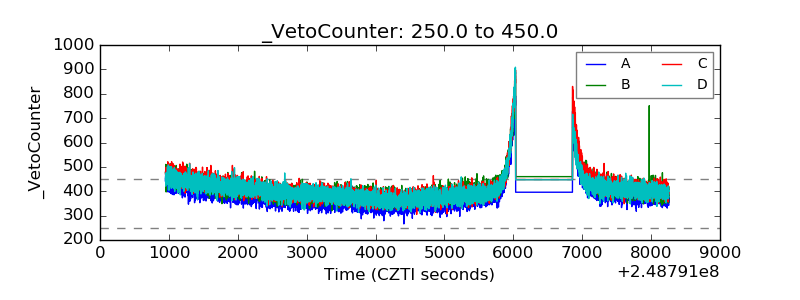 |