| Param | Original file | Final file |
|---|---|---|
| Filename | modeM0/AS1A04_130T04_9000001704_11597cztM0_level2.evt | modeM0/AS1A04_130T04_9000001704_11597cztM0_level2_quad_clean.evt |
| Size (bytes) | 862,332,480 | 75,680,640 |
| Size | 822.4 MB | 72.2 MB |
| Events in quadrant A | 11,839,802 | 364,994 |
| Events in quadrant B | 5,686,397 | 474,359 |
| Events in quadrant C | 3,406,163 | 474,775 |
| Events in quadrant D | 4,680,078 | 457,623 |
| Mode M0 | |||
|---|---|---|---|
| Quadrant | BADHDUFLAG | Total packets | Discarded packets |
| A | 0 | 40354 | 3 |
| B | 0 | 21954 | 2 |
| C | 0 | 15291 | 2 |
| D | 0 | 18866 | 2 |
| Mode SS | |||
|---|---|---|---|
| Quadrant | BADHDUFLAG | Total packets | Discarded packets |
| A | 0 | 152 | 0 |
| B | 0 | 152 | 0 |
| C | 0 | 152 | 0 |
| D | 0 | 152 | 0 |
| Mode M9 | |||
|---|---|---|---|
| Quadrant | BADHDUFLAG | Total packets | Discarded packets |
| A | 0 | 5 | 0 |
| B | 0 | 5 | 0 |
| C | 0 | 5 | 0 |
| D | 0 | 5 | 0 |
| Quadrant | Total seconds | Saturated seconds | Saturation percentage |
|---|---|---|---|
| A | 7452 | 3337 | 44.779925% |
| B | 7452 | 638 | 8.561460% |
| C | 7452 | 60 | 0.805153% |
| D | 7453 | 217 | 2.911579% |
Noise dominated data is calculated using 1-second bins in cleaned event files. If a bin has >2000 counts, and if more than 50% of those come from <1% of pixels, then it is considered to be noise-dominated and hence unusable.
| Quadrant | # 1 sec bins | Bins with >0 counts | Bins with >2000 counts | High rate bins dominated by noise | Noise dominated (total time) | Noise dominated (detector-on time) | Marked lightcurve |
|---|---|---|---|---|---|---|---|
| A | 7973 | 7454 | 2391 | 2391 | 29.99% | 32.08% | 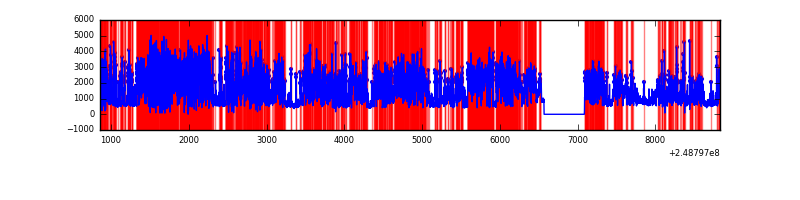 |
| B | 7973 | 7454 | 320 | 320 | 4.01% | 4.29% | 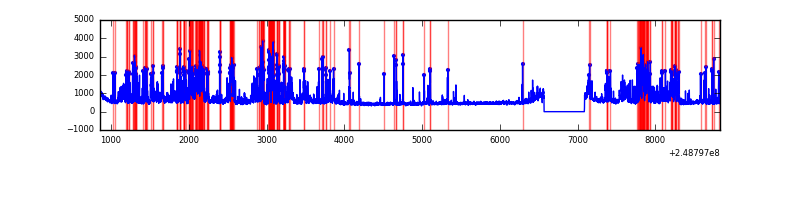 |
| C | 7973 | 7454 | 0 | 0 | 0.00% | 0.00% | 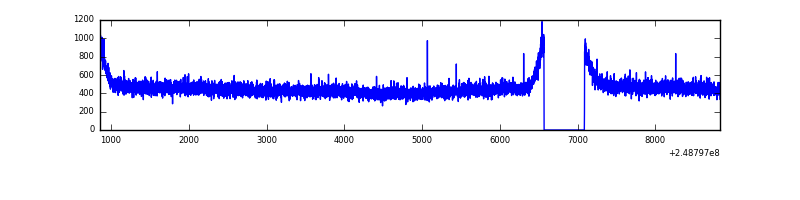 |
| D | 7974 | 7455 | 119 | 119 | 1.49% | 1.60% | 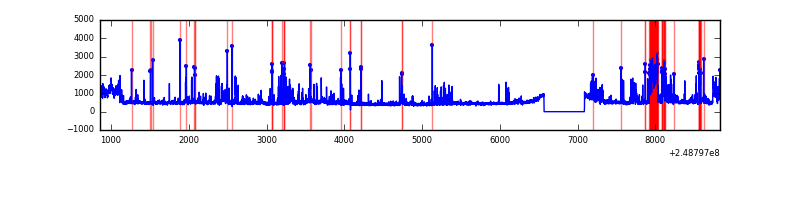 |
Top three noisy pixels from each quadrant. If the there are fewer than three noisy pixels in the level2.evt file, extra rows are filled as -1
| Pixel properties | Quadrant properties | ||||||
|---|---|---|---|---|---|---|---|
| Quadrant | DetID | PixID | Counts | Sigma | Mean | Median | Sigma |
| A | 8 | 5 | 8682573 | 60587.25 | 701 | 684 | 143.3 |
| A | 1 | 162 | 164643 | 1144.2 | 701 | 684 | 143.3 |
| A | 1 | 178 | 94987 | 658.1 | 701 | 684 | 143.3 |
| B | 4 | 239 | 1499818 | 8904.76 | 876 | 854 | 168.3 |
| B | 3 | 64 | 492545 | 2920.94 | 876 | 854 | 168.3 |
| B | 11 | 51 | 123582 | 729.08 | 876 | 854 | 168.3 |
| C | 13 | 61 | 6385 | 27.07 | 873 | 876 | 203.5 |
| C | 14 | 67 | 2808 | 9.49 | 873 | 876 | 203.5 |
| C | 3 | 202 | 2009 | 5.57 | 873 | 876 | 203.5 |
| D | 1 | 52 | 782193 | 3696.84 | 872 | 846 | 211.4 |
| D | 5 | 222 | 204004 | 961.22 | 872 | 846 | 211.4 |
| D | 13 | 122 | 135543 | 637.3 | 872 | 846 | 211.4 |
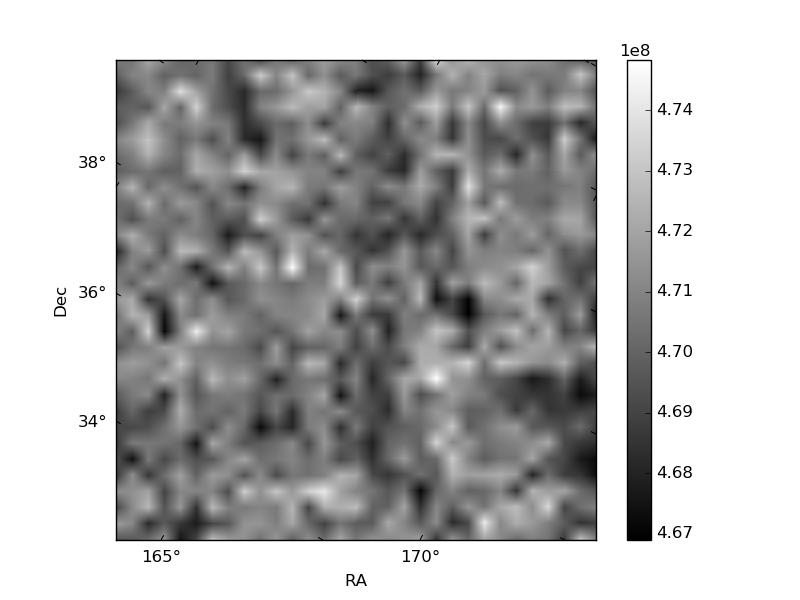
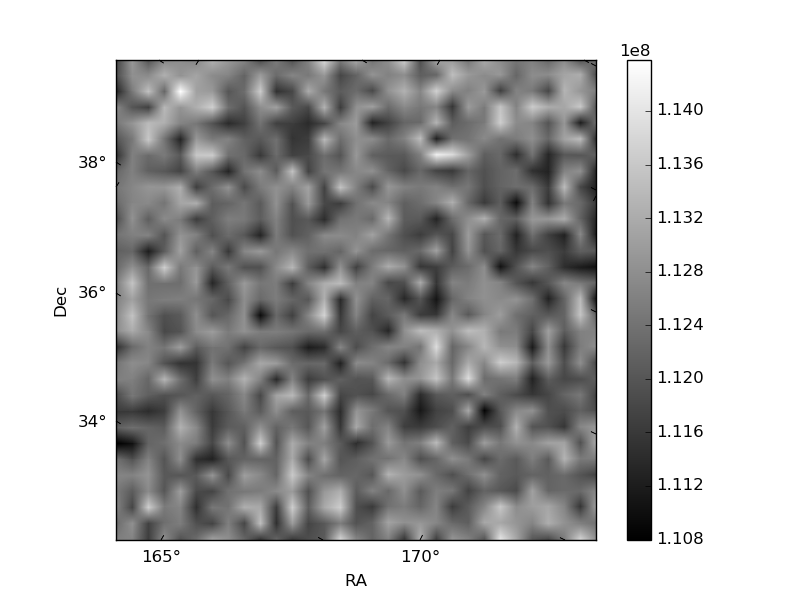
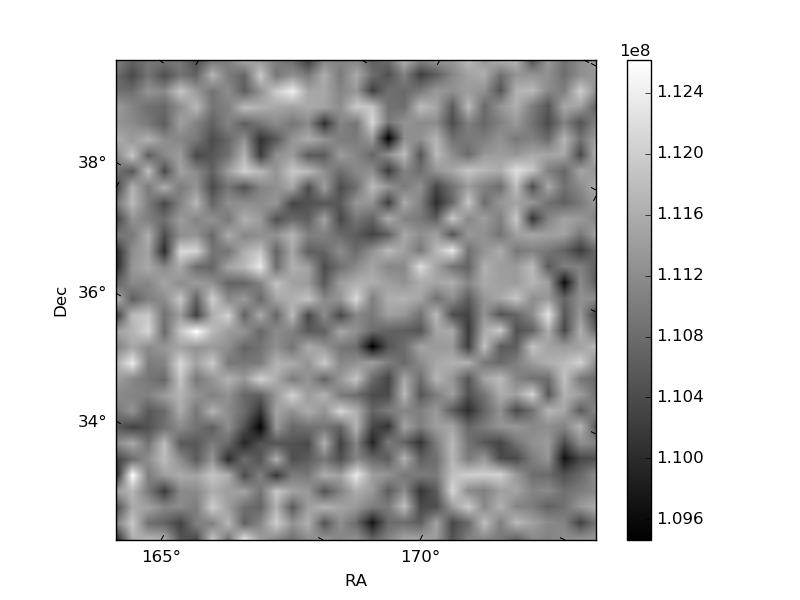
Histogram calculated using DETX and DETY for each event in the final _common_clean file
| Quadrant A | 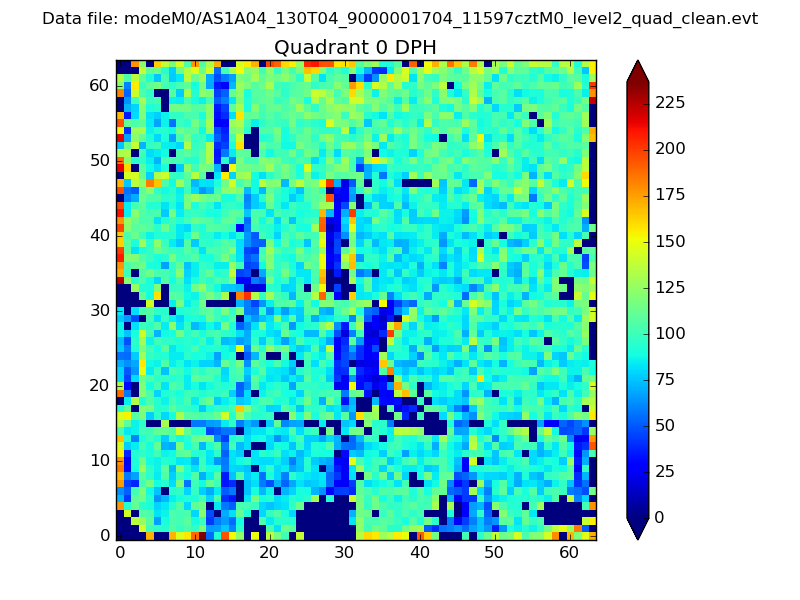 |
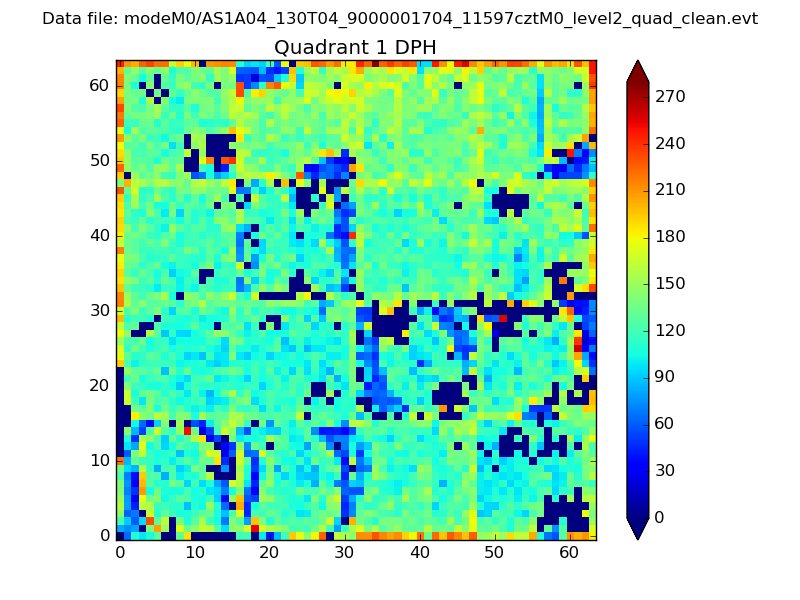 |
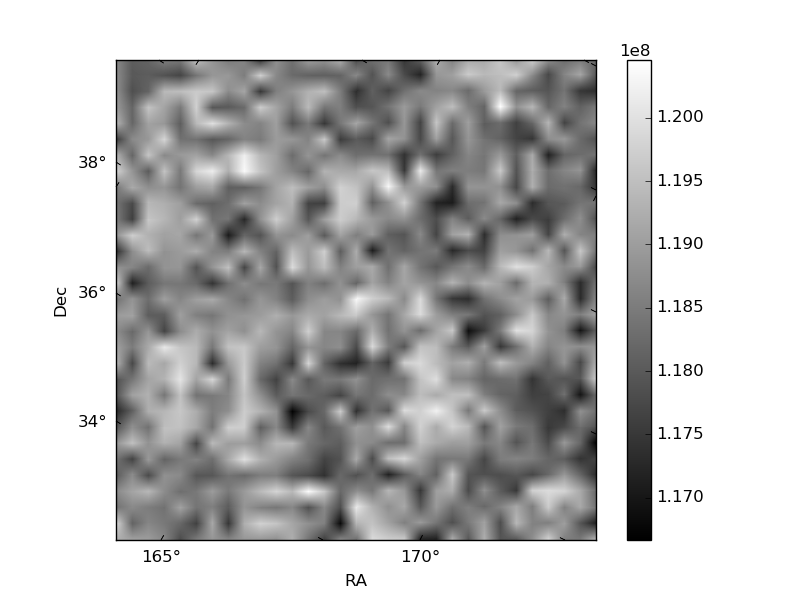
Quadrant B |
|---|---|---|---|
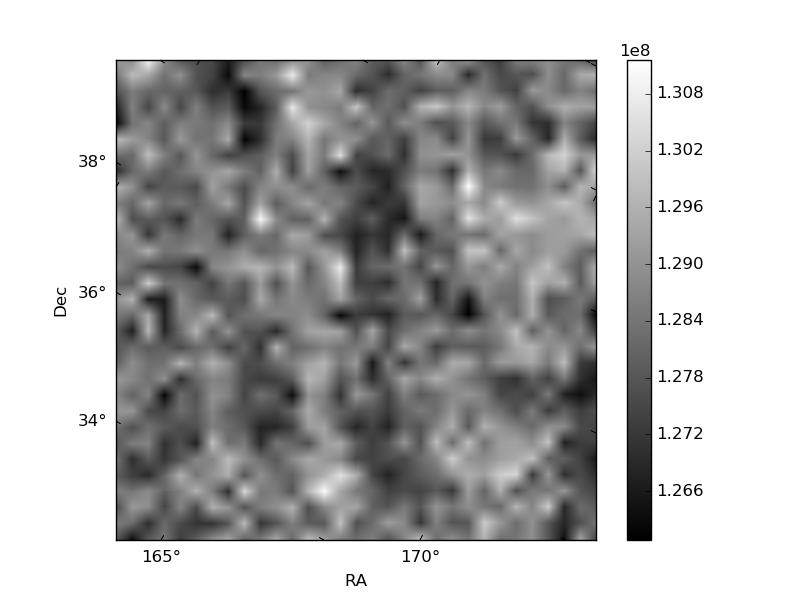
| Quadrant D | 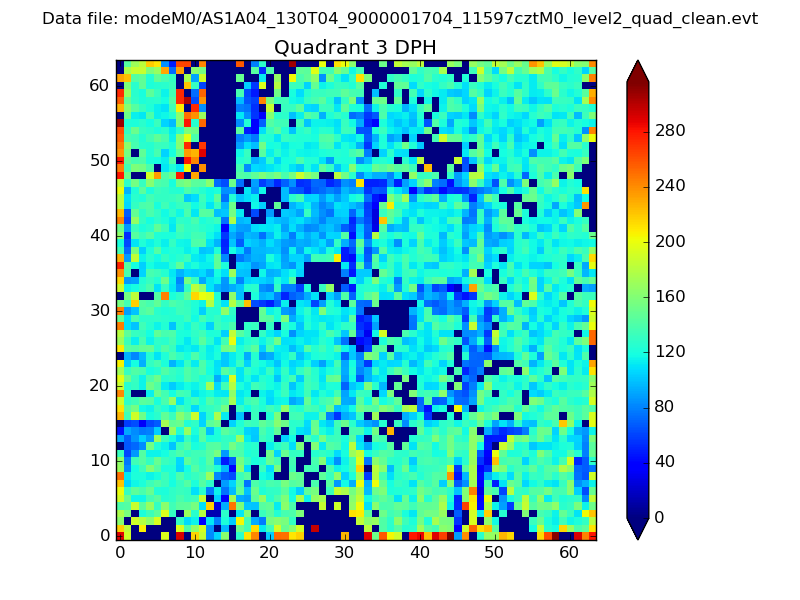 |
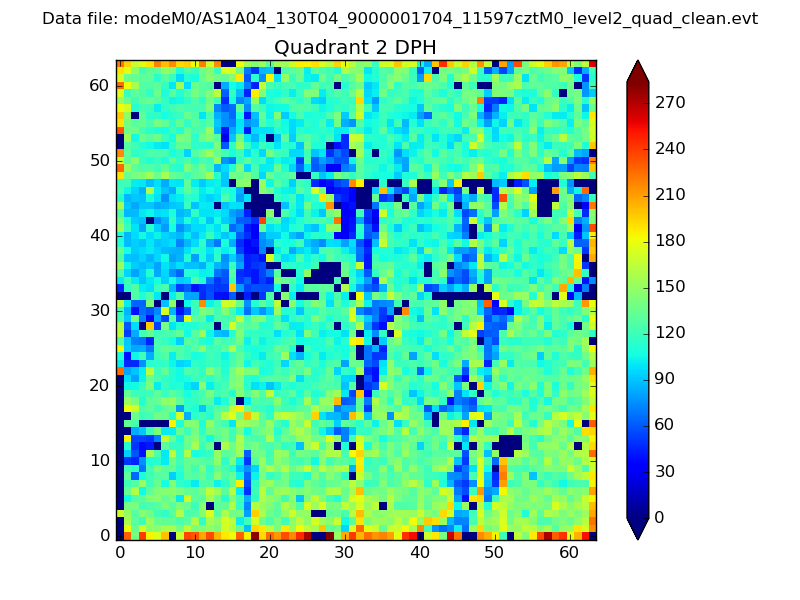 |
Quadrant C |
| Plot type | Count rate plots | Images |
|---|---|---|
| Comparison with Poisson distribution Blue bars denote a histogram of data divided into 1 sec bins. Red curve is a Poisson curve with rate = median count rate of data. |
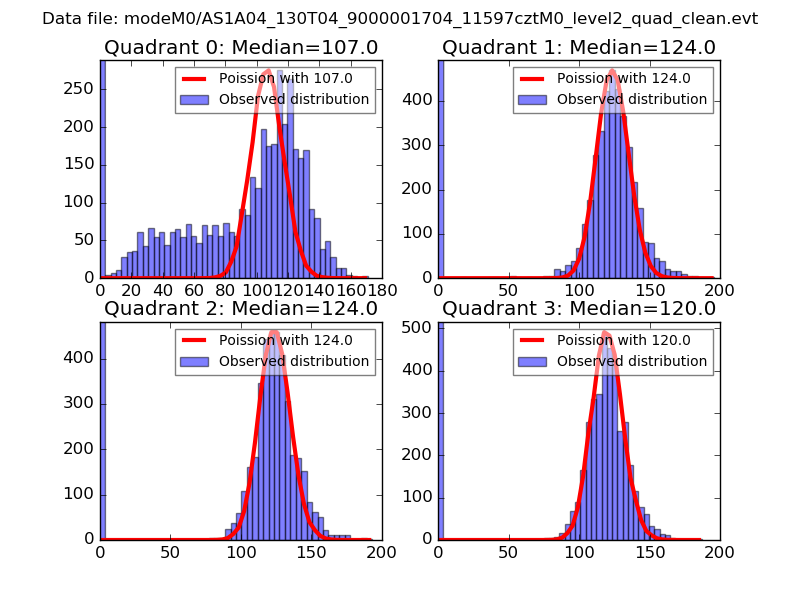 |
 |
| Quadrant-wise count rates Data is divided into 100 sec bins |
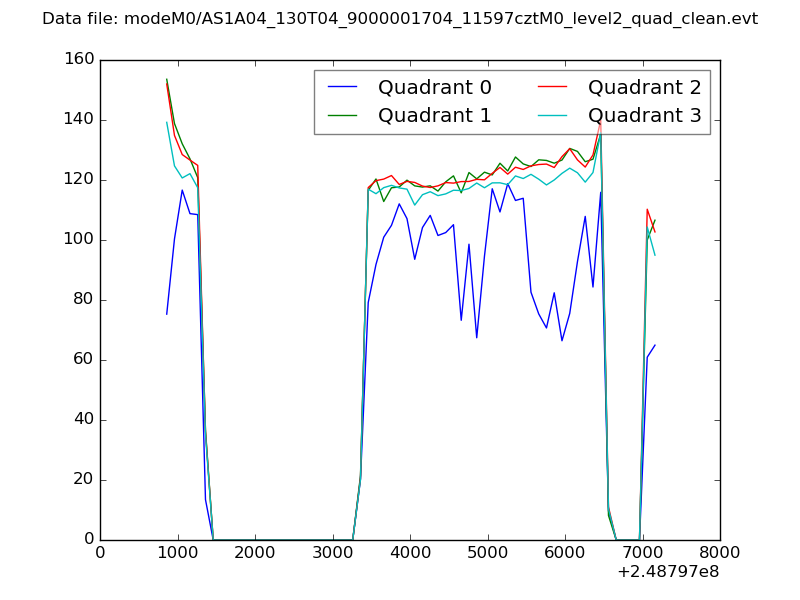 |
|
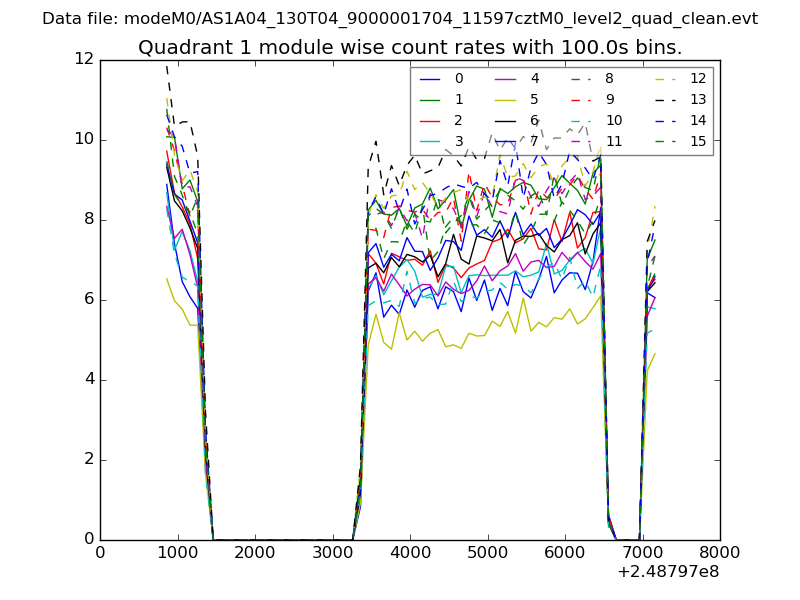
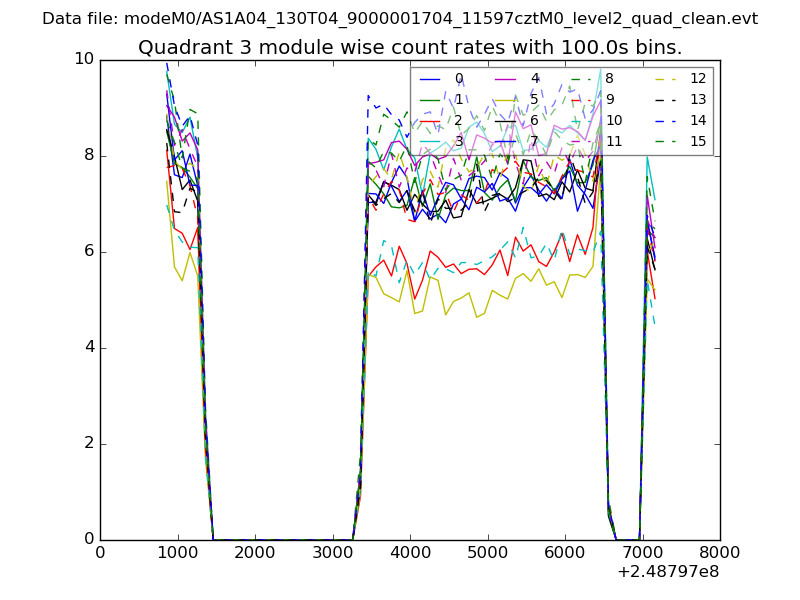
| Module-wise count rates for Quadrant A Data is divided into 100 sec bins |
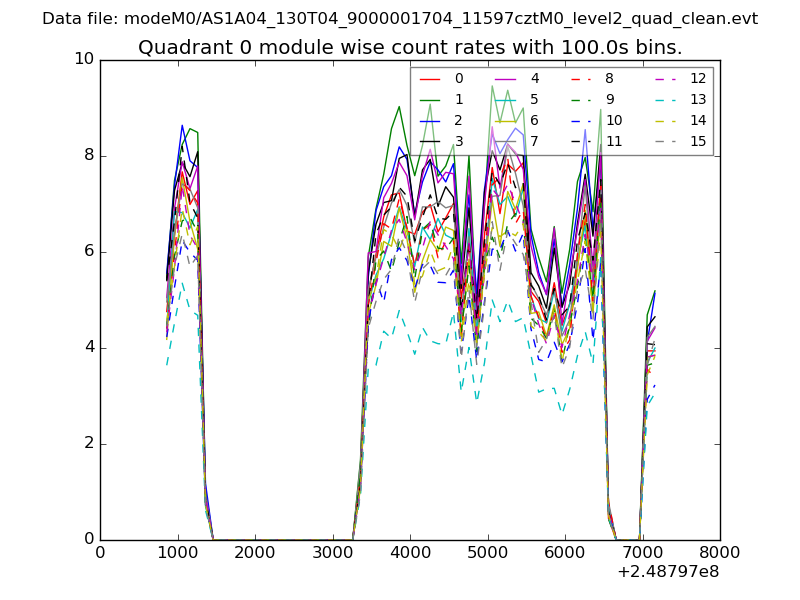 |
 |
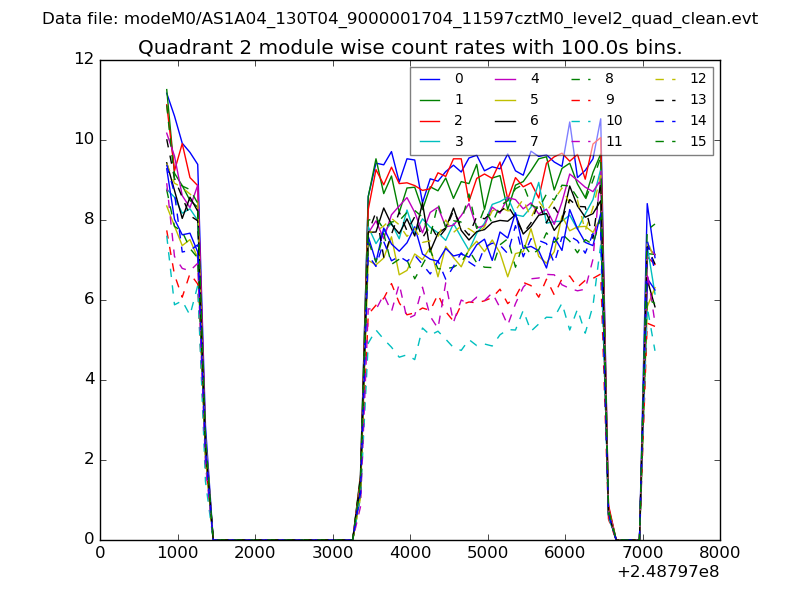
| Module-wise count rates for Quadrant B Data is divided into 100 sec bins |
 |
 |
| Module-wise count rates for Quadrant C Data is divided into 100 sec bins |
 |
 |
| Module-wise count rates for Quadrant D Data is divided into 100 sec bins |
 |
 |
| Parameter | Plot |
|---|---|
| CZT HV Monitor | 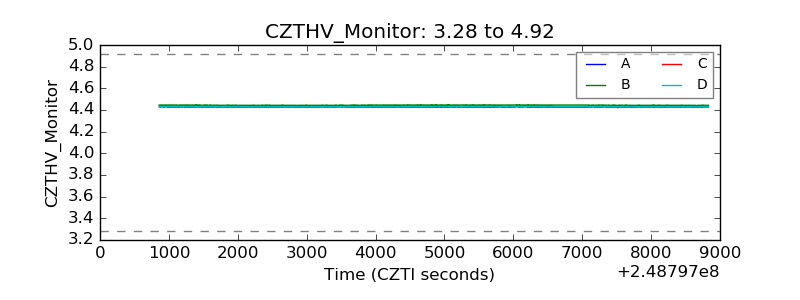 |
| D_VDD | 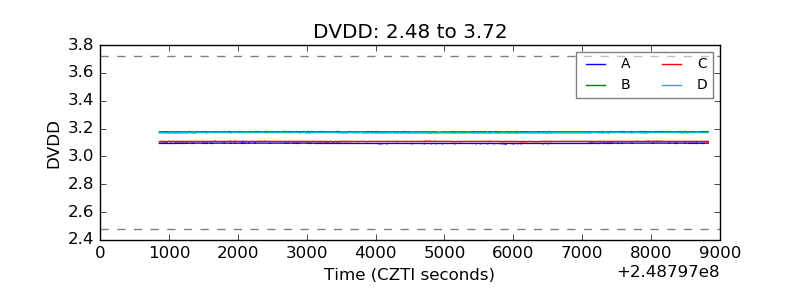 |
| Temperature 1 | 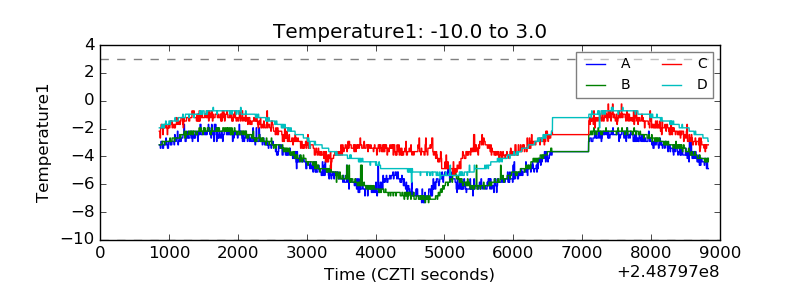 |
| Veto HV Monitor | 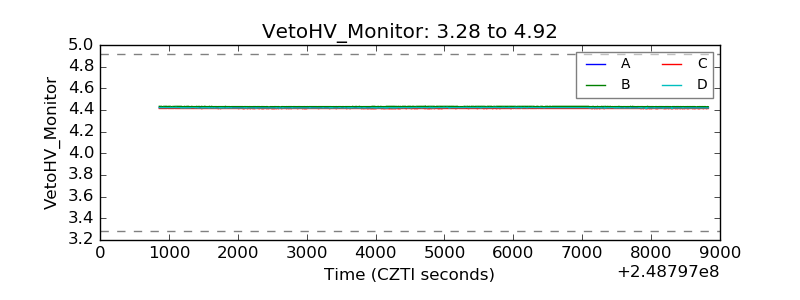 |
| Veto LLD | 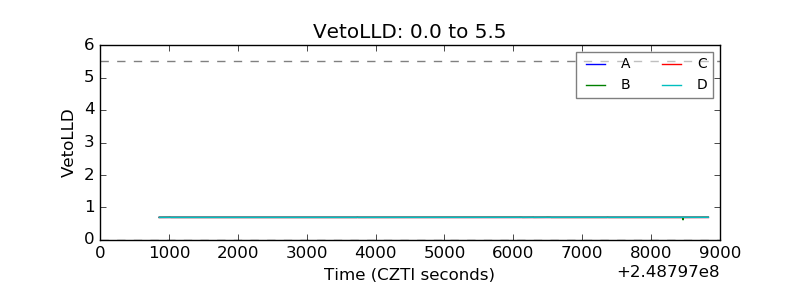 |
| Alpha Counter | 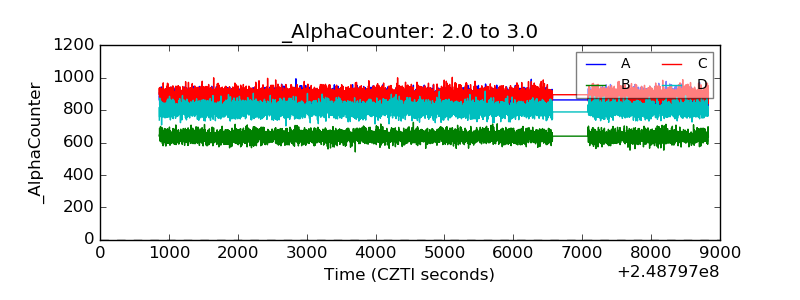 |
| _CPM_Rate | 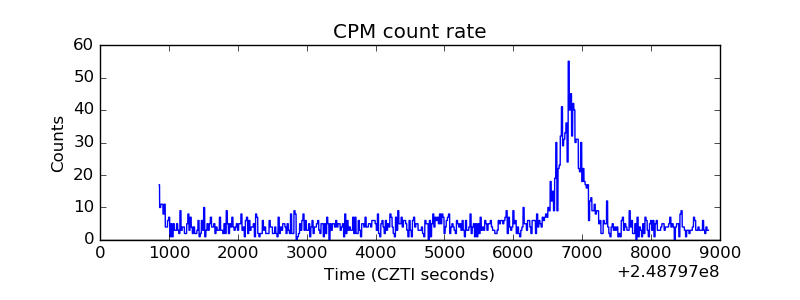 |
| CZT Counter | 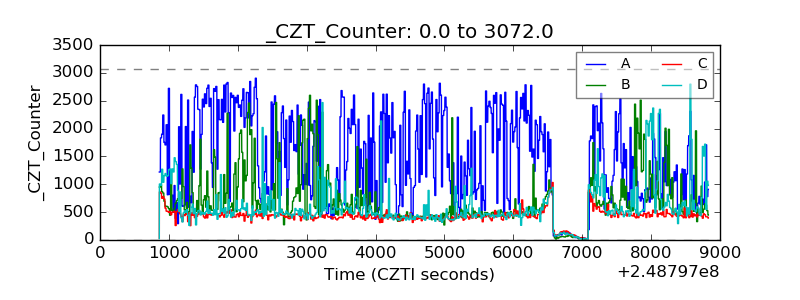 |
| +2.5 Volts monitor |  |
| +5 Volts monitor |  |
| _ROLL_ROT | 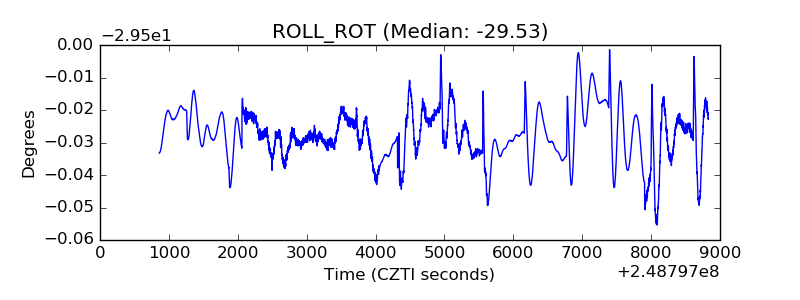 |
| _Roll_DEC | 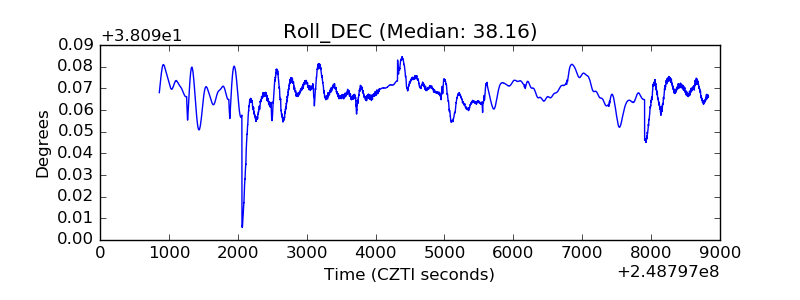 |
| _Roll_RA | 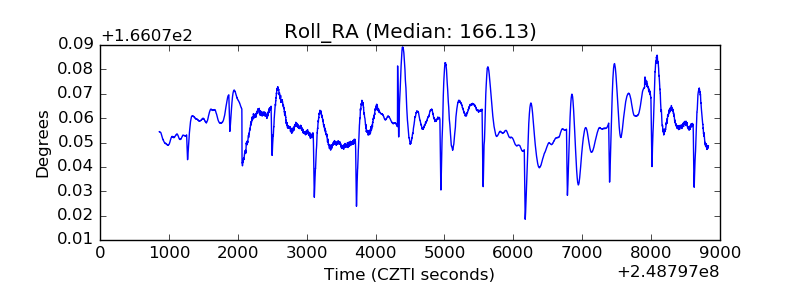 |
| Veto Counter | 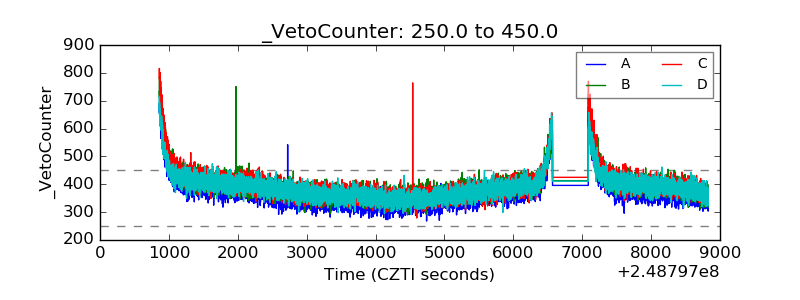 |