| Param | Original file | Final file |
|---|---|---|
| Filename | modeM0/AS1A04_130T04_9000001704_11598cztM0_level2.evt | modeM0/AS1A04_130T04_9000001704_11598cztM0_level2_quad_clean.evt |
| Size (bytes) | 842,040,000 | 75,067,200 |
| Size | 803.0 MB | 71.6 MB |
| Events in quadrant A | 10,891,744 | 381,104 |
| Events in quadrant B | 5,499,369 | 460,226 |
| Events in quadrant C | 3,439,937 | 461,890 |
| Events in quadrant D | 5,157,937 | 441,059 |
| Mode M0 | |||
|---|---|---|---|
| Quadrant | BADHDUFLAG | Total packets | Discarded packets |
| A | 0 | 37665 | 2 |
| B | 0 | 21526 | 1 |
| C | 0 | 15514 | 1 |
| D | 0 | 20631 | 1 |
| Mode SS | |||
|---|---|---|---|
| Quadrant | BADHDUFLAG | Total packets | Discarded packets |
| A | 0 | 154 | 0 |
| B | 0 | 154 | 0 |
| C | 0 | 154 | 0 |
| D | 0 | 154 | 0 |
| Mode M9 | |||
|---|---|---|---|
| Quadrant | BADHDUFLAG | Total packets | Discarded packets |
| A | 0 | 3 | 0 |
| B | 0 | 3 | 0 |
| C | 0 | 3 | 0 |
| D | 0 | 3 | 0 |
| Quadrant | Total seconds | Saturated seconds | Saturation percentage |
|---|---|---|---|
| A | 7587 | 2573 | 33.913273% |
| B | 7587 | 535 | 7.051536% |
| C | 7587 | 47 | 0.619481% |
| D | 7587 | 295 | 3.888230% |
Noise dominated data is calculated using 1-second bins in cleaned event files. If a bin has >2000 counts, and if more than 50% of those come from <1% of pixels, then it is considered to be noise-dominated and hence unusable.
| Quadrant | # 1 sec bins | Bins with >0 counts | Bins with >2000 counts | High rate bins dominated by noise | Noise dominated (total time) | Noise dominated (detector-on time) | Marked lightcurve |
|---|---|---|---|---|---|---|---|
| A | 7873 | 7590 | 1709 | 1709 | 21.71% | 22.52% | 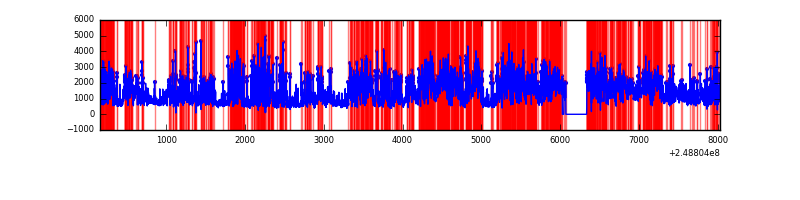 |
| B | 7873 | 7590 | 236 | 236 | 3.00% | 3.11% | 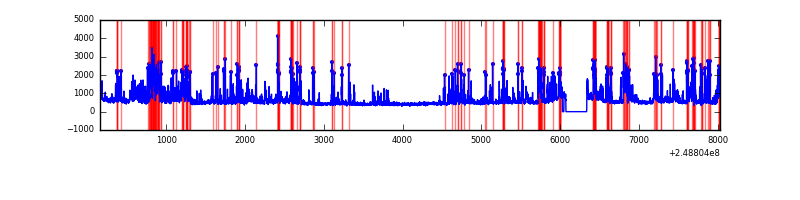 |
| C | 7873 | 7590 | 0 | 0 | 0.00% | 0.00% | 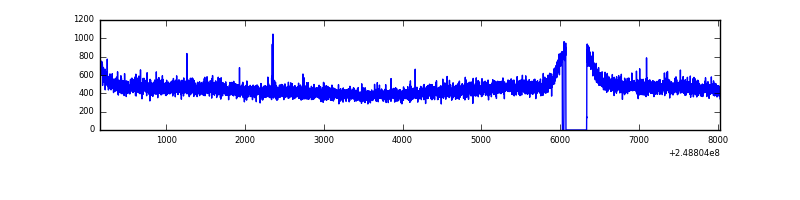 |
| D | 7873 | 7590 | 159 | 159 | 2.02% | 2.09% | 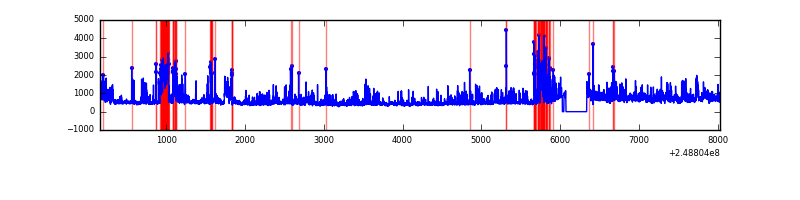 |
Top three noisy pixels from each quadrant. If the there are fewer than three noisy pixels in the level2.evt file, extra rows are filled as -1
| Pixel properties | Quadrant properties | ||||||
|---|---|---|---|---|---|---|---|
| Quadrant | DetID | PixID | Counts | Sigma | Mean | Median | Sigma |
| A | 8 | 5 | 7160079 | 44231.58 | 791 | 772 | 161.9 |
| A | 1 | 162 | 245366 | 1511.15 | 791 | 772 | 161.9 |
| A | 1 | 178 | 145242 | 892.56 | 791 | 772 | 161.9 |
| B | 4 | 239 | 1303200 | 7624.73 | 886 | 865 | 170.8 |
| B | 3 | 64 | 330428 | 1929.48 | 886 | 865 | 170.8 |
| B | 4 | 81 | 169712 | 988.54 | 886 | 865 | 170.8 |
| C | 13 | 61 | 6370 | 26.69 | 880 | 883 | 205.6 |
| C | 9 | 54 | 5800 | 23.92 | 880 | 883 | 205.6 |
| C | 14 | 67 | 2879 | 9.71 | 880 | 883 | 205.6 |
| D | 1 | 52 | 977279 | 4674.87 | 871 | 845 | 208.9 |
| D | 5 | 222 | 248511 | 1185.75 | 871 | 845 | 208.9 |
| D | 13 | 104 | 233542 | 1114.08 | 871 | 845 | 208.9 |
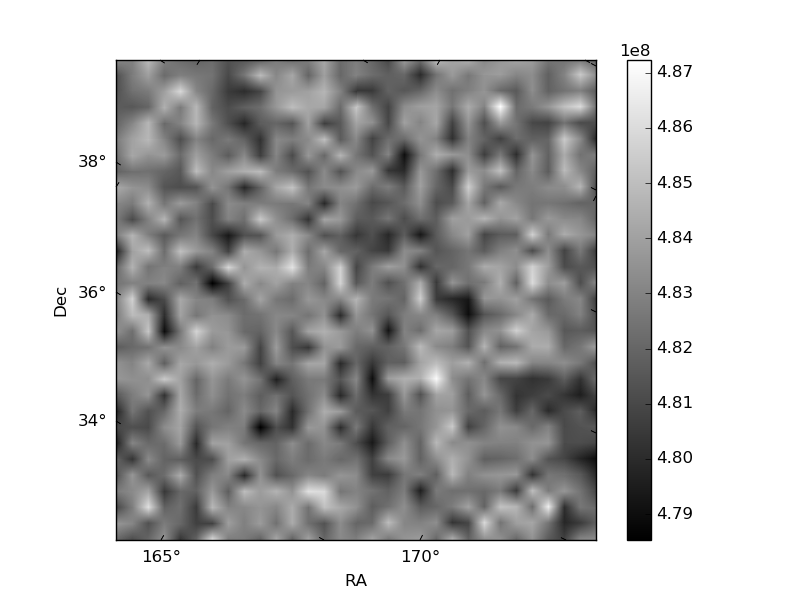
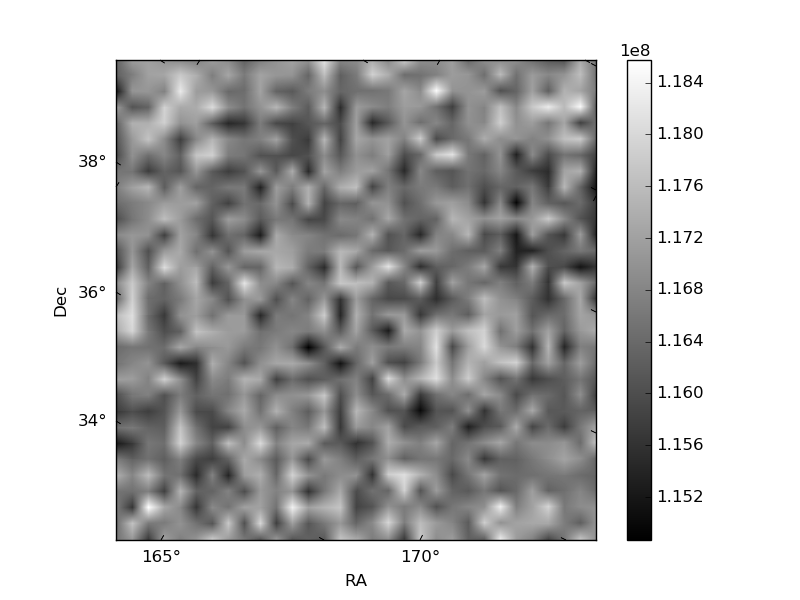
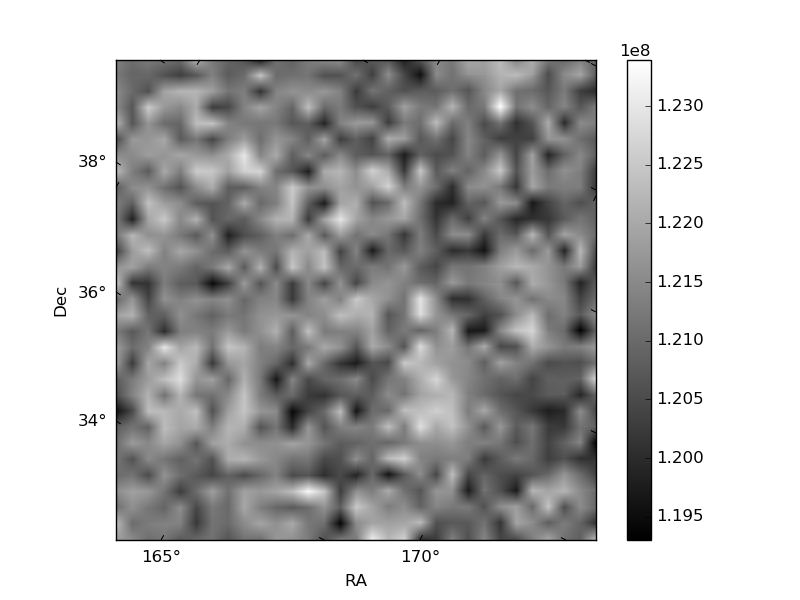
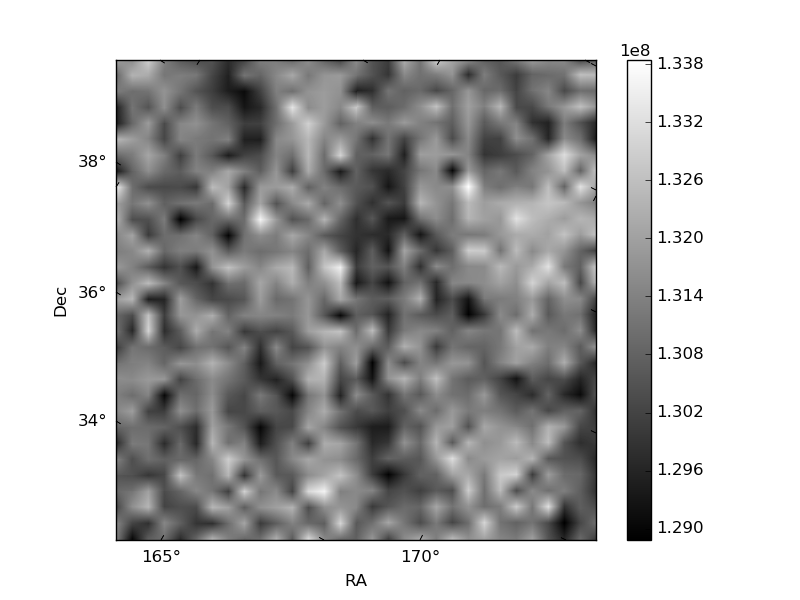
Histogram calculated using DETX and DETY for each event in the final _common_clean file
| Quadrant A | 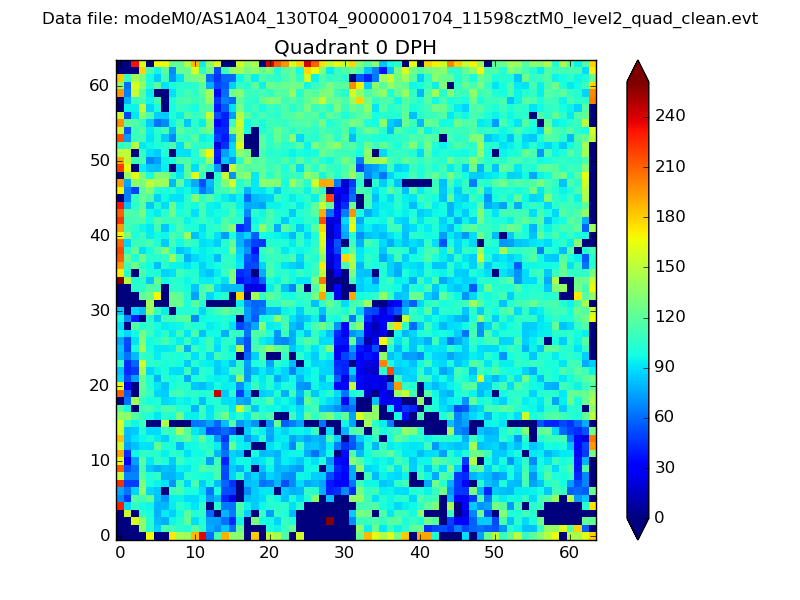 |
 |
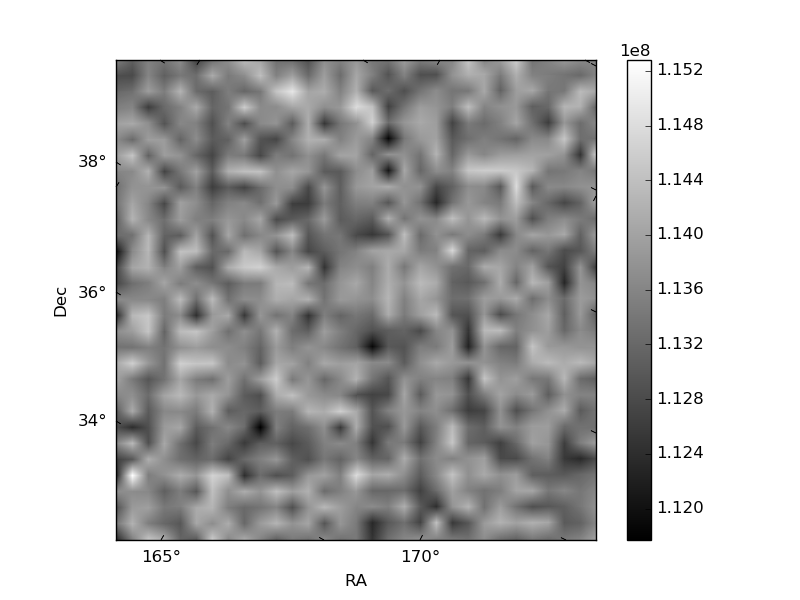
Quadrant B |
|---|---|---|---|
| Quadrant D | 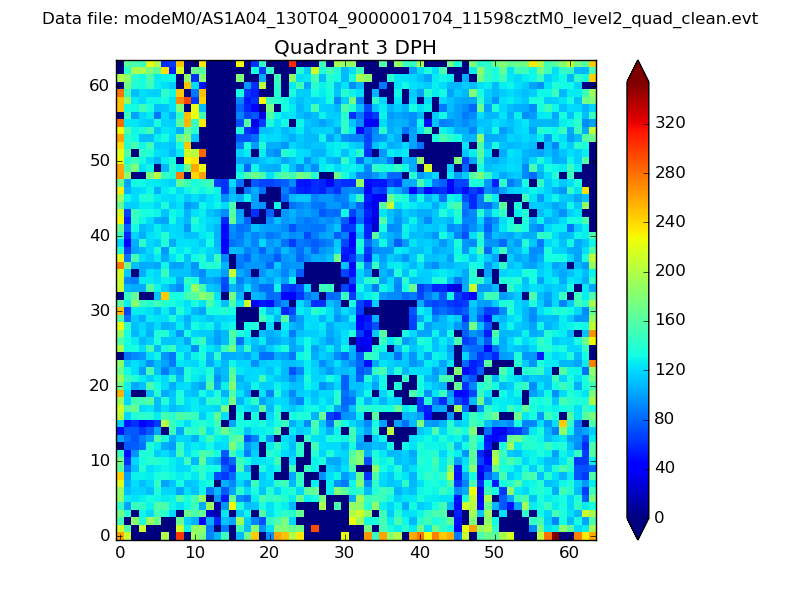 |
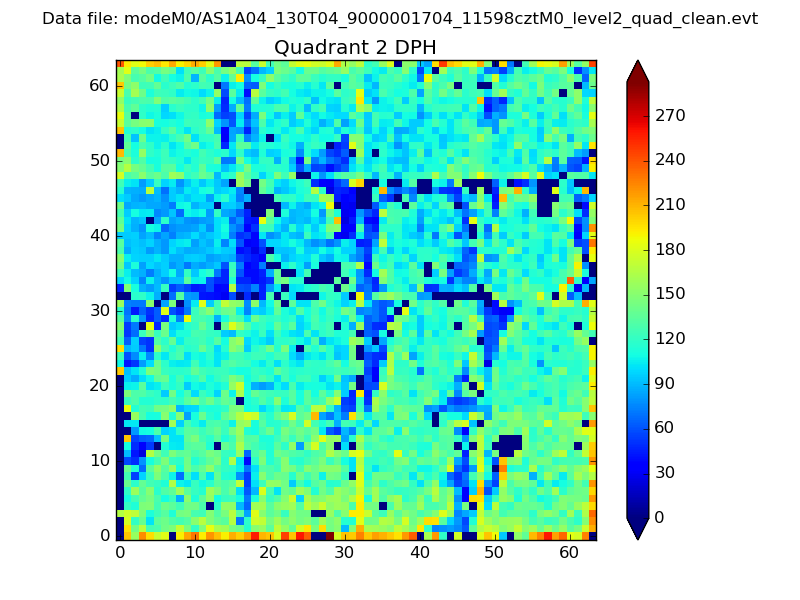 |
Quadrant C |
| Plot type | Count rate plots | Images |
|---|---|---|
| Comparison with Poisson distribution Blue bars denote a histogram of data divided into 1 sec bins. Red curve is a Poisson curve with rate = median count rate of data. |
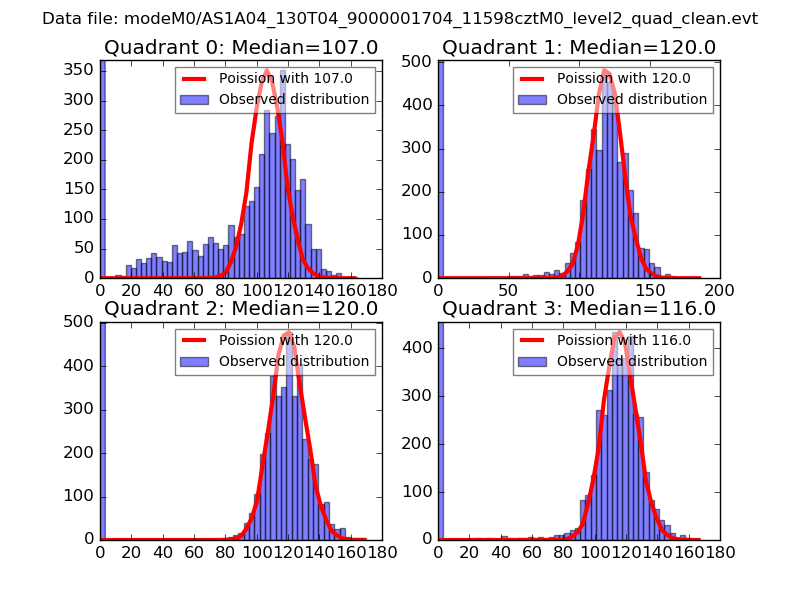 |
 |
| Quadrant-wise count rates Data is divided into 100 sec bins |
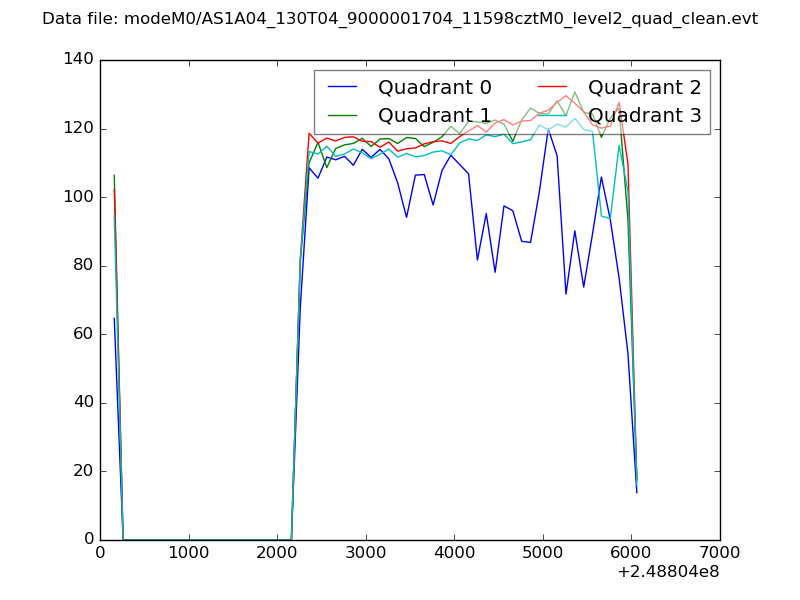 |
|
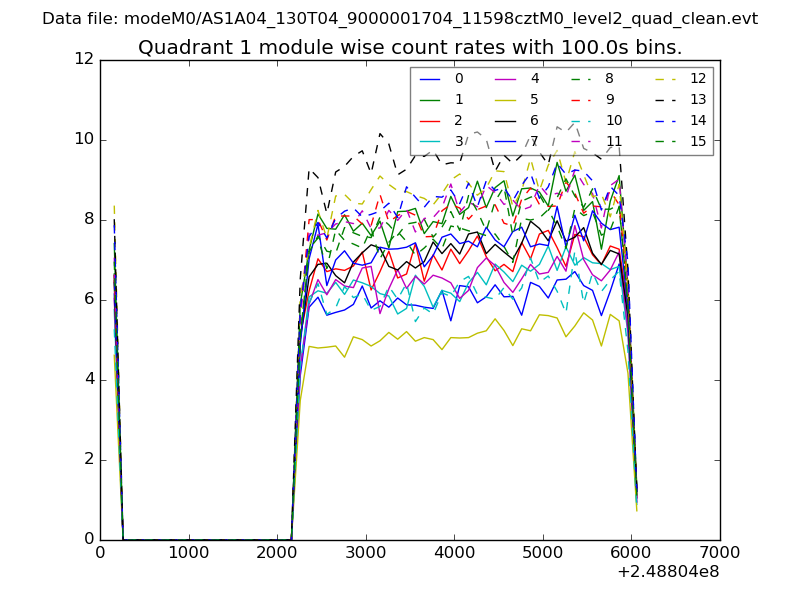
| Module-wise count rates for Quadrant A Data is divided into 100 sec bins |
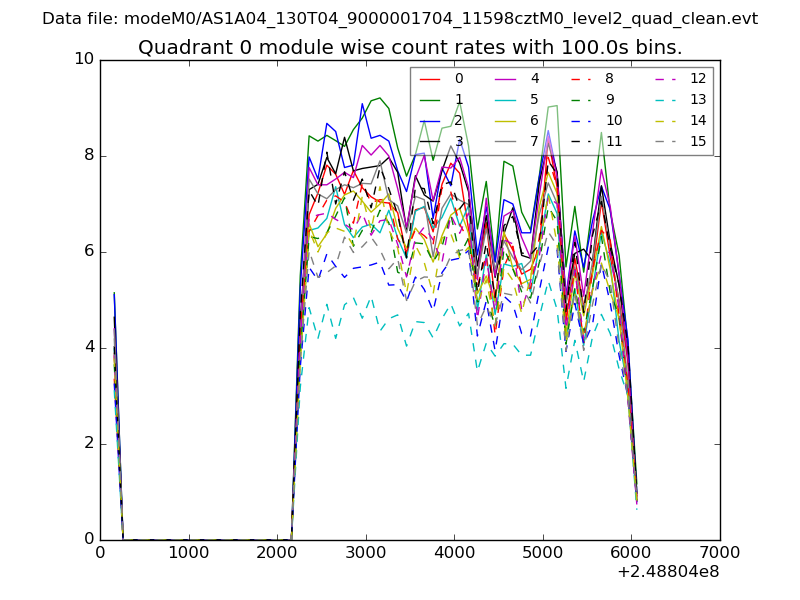 |
 |
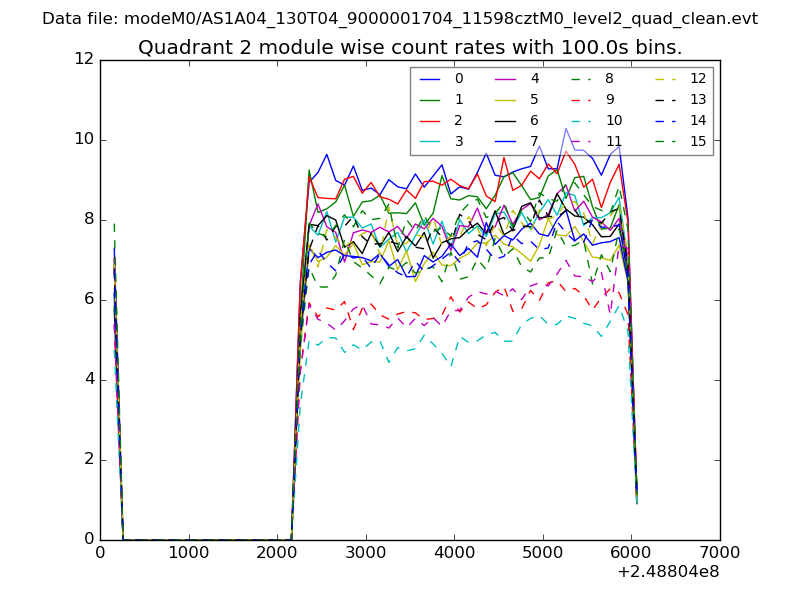
| Module-wise count rates for Quadrant B Data is divided into 100 sec bins |
 |
 |
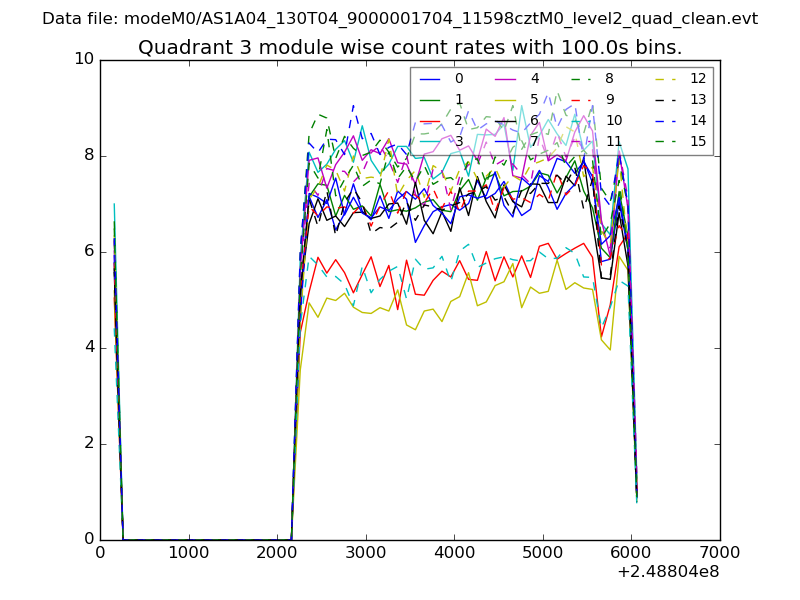
| Module-wise count rates for Quadrant C Data is divided into 100 sec bins |
 |
 |
| Module-wise count rates for Quadrant D Data is divided into 100 sec bins |
 |
 |
| Parameter | Plot |
|---|---|
| CZT HV Monitor | 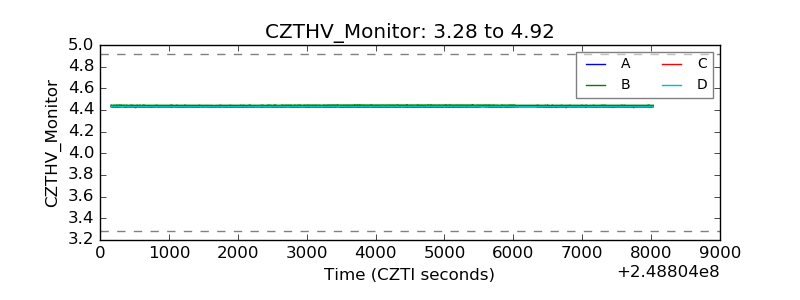 |
| D_VDD | 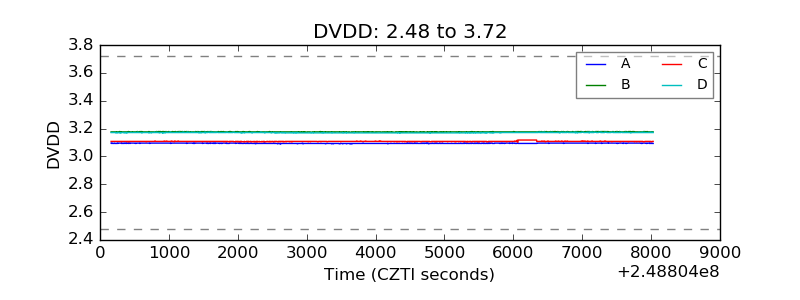 |
| Temperature 1 | 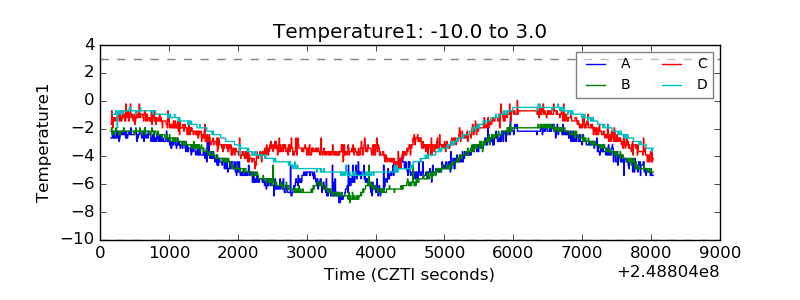 |
| Veto HV Monitor | 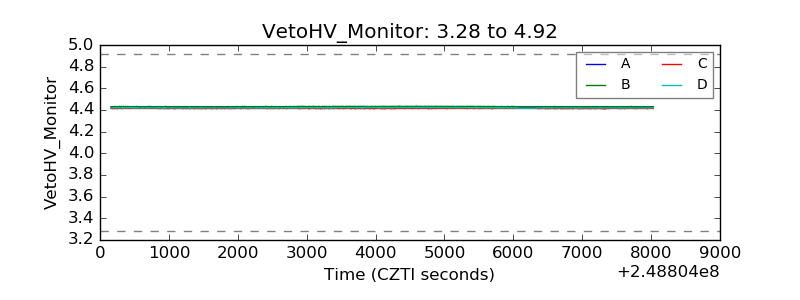 |
| Veto LLD |  |
| Alpha Counter | 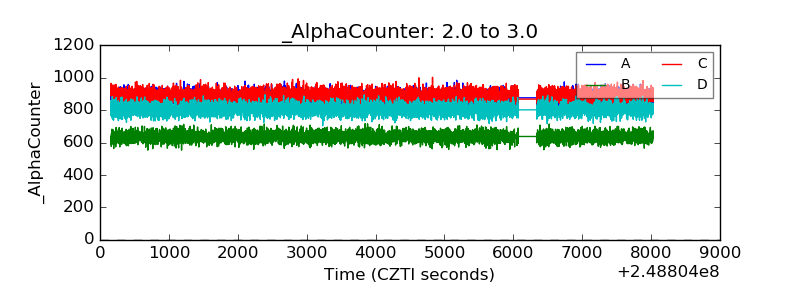 |
| _CPM_Rate | 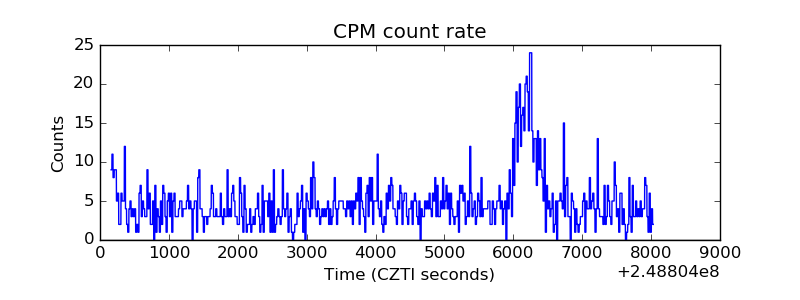 |
| CZT Counter | 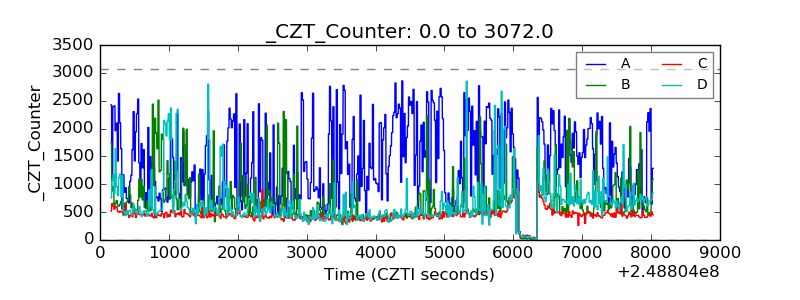 |
| +2.5 Volts monitor |  |
| +5 Volts monitor |  |
| _ROLL_ROT | 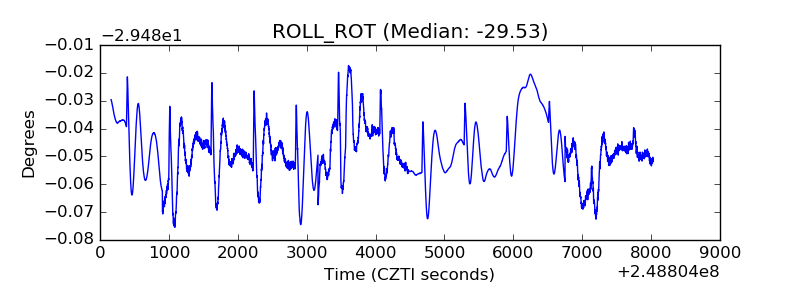 |
| _Roll_DEC | 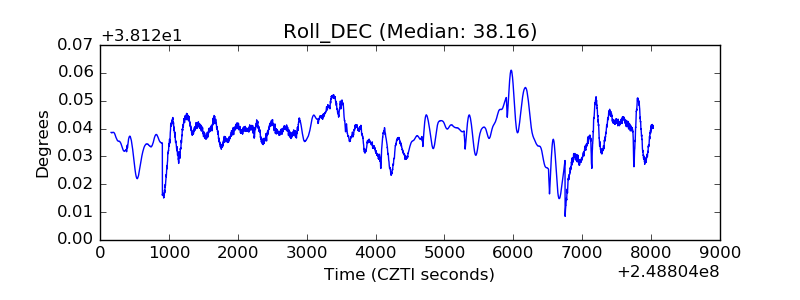 |
| _Roll_RA | 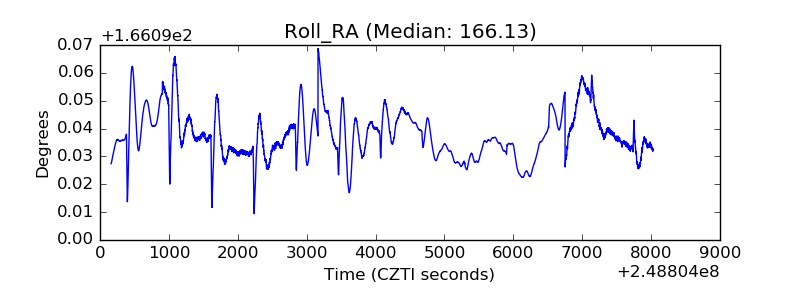 |
| Veto Counter | 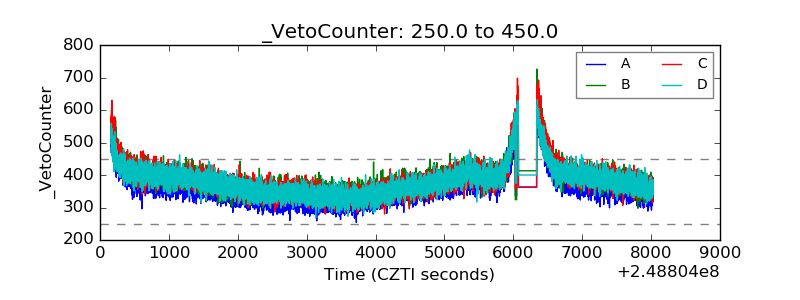 |