| Param | Original file | Final file |
|---|---|---|
| Filename | modeM0/AS1A04_130T04_9000001704_11599cztM0_level2.evt | modeM0/AS1A04_130T04_9000001704_11599cztM0_level2_quad_clean.evt |
| Size (bytes) | 771,071,040 | 76,991,040 |
| Size | 735.4 MB | 73.4 MB |
| Events in quadrant A | 9,899,199 | 430,113 |
| Events in quadrant B | 4,988,115 | 473,959 |
| Events in quadrant C | 3,192,825 | 472,429 |
| Events in quadrant D | 4,790,025 | 457,357 |
| Mode M0 | |||
|---|---|---|---|
| Quadrant | BADHDUFLAG | Total packets | Discarded packets |
| A | 0 | 34490 | 2 |
| B | 0 | 19766 | 1 |
| C | 0 | 14505 | 1 |
| D | 0 | 19127 | 1 |
| Mode SS | |||
|---|---|---|---|
| Quadrant | BADHDUFLAG | Total packets | Discarded packets |
| A | 0 | 146 | 0 |
| B | 0 | 146 | 0 |
| C | 0 | 146 | 0 |
| D | 0 | 146 | 0 |
| Mode M9 | |||
|---|---|---|---|
| Quadrant | BADHDUFLAG | Total packets | Discarded packets |
| A | 0 | 3 | 0 |
| B | 0 | 3 | 0 |
| C | 0 | 3 | 0 |
| D | 0 | 3 | 0 |
| Quadrant | Total seconds | Saturated seconds | Saturation percentage |
|---|---|---|---|
| A | 7132 | 1784 | 25.014021% |
| B | 7132 | 462 | 6.477846% |
| C | 7132 | 27 | 0.378575% |
| D | 7132 | 191 | 2.678071% |
Noise dominated data is calculated using 1-second bins in cleaned event files. If a bin has >2000 counts, and if more than 50% of those come from <1% of pixels, then it is considered to be noise-dominated and hence unusable.
| Quadrant | # 1 sec bins | Bins with >0 counts | Bins with >2000 counts | High rate bins dominated by noise | Noise dominated (total time) | Noise dominated (detector-on time) | Marked lightcurve |
|---|---|---|---|---|---|---|---|
| A | 7478 | 7134 | 1050 | 1050 | 14.04% | 14.72% | 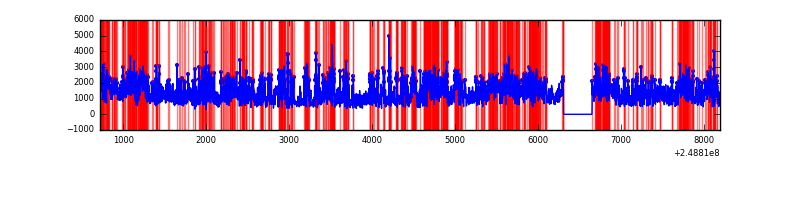 |
| B | 7478 | 7134 | 223 | 223 | 2.98% | 3.13% |  |
| C | 7478 | 7134 | 0 | 0 | 0.00% | 0.00% | 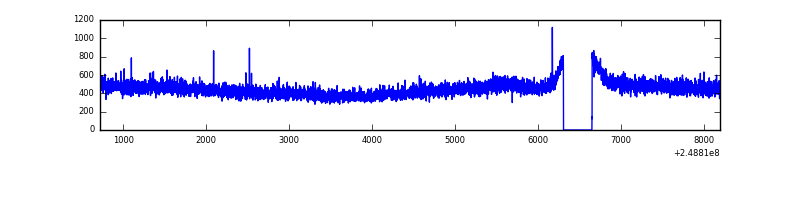 |
| D | 7478 | 7134 | 66 | 66 | 0.88% | 0.93% |  |
Top three noisy pixels from each quadrant. If the there are fewer than three noisy pixels in the level2.evt file, extra rows are filled as -1
| Pixel properties | Quadrant properties | ||||||
|---|---|---|---|---|---|---|---|
| Quadrant | DetID | PixID | Counts | Sigma | Mean | Median | Sigma |
| A | 8 | 5 | 6321131 | 39393.05 | 778 | 760 | 160.4 |
| A | 1 | 162 | 200923 | 1247.56 | 778 | 760 | 160.4 |
| A | 1 | 178 | 117584 | 728.13 | 778 | 760 | 160.4 |
| B | 4 | 239 | 1235323 | 7770.99 | 823 | 802 | 158.9 |
| B | 3 | 64 | 176938 | 1108.73 | 823 | 802 | 158.9 |
| B | 10 | 16 | 145180 | 908.82 | 823 | 802 | 158.9 |
| C | 13 | 61 | 6014 | 27.44 | 815 | 819 | 189.3 |
| C | 8 | 128 | 3642 | 14.91 | 815 | 819 | 189.3 |
| C | 9 | 54 | 3288 | 13.04 | 815 | 819 | 189.3 |
| D | 1 | 52 | 477109 | 2424.84 | 812 | 788 | 196.4 |
| D | 5 | 222 | 316063 | 1604.99 | 812 | 788 | 196.4 |
| D | 8 | 195 | 302144 | 1534.14 | 812 | 788 | 196.4 |
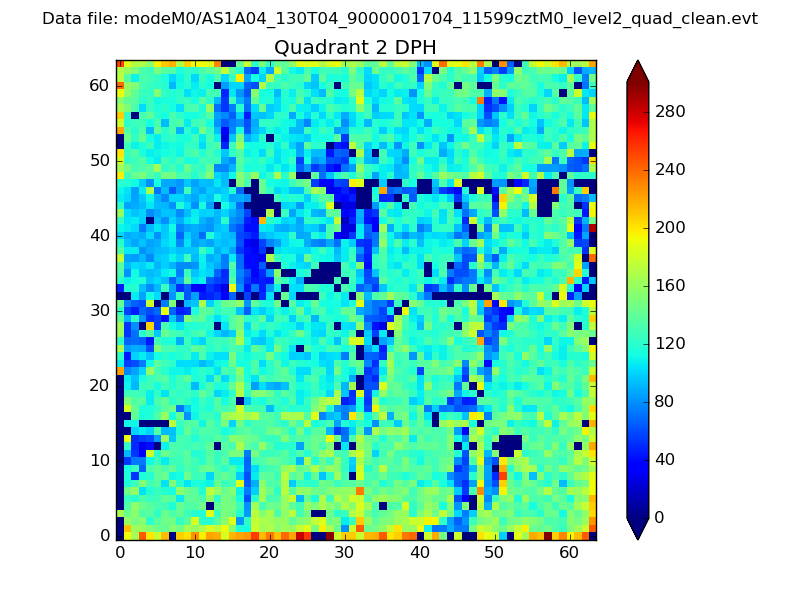
Histogram calculated using DETX and DETY for each event in the final _common_clean file
| Quadrant A | 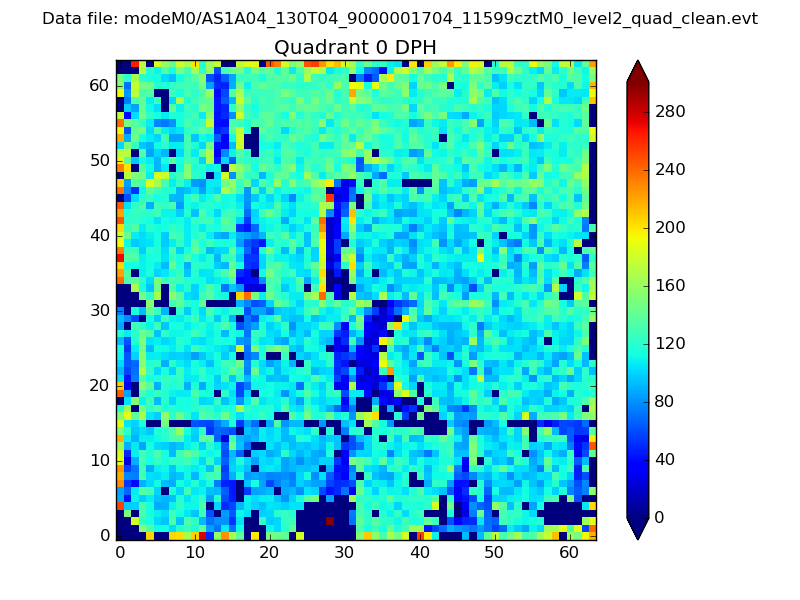 |
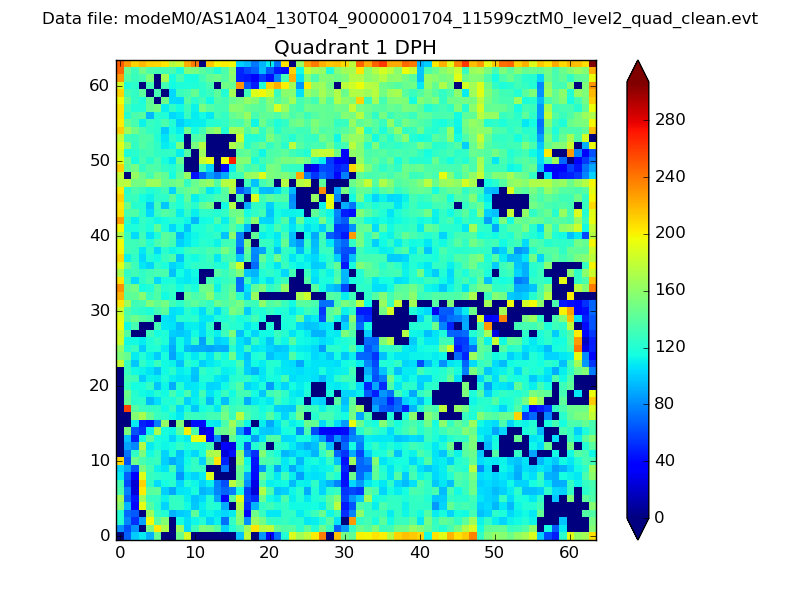 |
Quadrant B |
|---|---|---|---|
| Quadrant D | 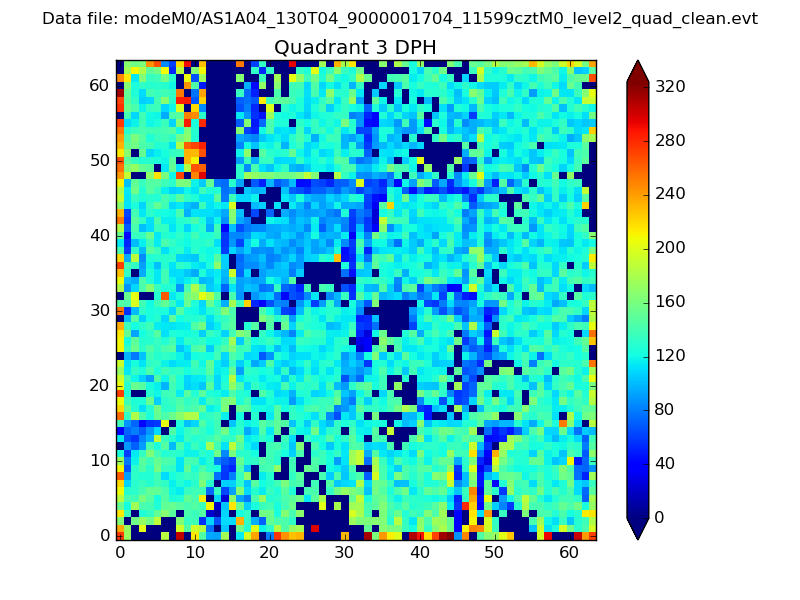 |
 |
Quadrant C |
| Plot type | Count rate plots | Images |
|---|---|---|
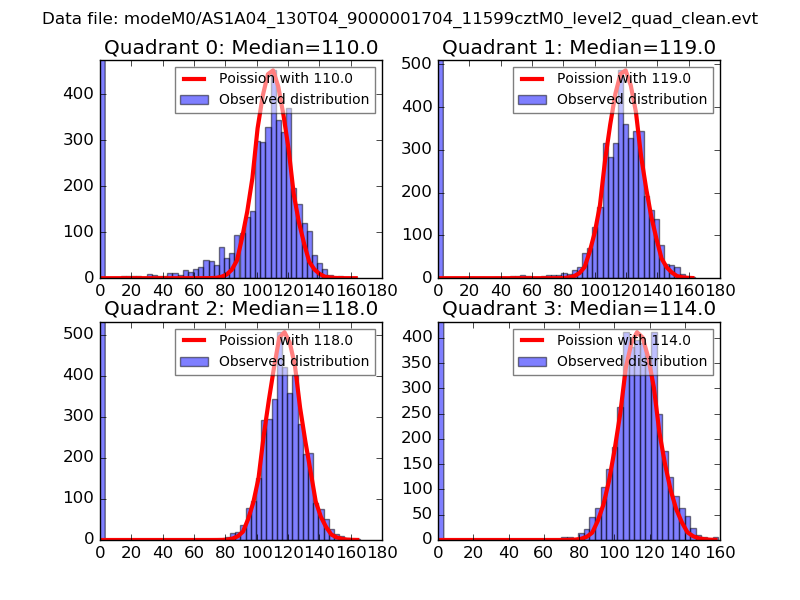
| Comparison with Poisson distribution Blue bars denote a histogram of data divided into 1 sec bins. Red curve is a Poisson curve with rate = median count rate of data. |
 |
 |
| Quadrant-wise count rates Data is divided into 100 sec bins |
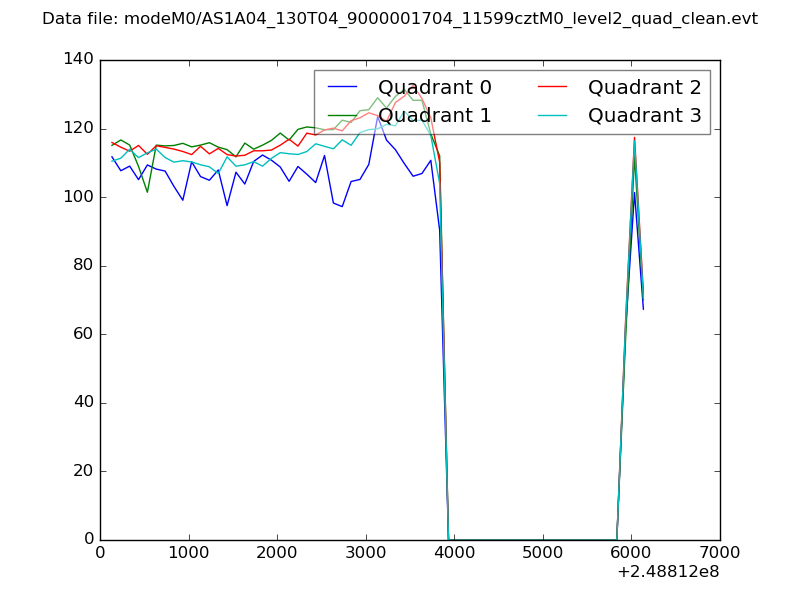 |
|
| Module-wise count rates for Quadrant A Data is divided into 100 sec bins |
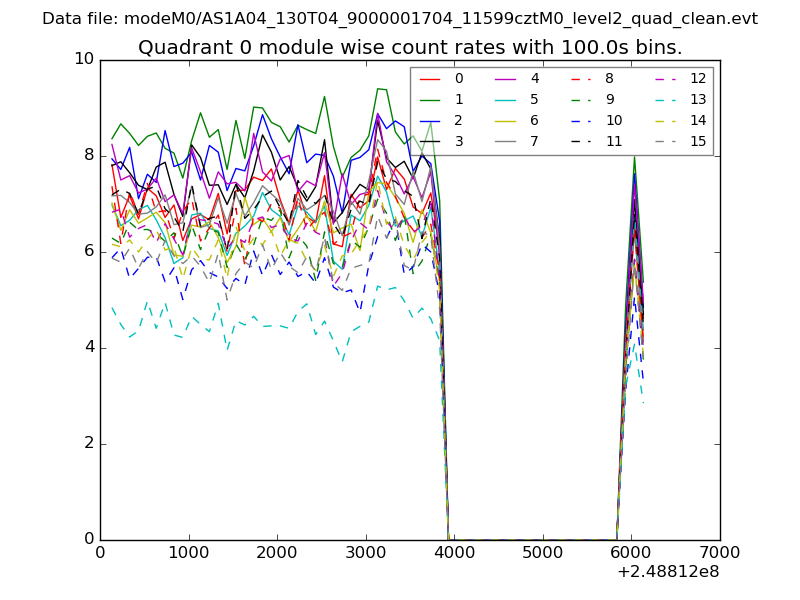 |
 |
| Module-wise count rates for Quadrant B Data is divided into 100 sec bins |
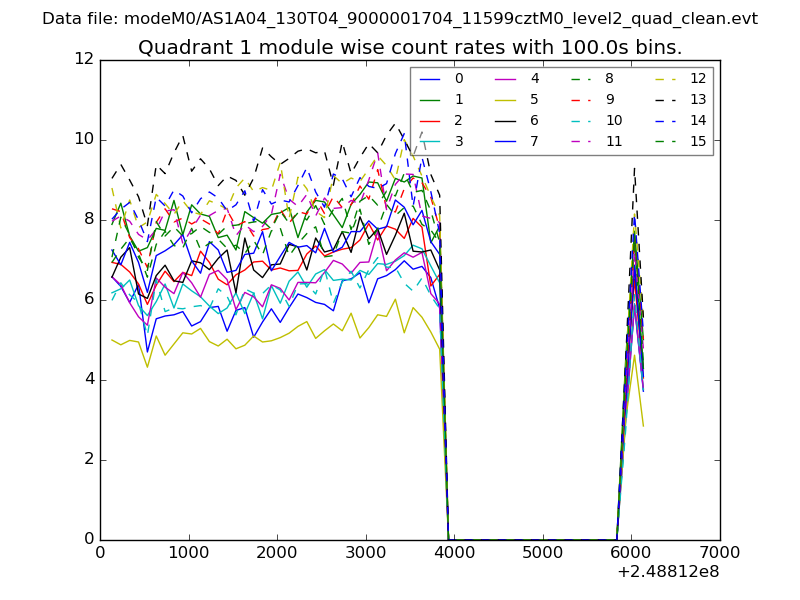 |
 |
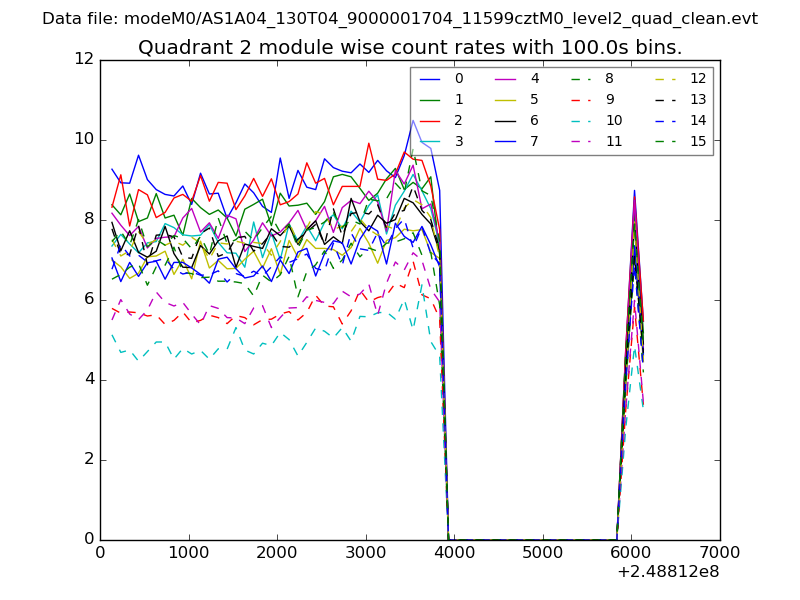
| Module-wise count rates for Quadrant C Data is divided into 100 sec bins |
 |
 |
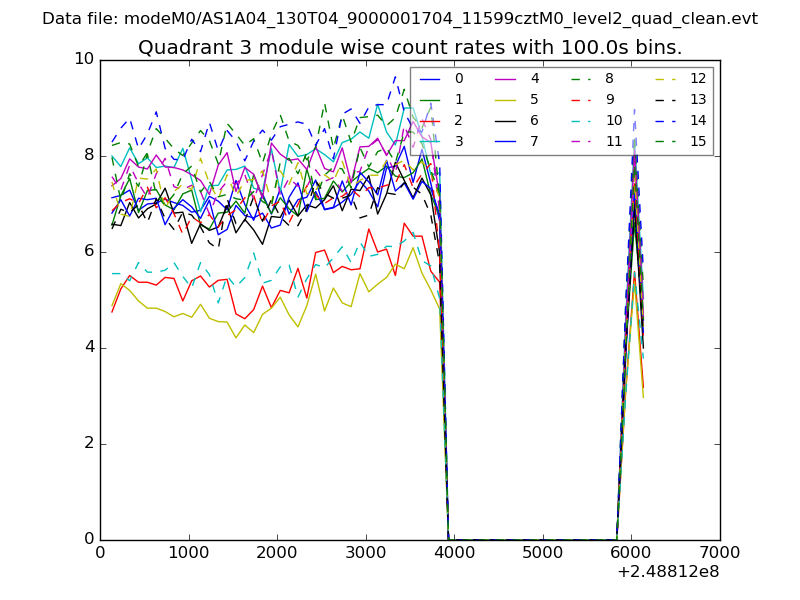
| Module-wise count rates for Quadrant D Data is divided into 100 sec bins |
 |
 |
| Parameter | Plot |
|---|---|
| CZT HV Monitor | 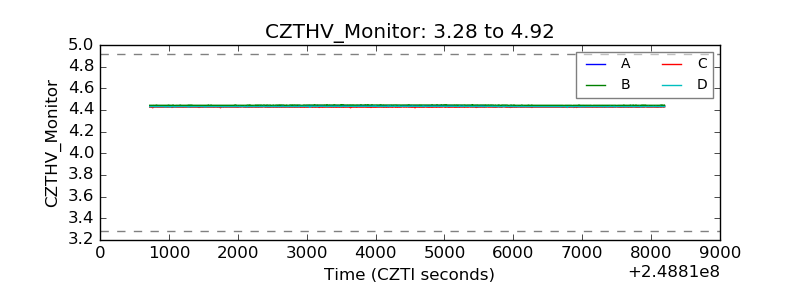 |
| D_VDD | 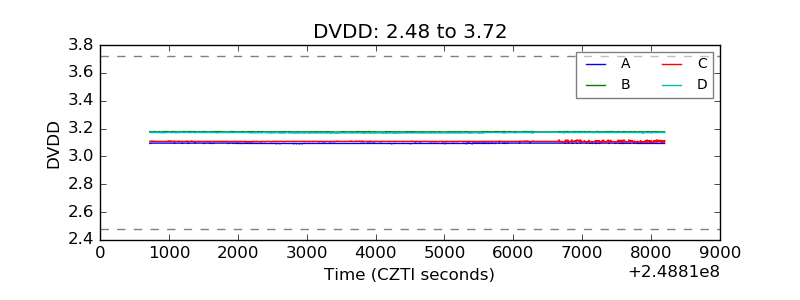 |
| Temperature 1 | 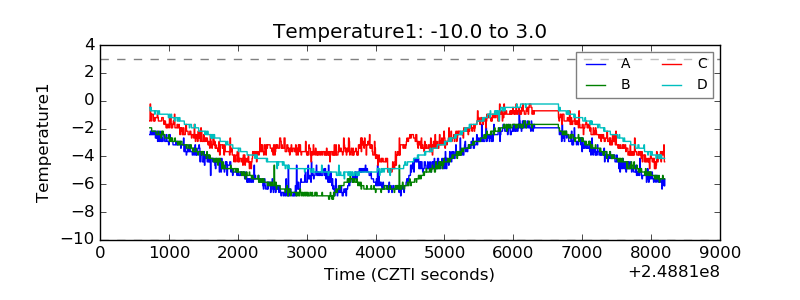 |
| Veto HV Monitor | 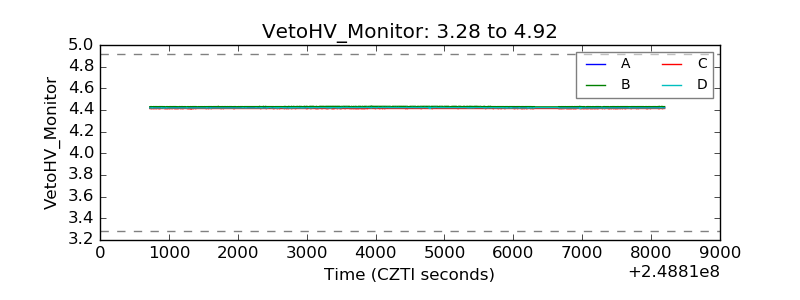 |
| Veto LLD | 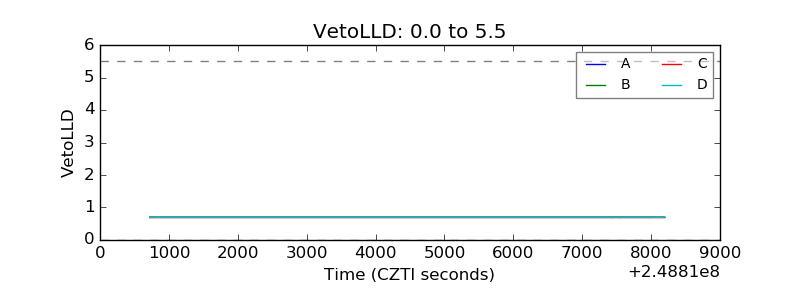 |
| Alpha Counter | 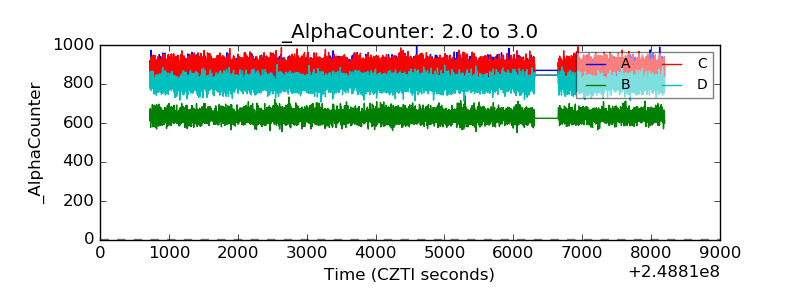 |
| _CPM_Rate | 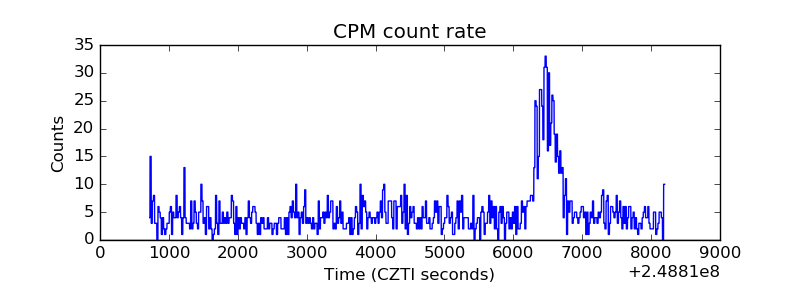 |
| CZT Counter | 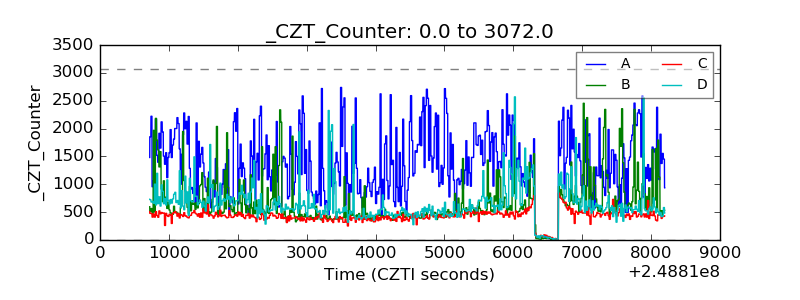 |
| +2.5 Volts monitor |  |
| +5 Volts monitor | 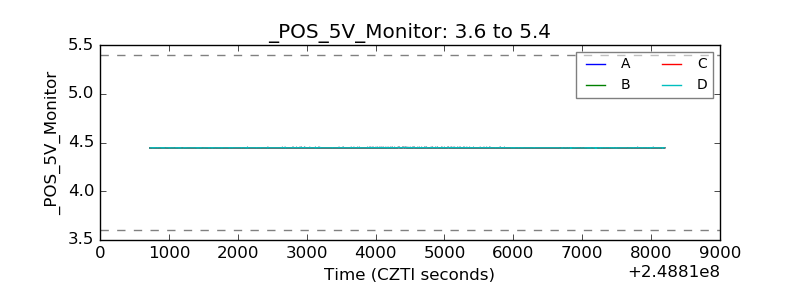 |
| _ROLL_ROT | 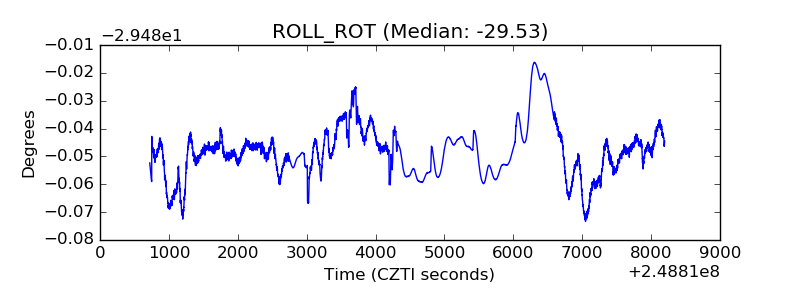 |
| _Roll_DEC | 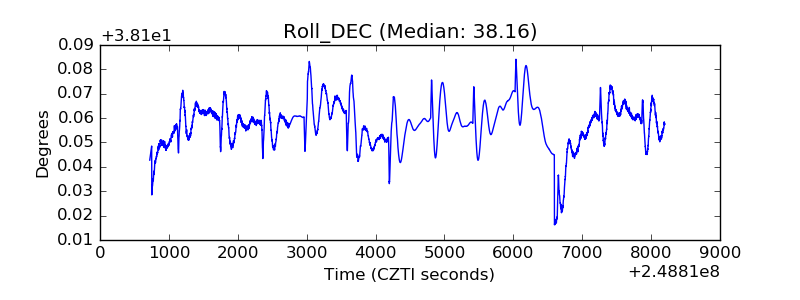 |
| _Roll_RA | 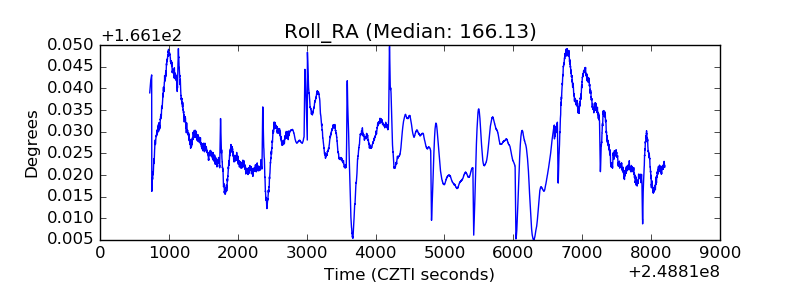 |
| Veto Counter | 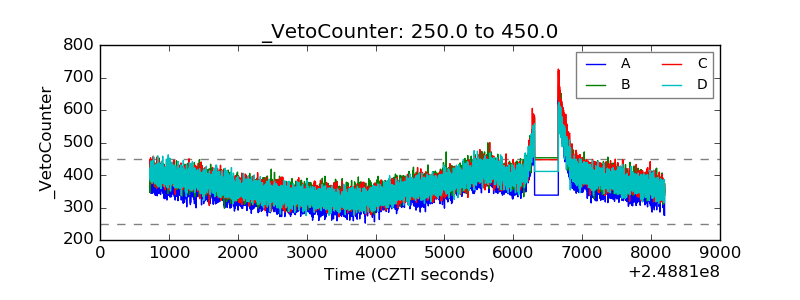 |