| Param | Original file | Final file |
|---|---|---|
| Filename | modeM0/AS1A04_130T04_9000001704_11602cztM0_level2.evt | modeM0/AS1A04_130T04_9000001704_11602cztM0_level2_quad_clean.evt |
| Size (bytes) | 264,093,120 | 16,701,120 |
| Size | 251.9 MB | 15.9 MB |
| Events in quadrant A | 3,079,584 | 81,465 |
| Events in quadrant B | 2,013,036 | 84,076 |
| Events in quadrant C | 1,141,083 | 86,252 |
| Events in quadrant D | 1,603,496 | 83,939 |
| Mode M0 | |||
|---|---|---|---|
| Quadrant | BADHDUFLAG | Total packets | Discarded packets |
| A | 0 | 10811 | 1 |
| B | 0 | 7620 | 1 |
| C | 0 | 4921 | 1 |
| D | 0 | 6353 | 1 |
| Mode SS | |||
|---|---|---|---|
| Quadrant | BADHDUFLAG | Total packets | Discarded packets |
| A | 0 | 50 | 0 |
| B | 0 | 50 | 0 |
| C | 0 | 50 | 0 |
| D | 0 | 50 | 0 |
| Mode M9 | |||
|---|---|---|---|
| Quadrant | BADHDUFLAG | Total packets | Discarded packets |
| A | 0 | 3 | 0 |
| B | 0 | 3 | 0 |
| C | 0 | 3 | 0 |
| D | 0 | 3 | 0 |
| Quadrant | Total seconds | Saturated seconds | Saturation percentage |
|---|---|---|---|
| A | 2345 | 526 | 22.430704% |
| B | 2345 | 272 | 11.599147% |
| C | 2345 | 23 | 0.980810% |
| D | 2345 | 134 | 5.714286% |
Noise dominated data is calculated using 1-second bins in cleaned event files. If a bin has >2000 counts, and if more than 50% of those come from <1% of pixels, then it is considered to be noise-dominated and hence unusable.
| Quadrant | # 1 sec bins | Bins with >0 counts | Bins with >2000 counts | High rate bins dominated by noise | Noise dominated (total time) | Noise dominated (detector-on time) | Marked lightcurve |
|---|---|---|---|---|---|---|---|
| A | 2691 | 2347 | 226 | 226 | 8.40% | 9.63% | 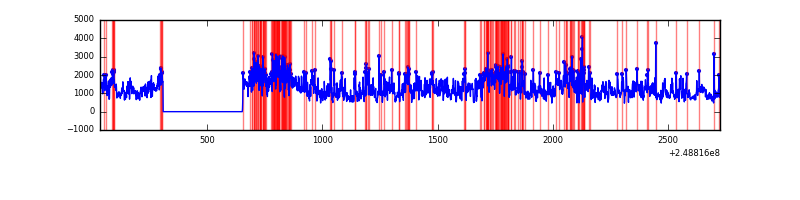 |
| B | 2691 | 2347 | 112 | 112 | 4.16% | 4.77% | 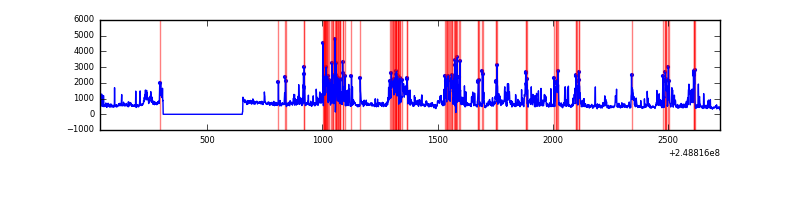 |
| C | 2691 | 2347 | 0 | 0 | 0.00% | 0.00% | 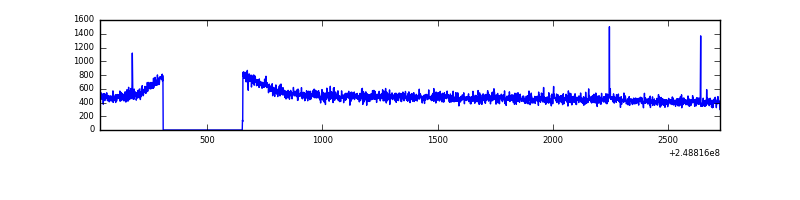 |
| D | 2691 | 2347 | 29 | 29 | 1.08% | 1.24% | 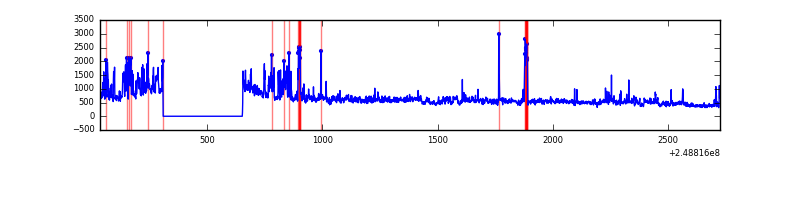 |
Top three noisy pixels from each quadrant. If the there are fewer than three noisy pixels in the level2.evt file, extra rows are filled as -1
| Pixel properties | Quadrant properties | ||||||
|---|---|---|---|---|---|---|---|
| Quadrant | DetID | PixID | Counts | Sigma | Mean | Median | Sigma |
| A | 8 | 5 | 1848245 | 31839.39 | 271 | 264 | 58.0 |
| A | 1 | 162 | 66286 | 1137.51 | 271 | 264 | 58.0 |
| A | 1 | 178 | 38296 | 655.26 | 271 | 264 | 58.0 |
| B | 4 | 239 | 486128 | 8521.25 | 285 | 278 | 57.0 |
| B | 10 | 16 | 177612 | 3110.24 | 285 | 278 | 57.0 |
| B | 3 | 64 | 119536 | 2091.65 | 285 | 278 | 57.0 |
| C | 8 | 128 | 3938 | 53.34 | 288 | 288 | 68.4 |
| C | 12 | 4 | 3001 | 39.65 | 288 | 288 | 68.4 |
| C | 9 | 54 | 2667 | 34.77 | 288 | 288 | 68.4 |
| D | 1 | 52 | 194272 | 2752.8 | 285 | 275 | 70.5 |
| D | 5 | 222 | 166172 | 2354.06 | 285 | 275 | 70.5 |
| D | 13 | 122 | 47891 | 675.67 | 285 | 275 | 70.5 |
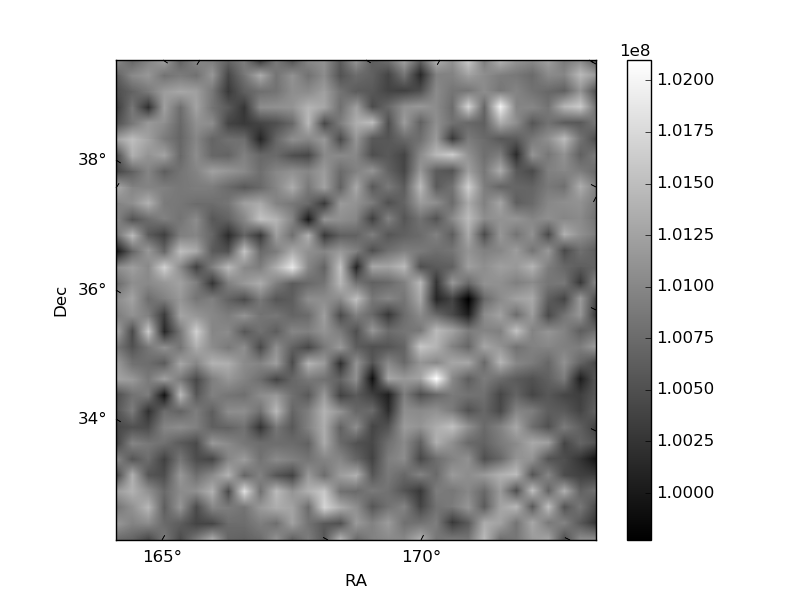
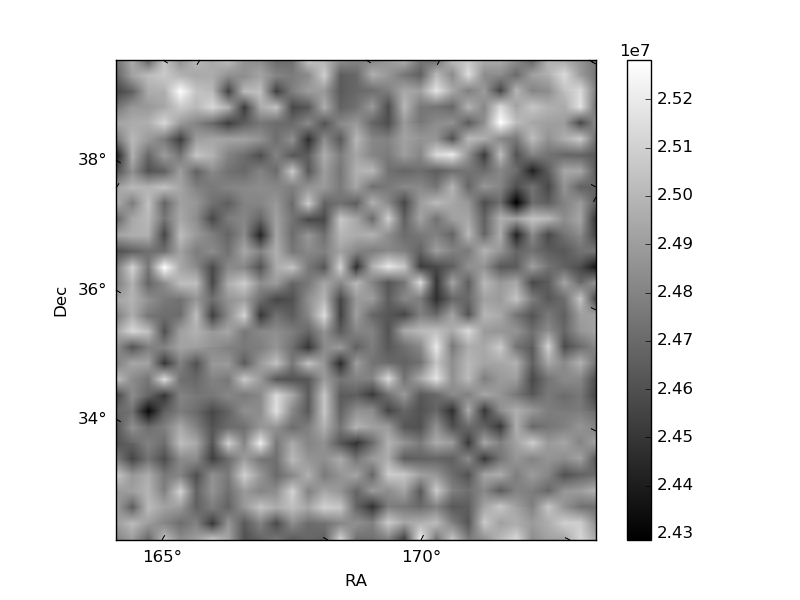
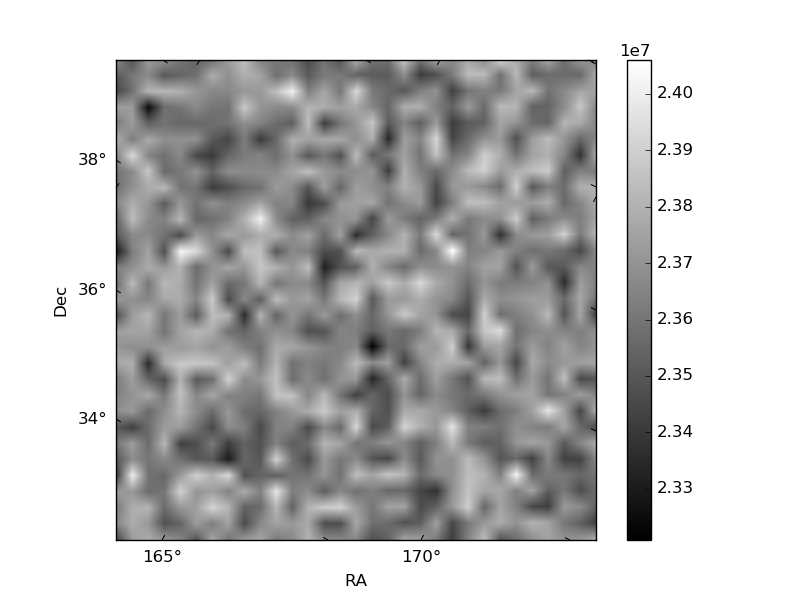
Histogram calculated using DETX and DETY for each event in the final _common_clean file
| Quadrant A | 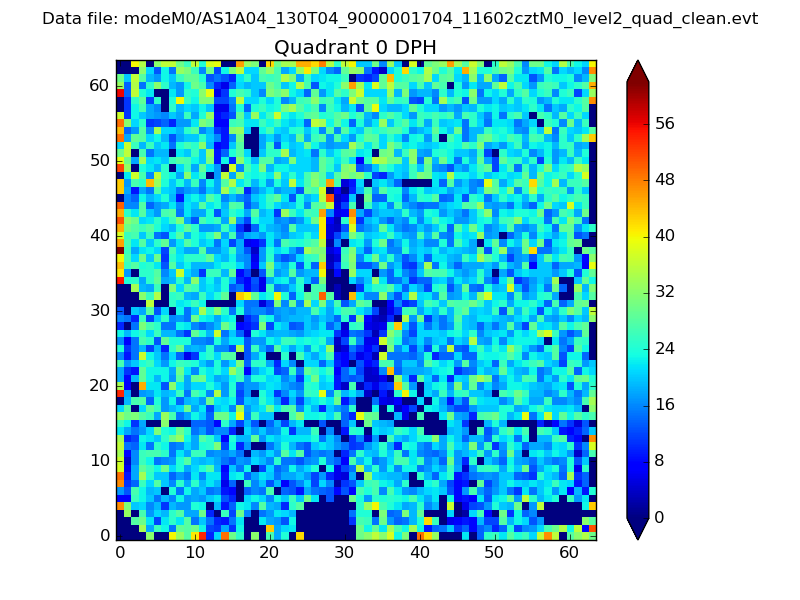 |
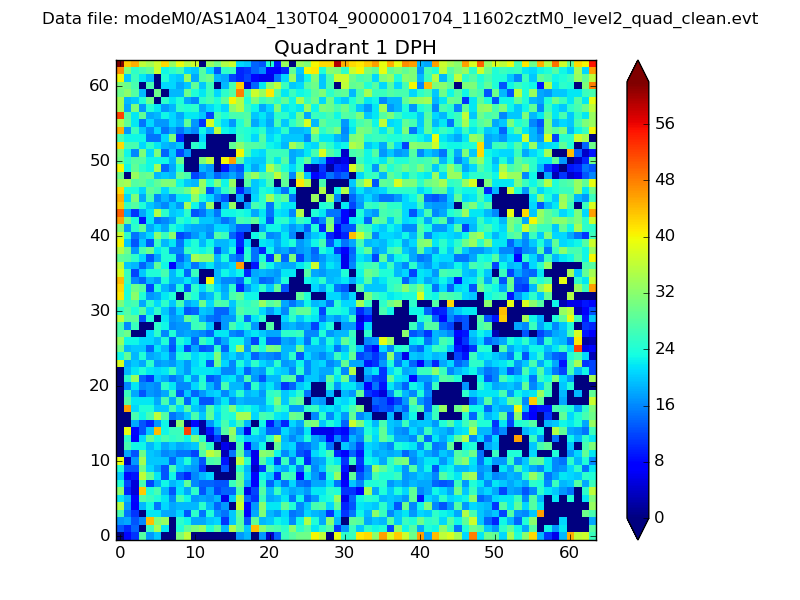 |
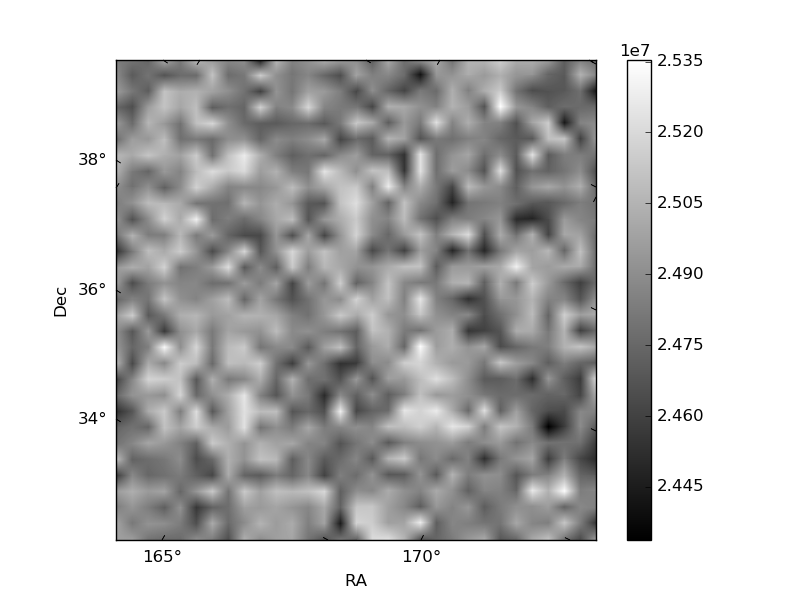
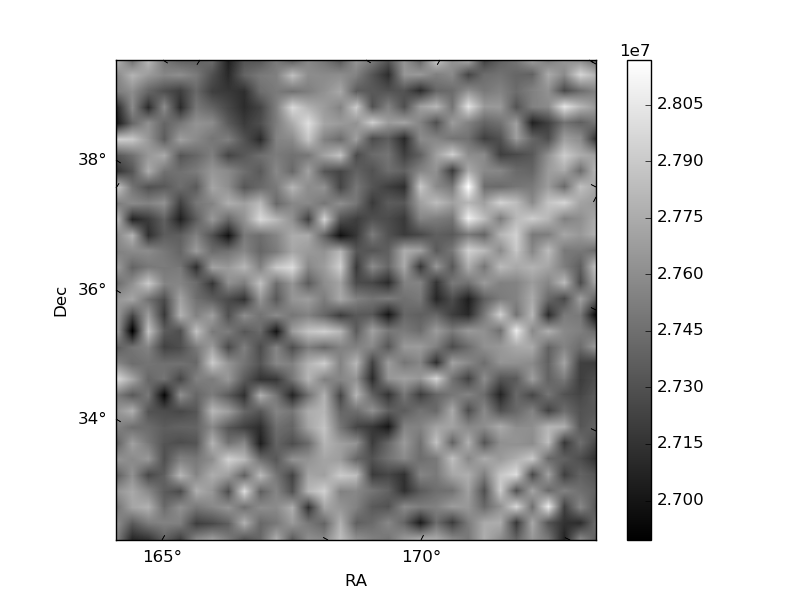
Quadrant B |
|---|---|---|---|
| Quadrant D | 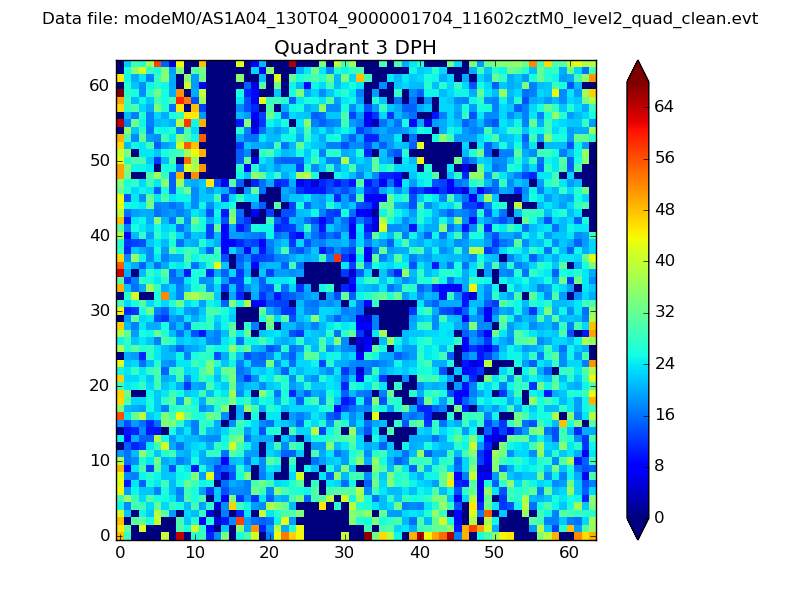 |
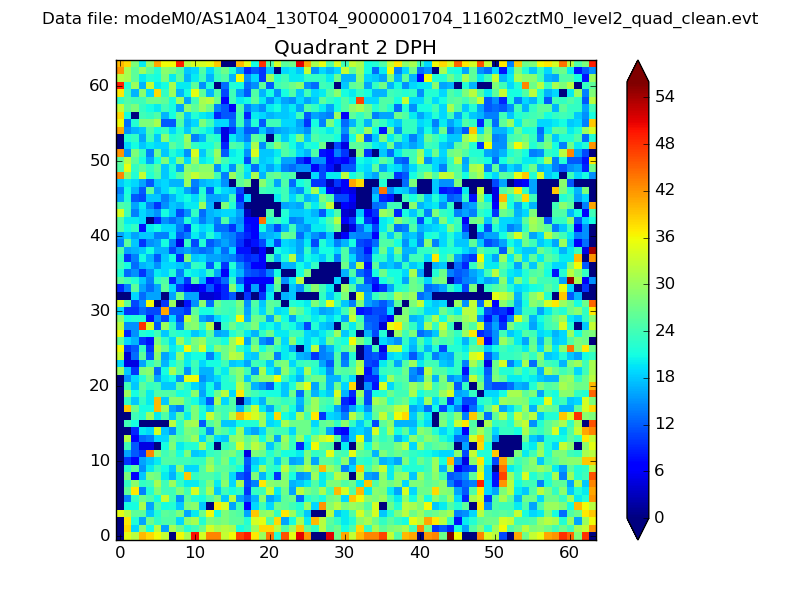 |
Quadrant C |
| Plot type | Count rate plots | Images |
|---|---|---|
| Comparison with Poisson distribution Blue bars denote a histogram of data divided into 1 sec bins. Red curve is a Poisson curve with rate = median count rate of data. |
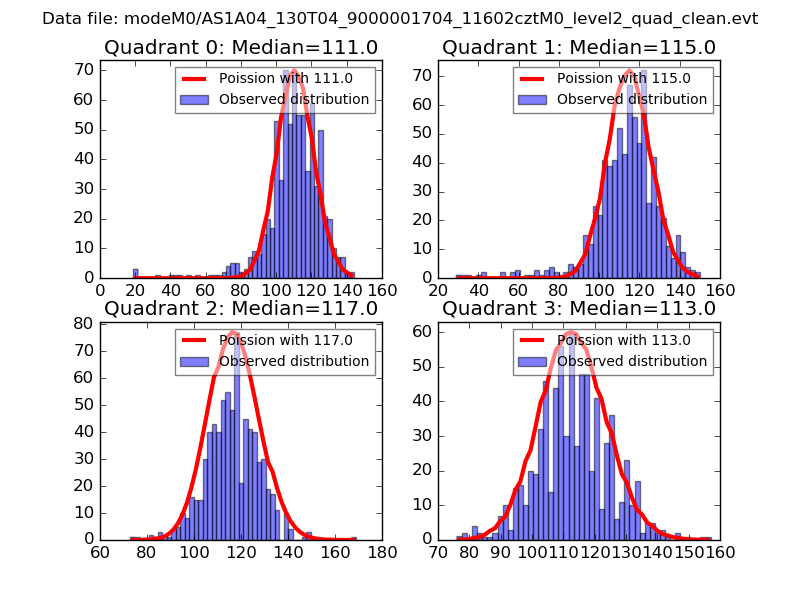 |
 |
| Quadrant-wise count rates Data is divided into 100 sec bins |
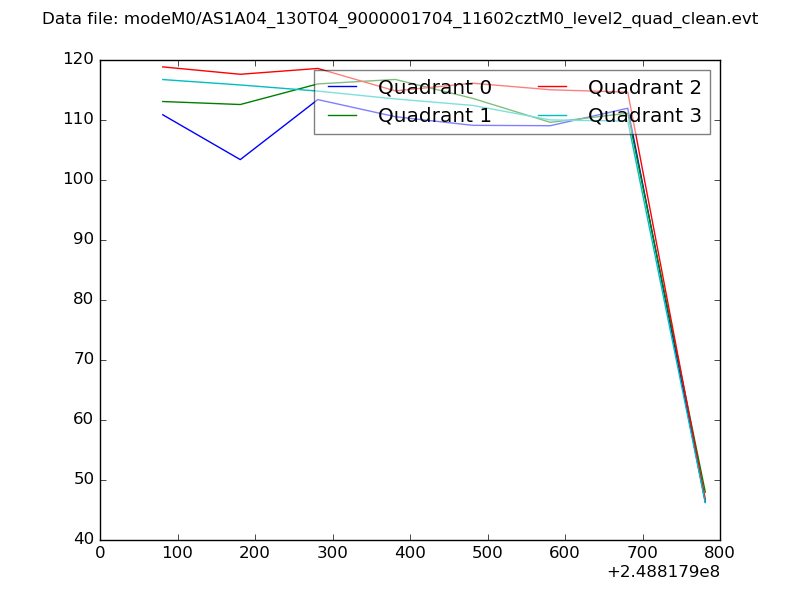 |
|
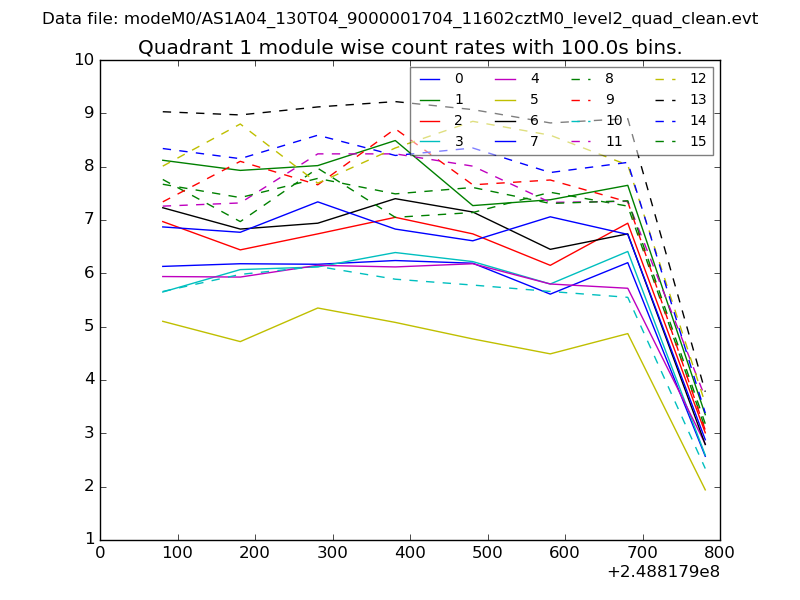
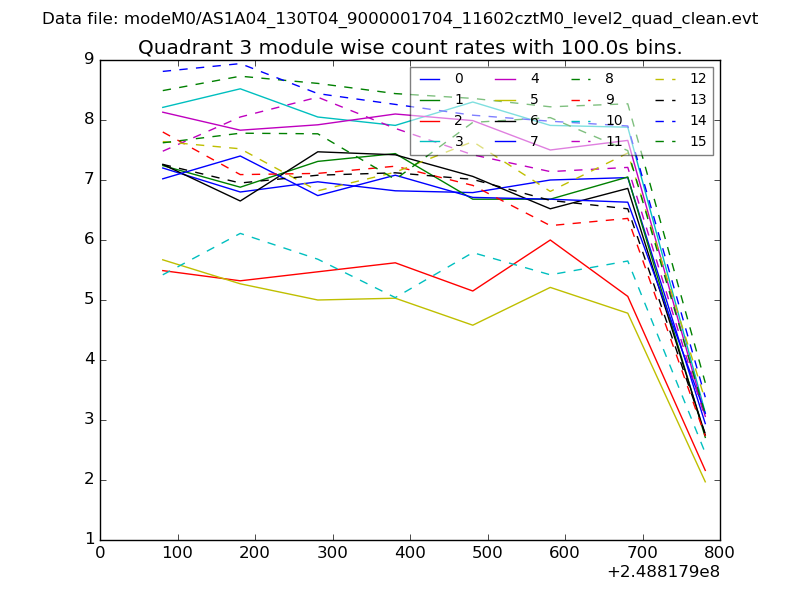
| Module-wise count rates for Quadrant A Data is divided into 100 sec bins |
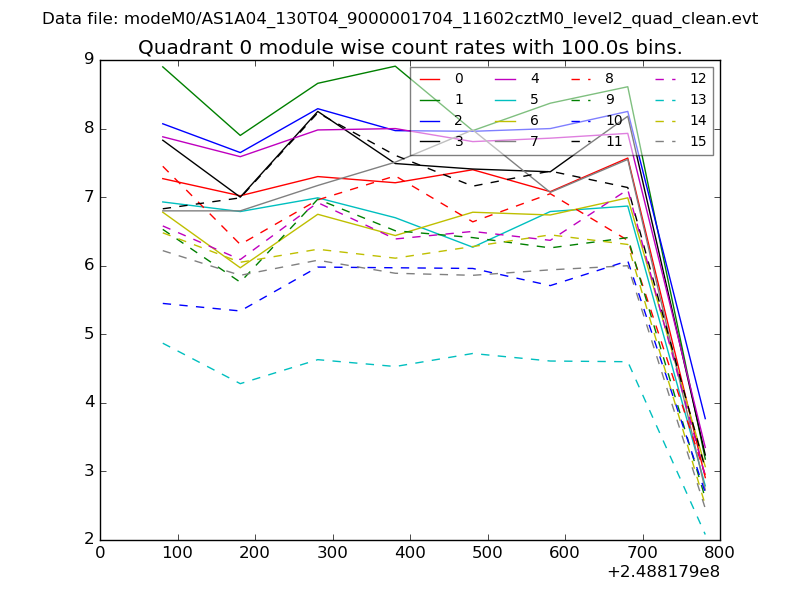 |
 |
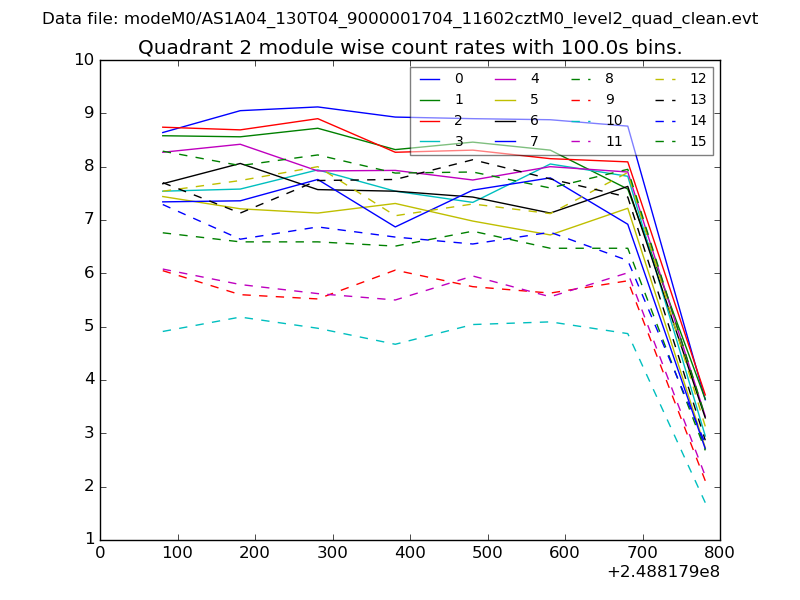
| Module-wise count rates for Quadrant B Data is divided into 100 sec bins |
 |
 |
| Module-wise count rates for Quadrant C Data is divided into 100 sec bins |
 |
 |
| Module-wise count rates for Quadrant D Data is divided into 100 sec bins |
 |
 |
| Parameter | Plot |
|---|---|
| CZT HV Monitor | 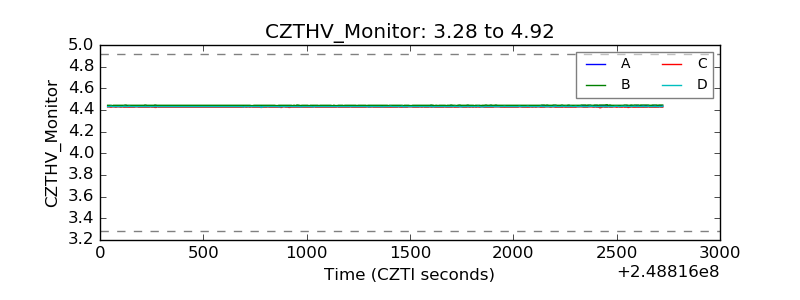 |
| D_VDD | 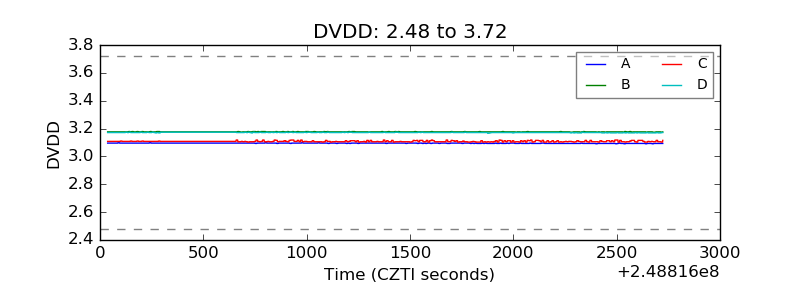 |
| Temperature 1 | 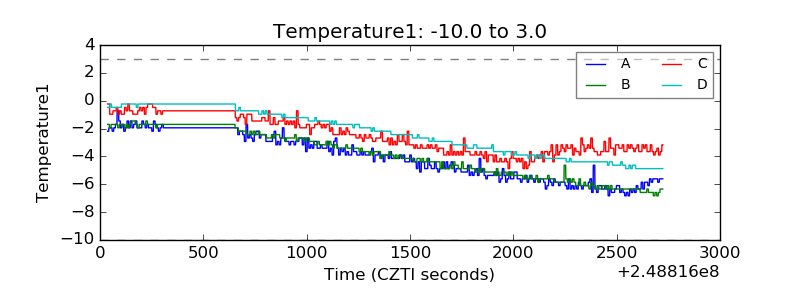 |
| Veto HV Monitor | 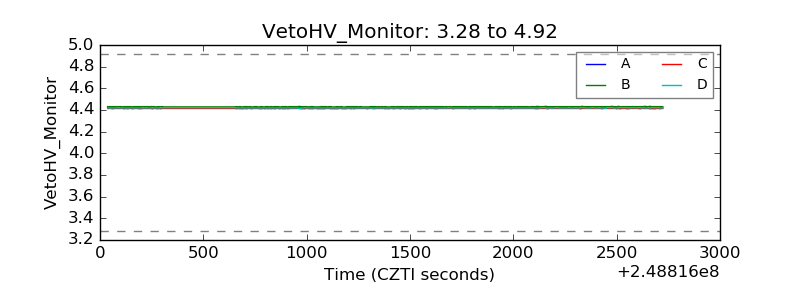 |
| Veto LLD | 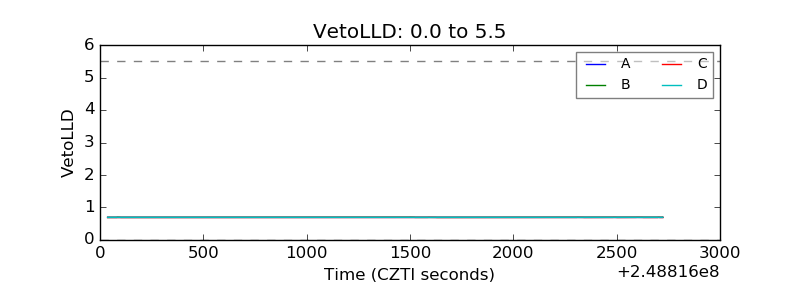 |
| Alpha Counter | 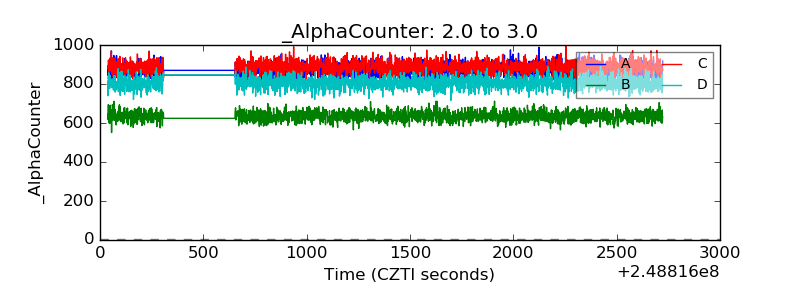 |
| _CPM_Rate | 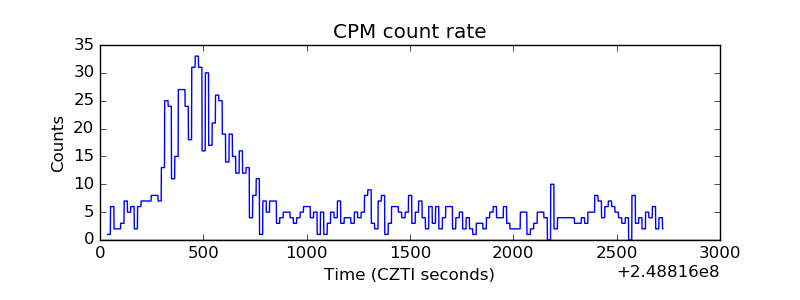 |
| CZT Counter | 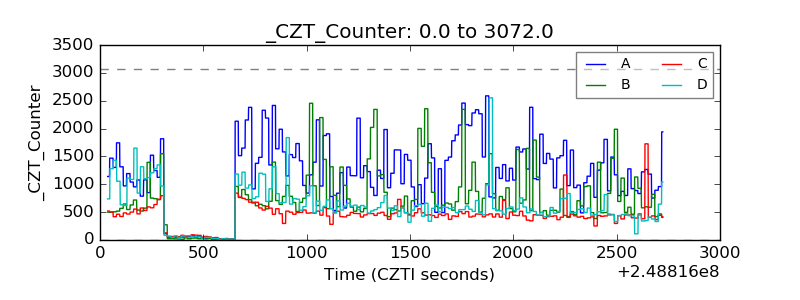 |
| +2.5 Volts monitor |  |
| +5 Volts monitor |  |
| _ROLL_ROT | 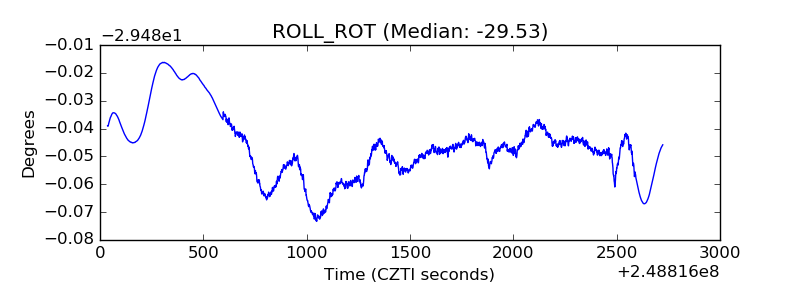 |
| _Roll_DEC |  |
| _Roll_RA | 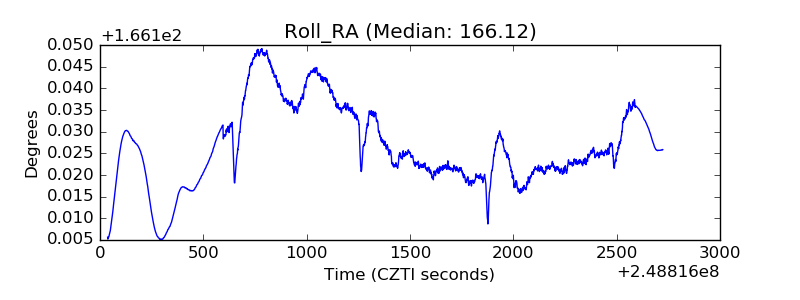 |
| Veto Counter | 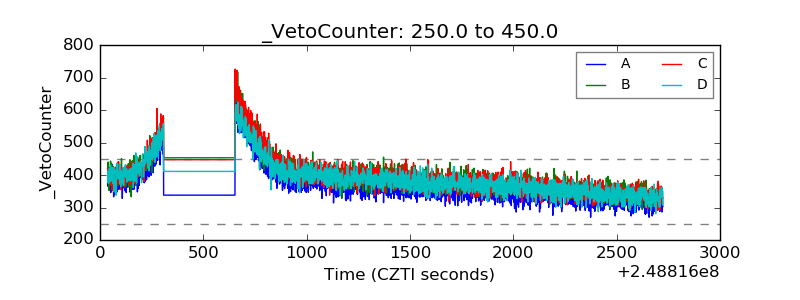 |